
















Copyright: ©Author(s) 2026.
World J Stem Cells. Sep 26, 2026; 18(9): 124515
Published online Sep 26, 2026. doi: 10.4252/wjsc.124515
Published online Sep 26, 2026. doi: 10.4252/wjsc.124515
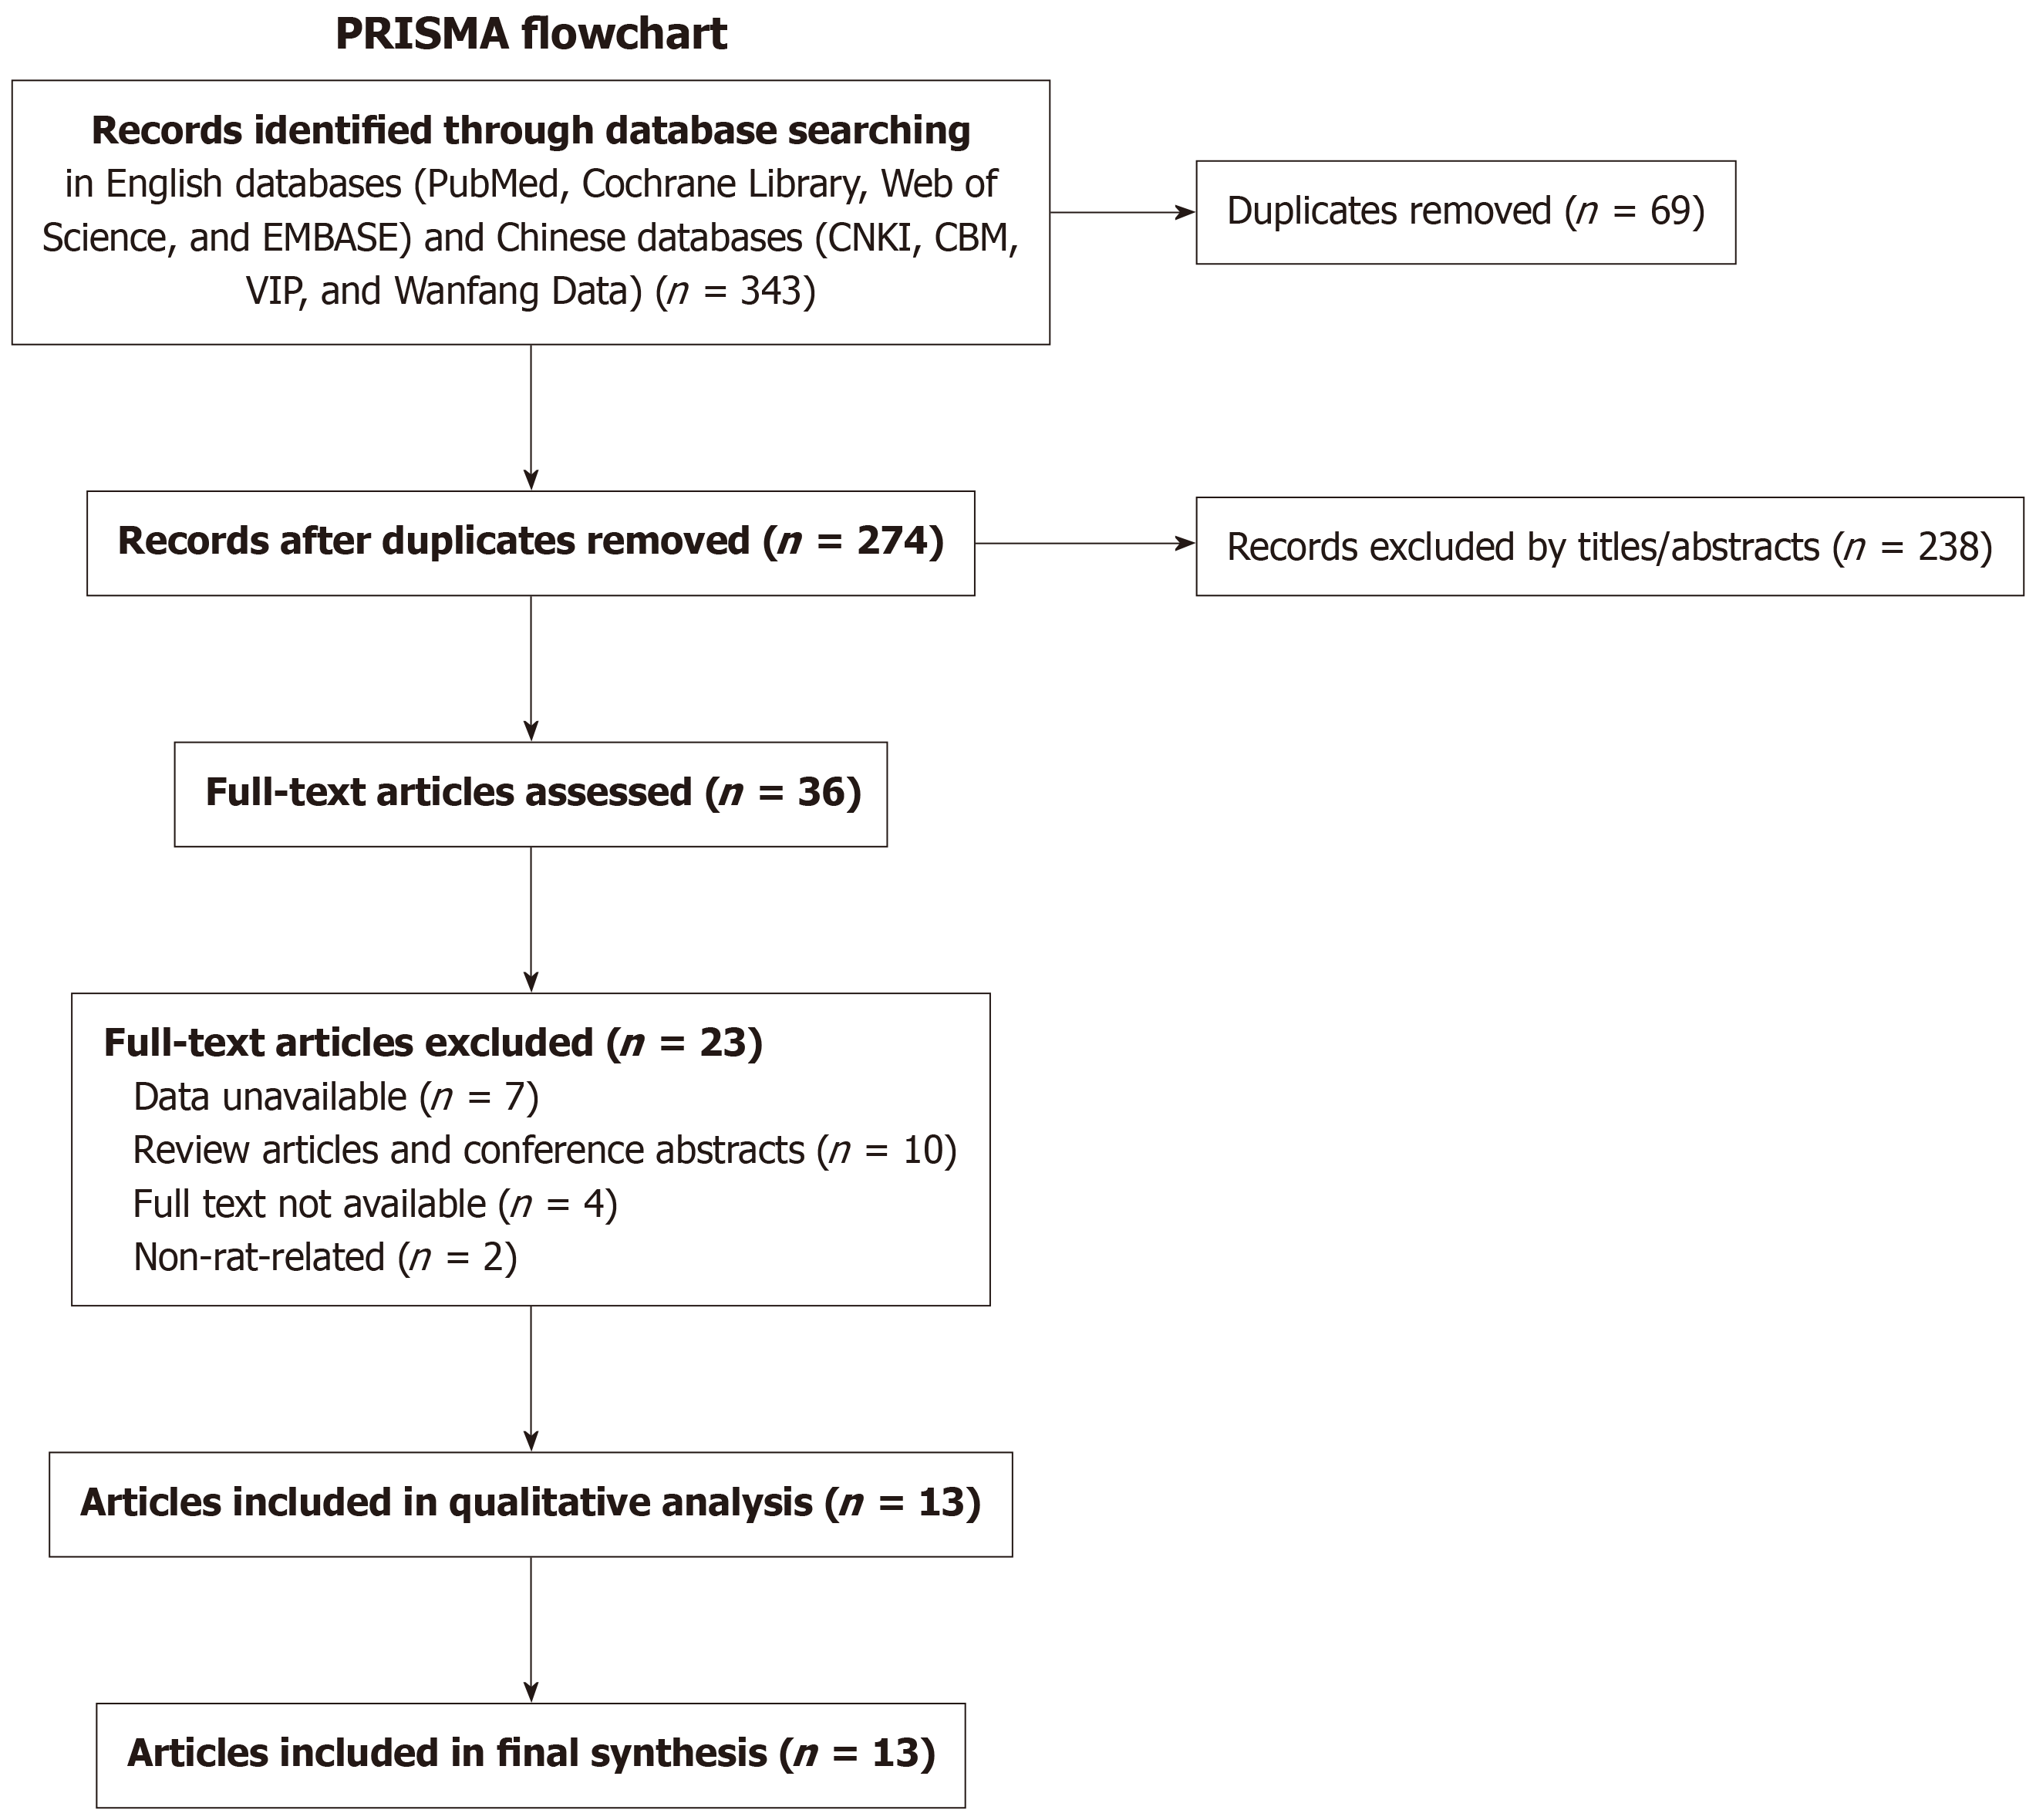
Figure 1
Flow diagram of the study.
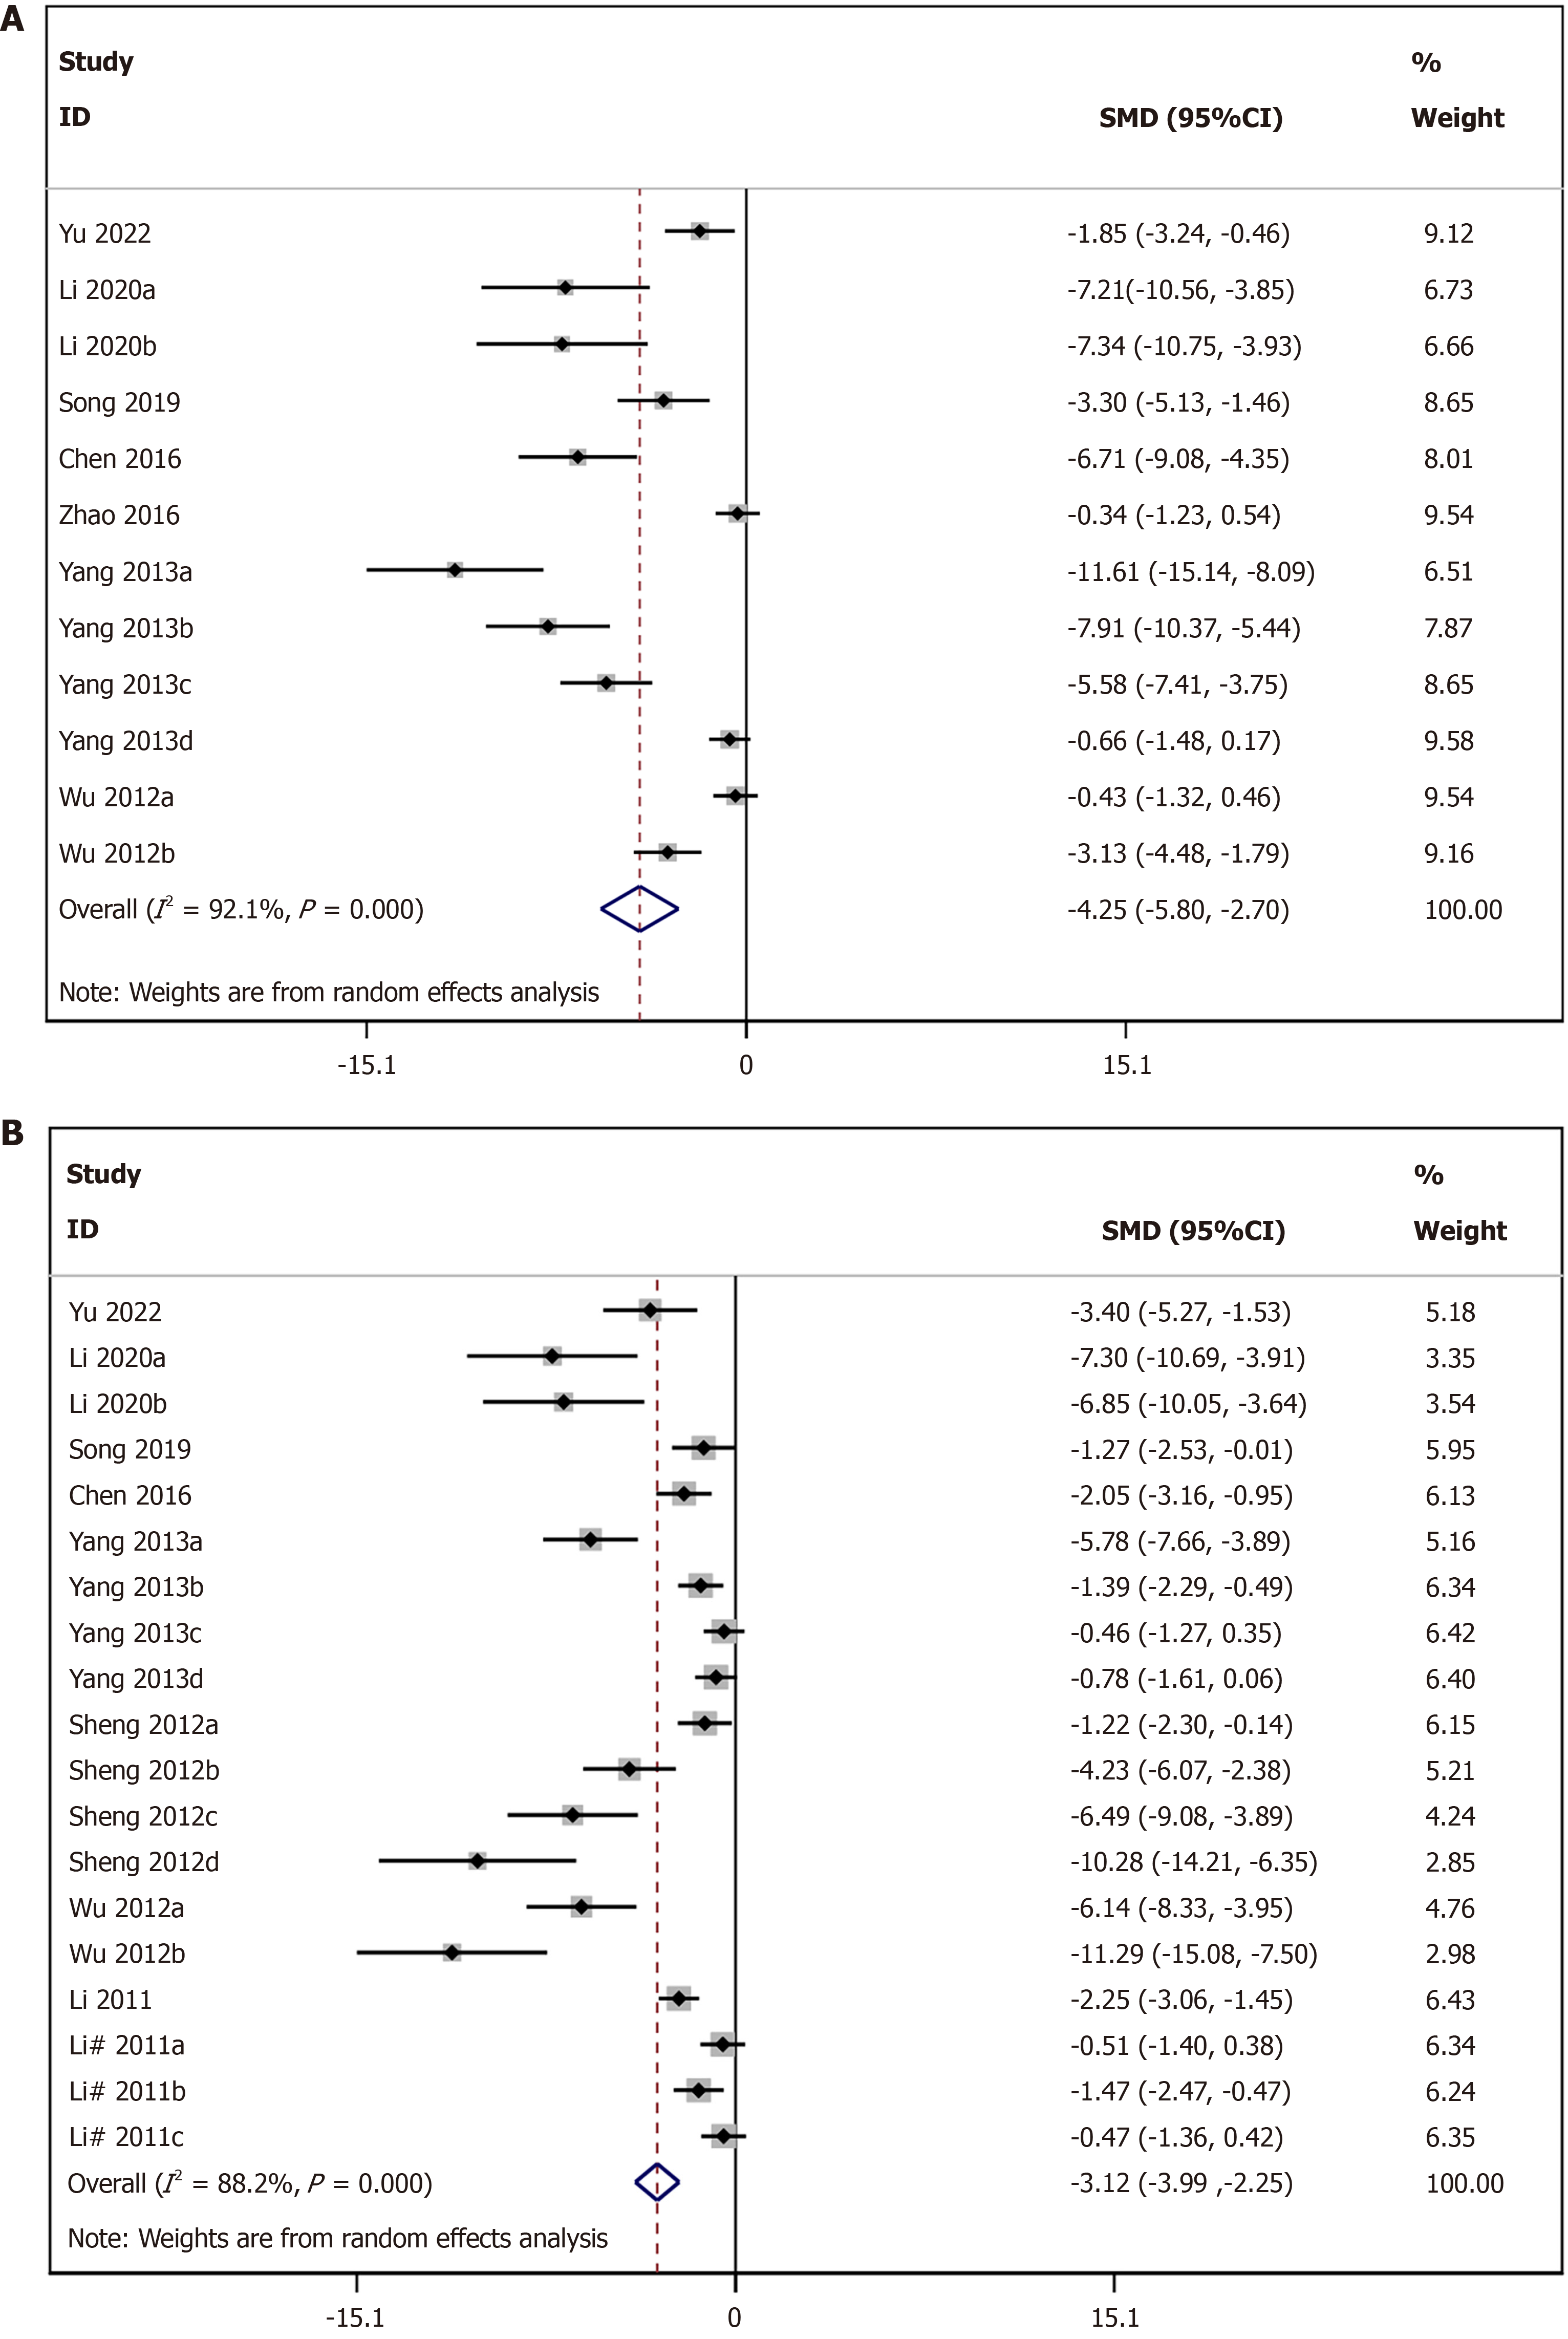
Figure 2 Meta-analysis of pancreatic and lung histopathological scores in severe acute pancreatitis rats: Stem cell therapy group vs control group.
Letters after the study name (e.g., “a” and “b”) indicate experimental results at different time points within the same study. A: Pancreatic histopathological scores; B: Lung histopathological scores. SMD: Standardized mean difference; CI: Confidence interval.
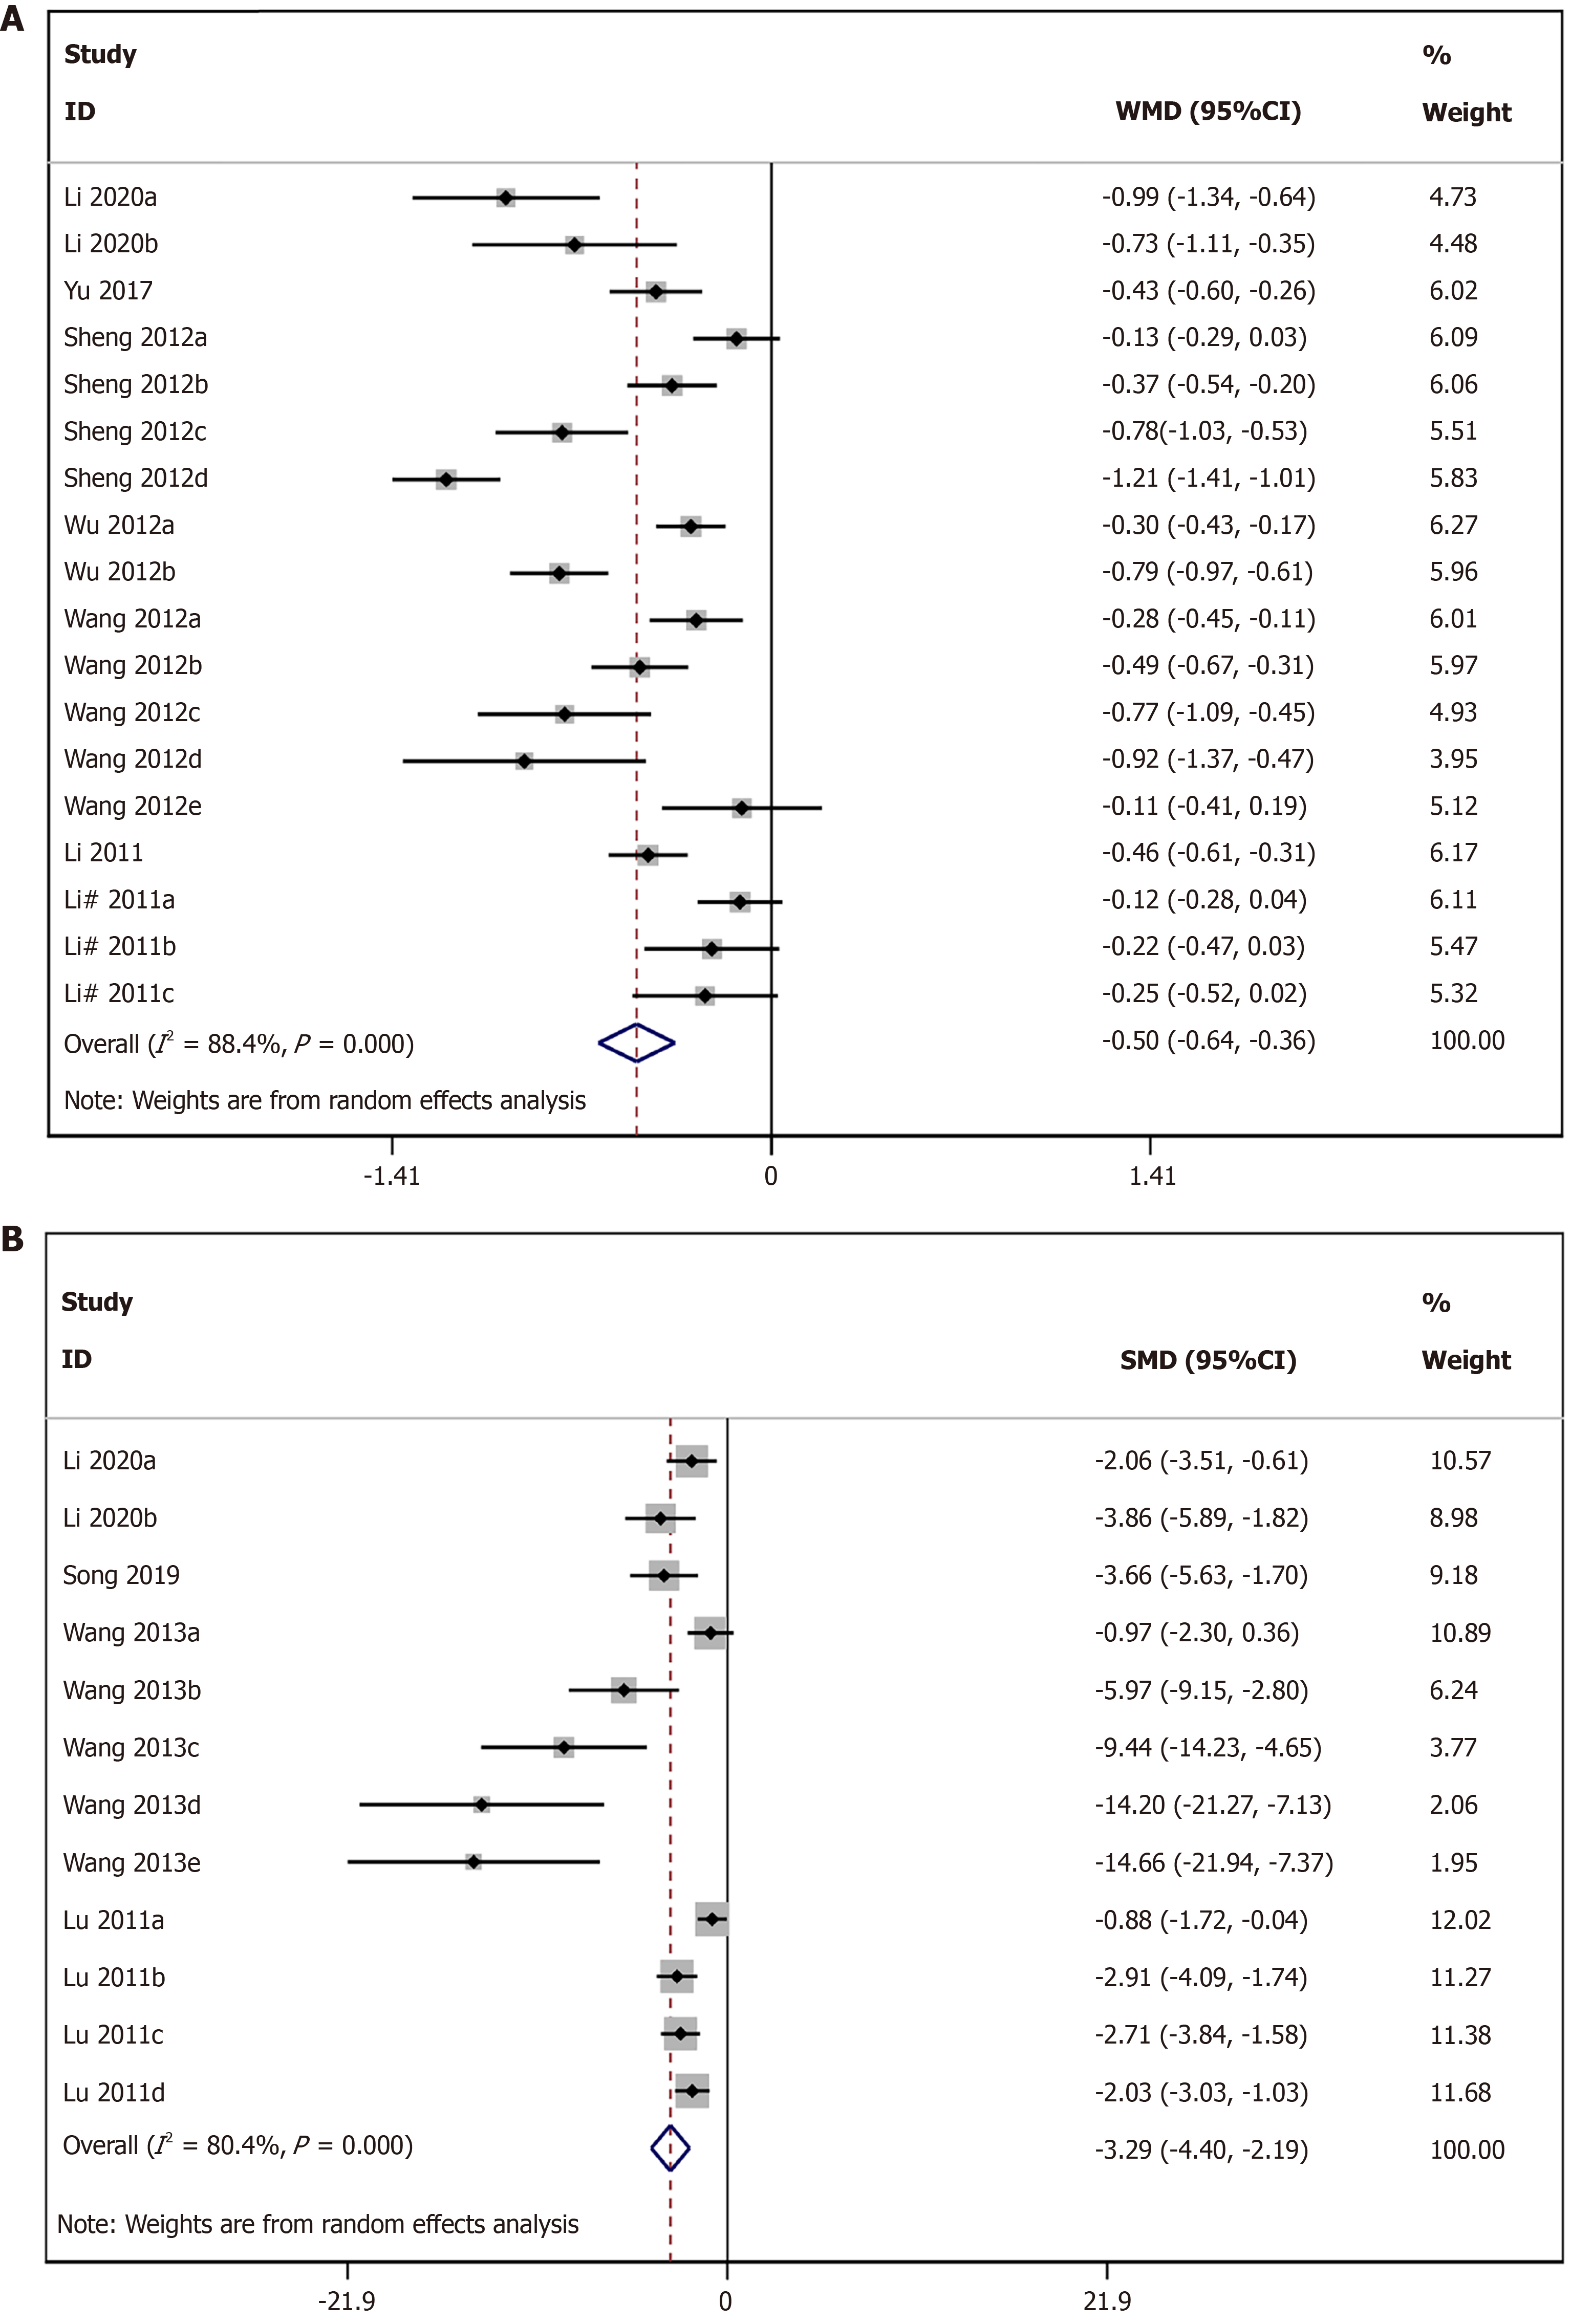
Figure 3 Meta-analysis of lung wet-to-dry weight ratio and myeloperoxidase activity in severe acute pancreatitis rats: Stem cell therapy group vs control group.
Letters after the study name (e.g., “a” and “b”) indicate experimental results at different time points within the same study. A: Wet-to-dry weight ratio; B: Myeloperoxidase. SMD: Standardized mean difference; CI: Confidence interval.
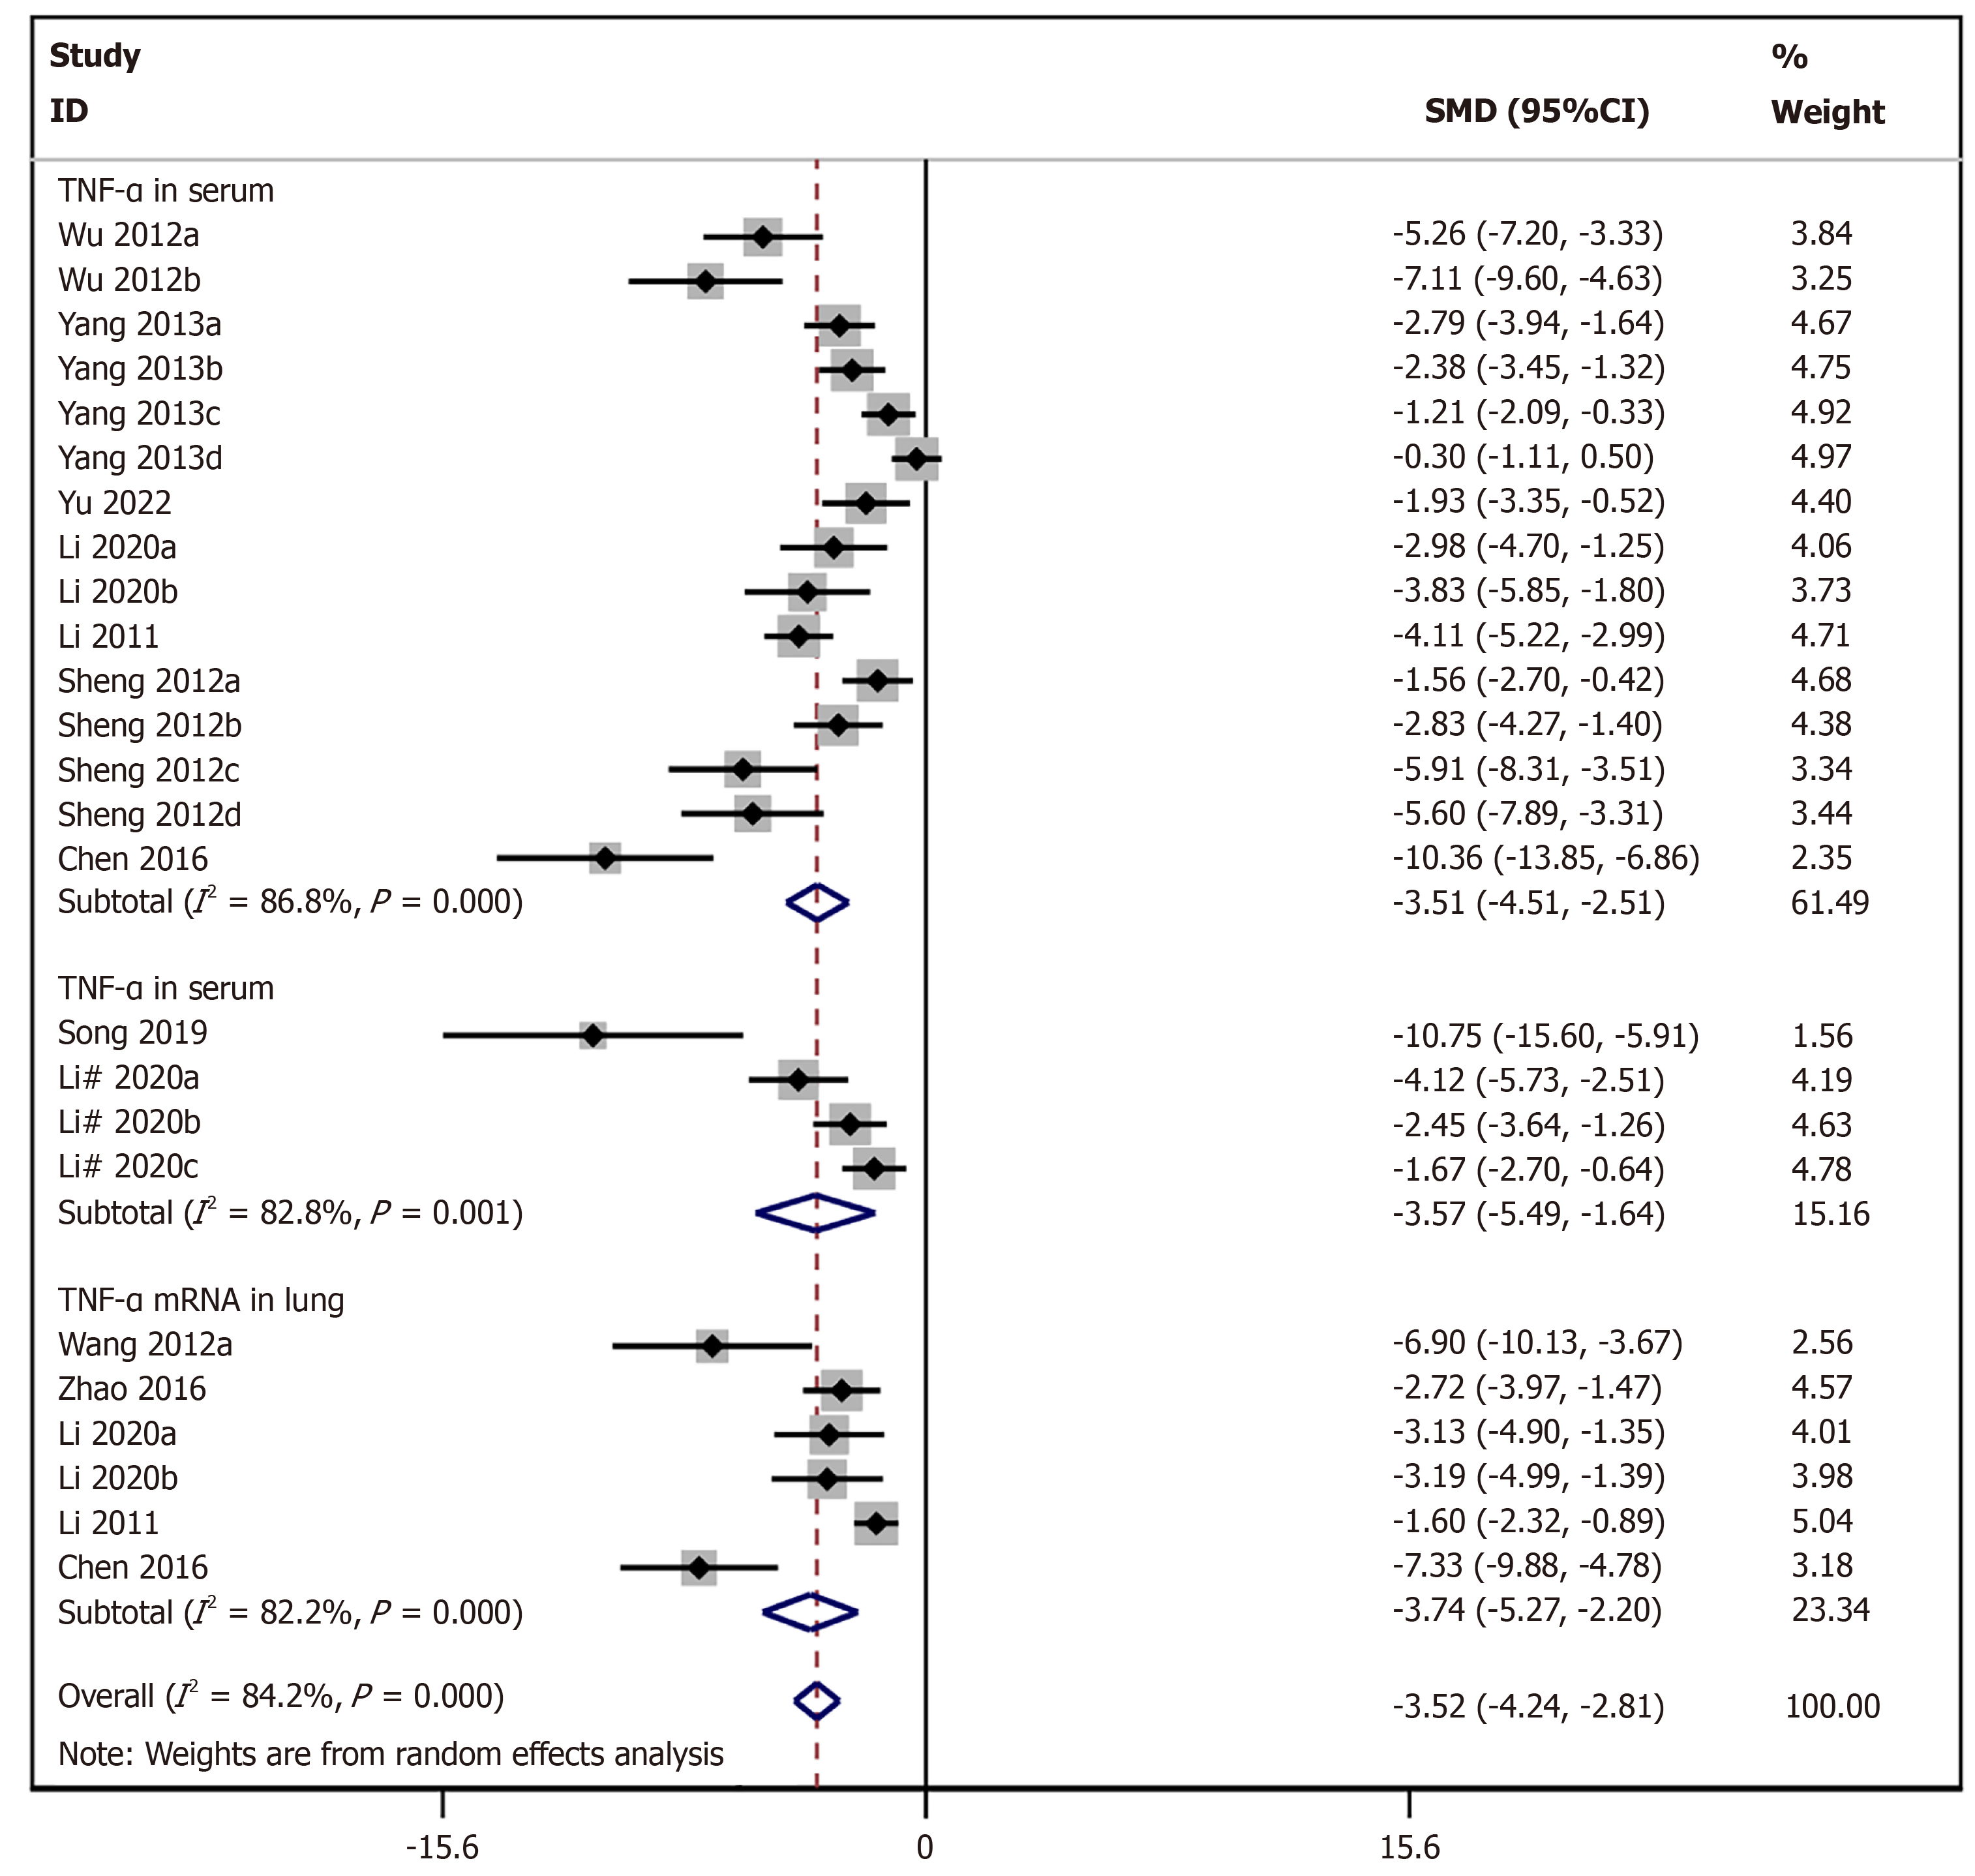
Figure 4 Meta-analysis of serum tumor necrosis factor-α levels, lung tumor necrosis factor-α levels, and lung tumor necrosis factor-α mRNA expression in severe acute pancreatitis rats: Stem cell therapy group vs control group.
Letters after the study name (e.g., “a” and “b”) indicate experimental results at different time points within the same study. SMD: Standardized mean difference; CI: Confidence interval.
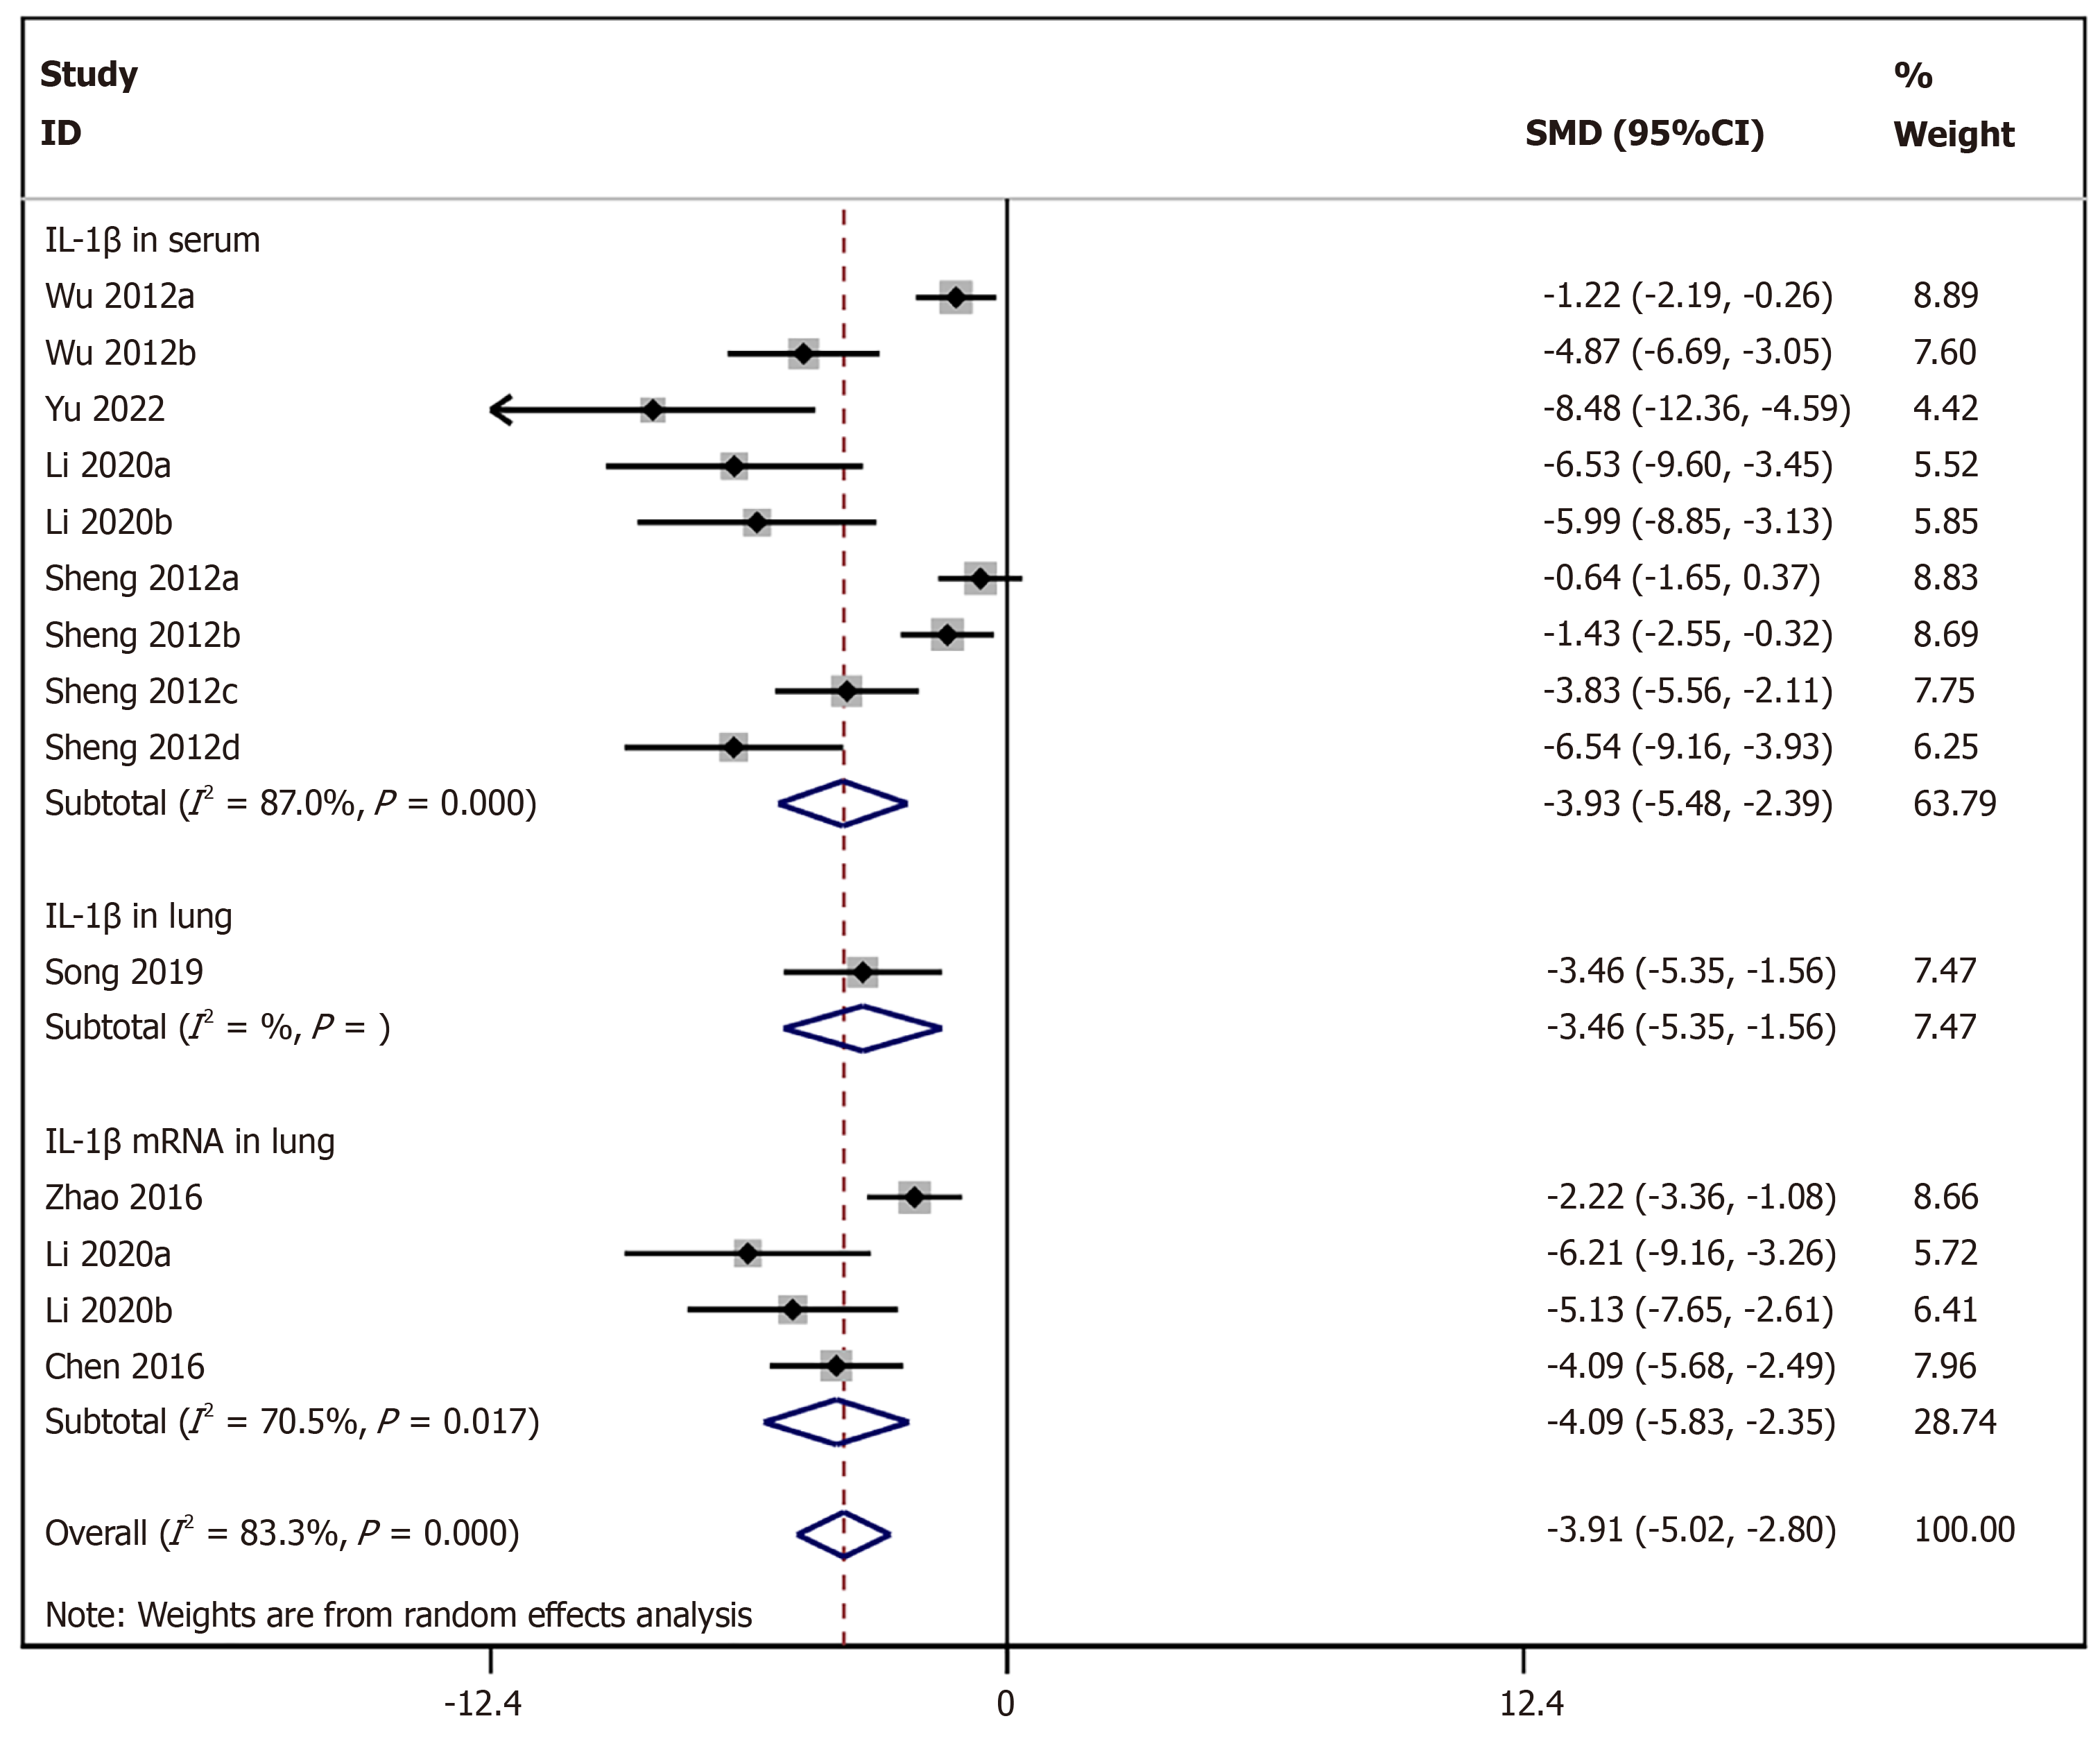
Figure 5 Meta-analysis of serum (interleukin-1β levels, lung interleukin-1β levels, and lung interleukin-1β mRNA expression in severe acute pancreatitis rats: Stem cell therapy group vs control group.
Letters after the study name (e.g., “a” and “b”) indicate experimental results at different time points within the same study. SMD: Standardized mean difference; CI: Confidence interval.
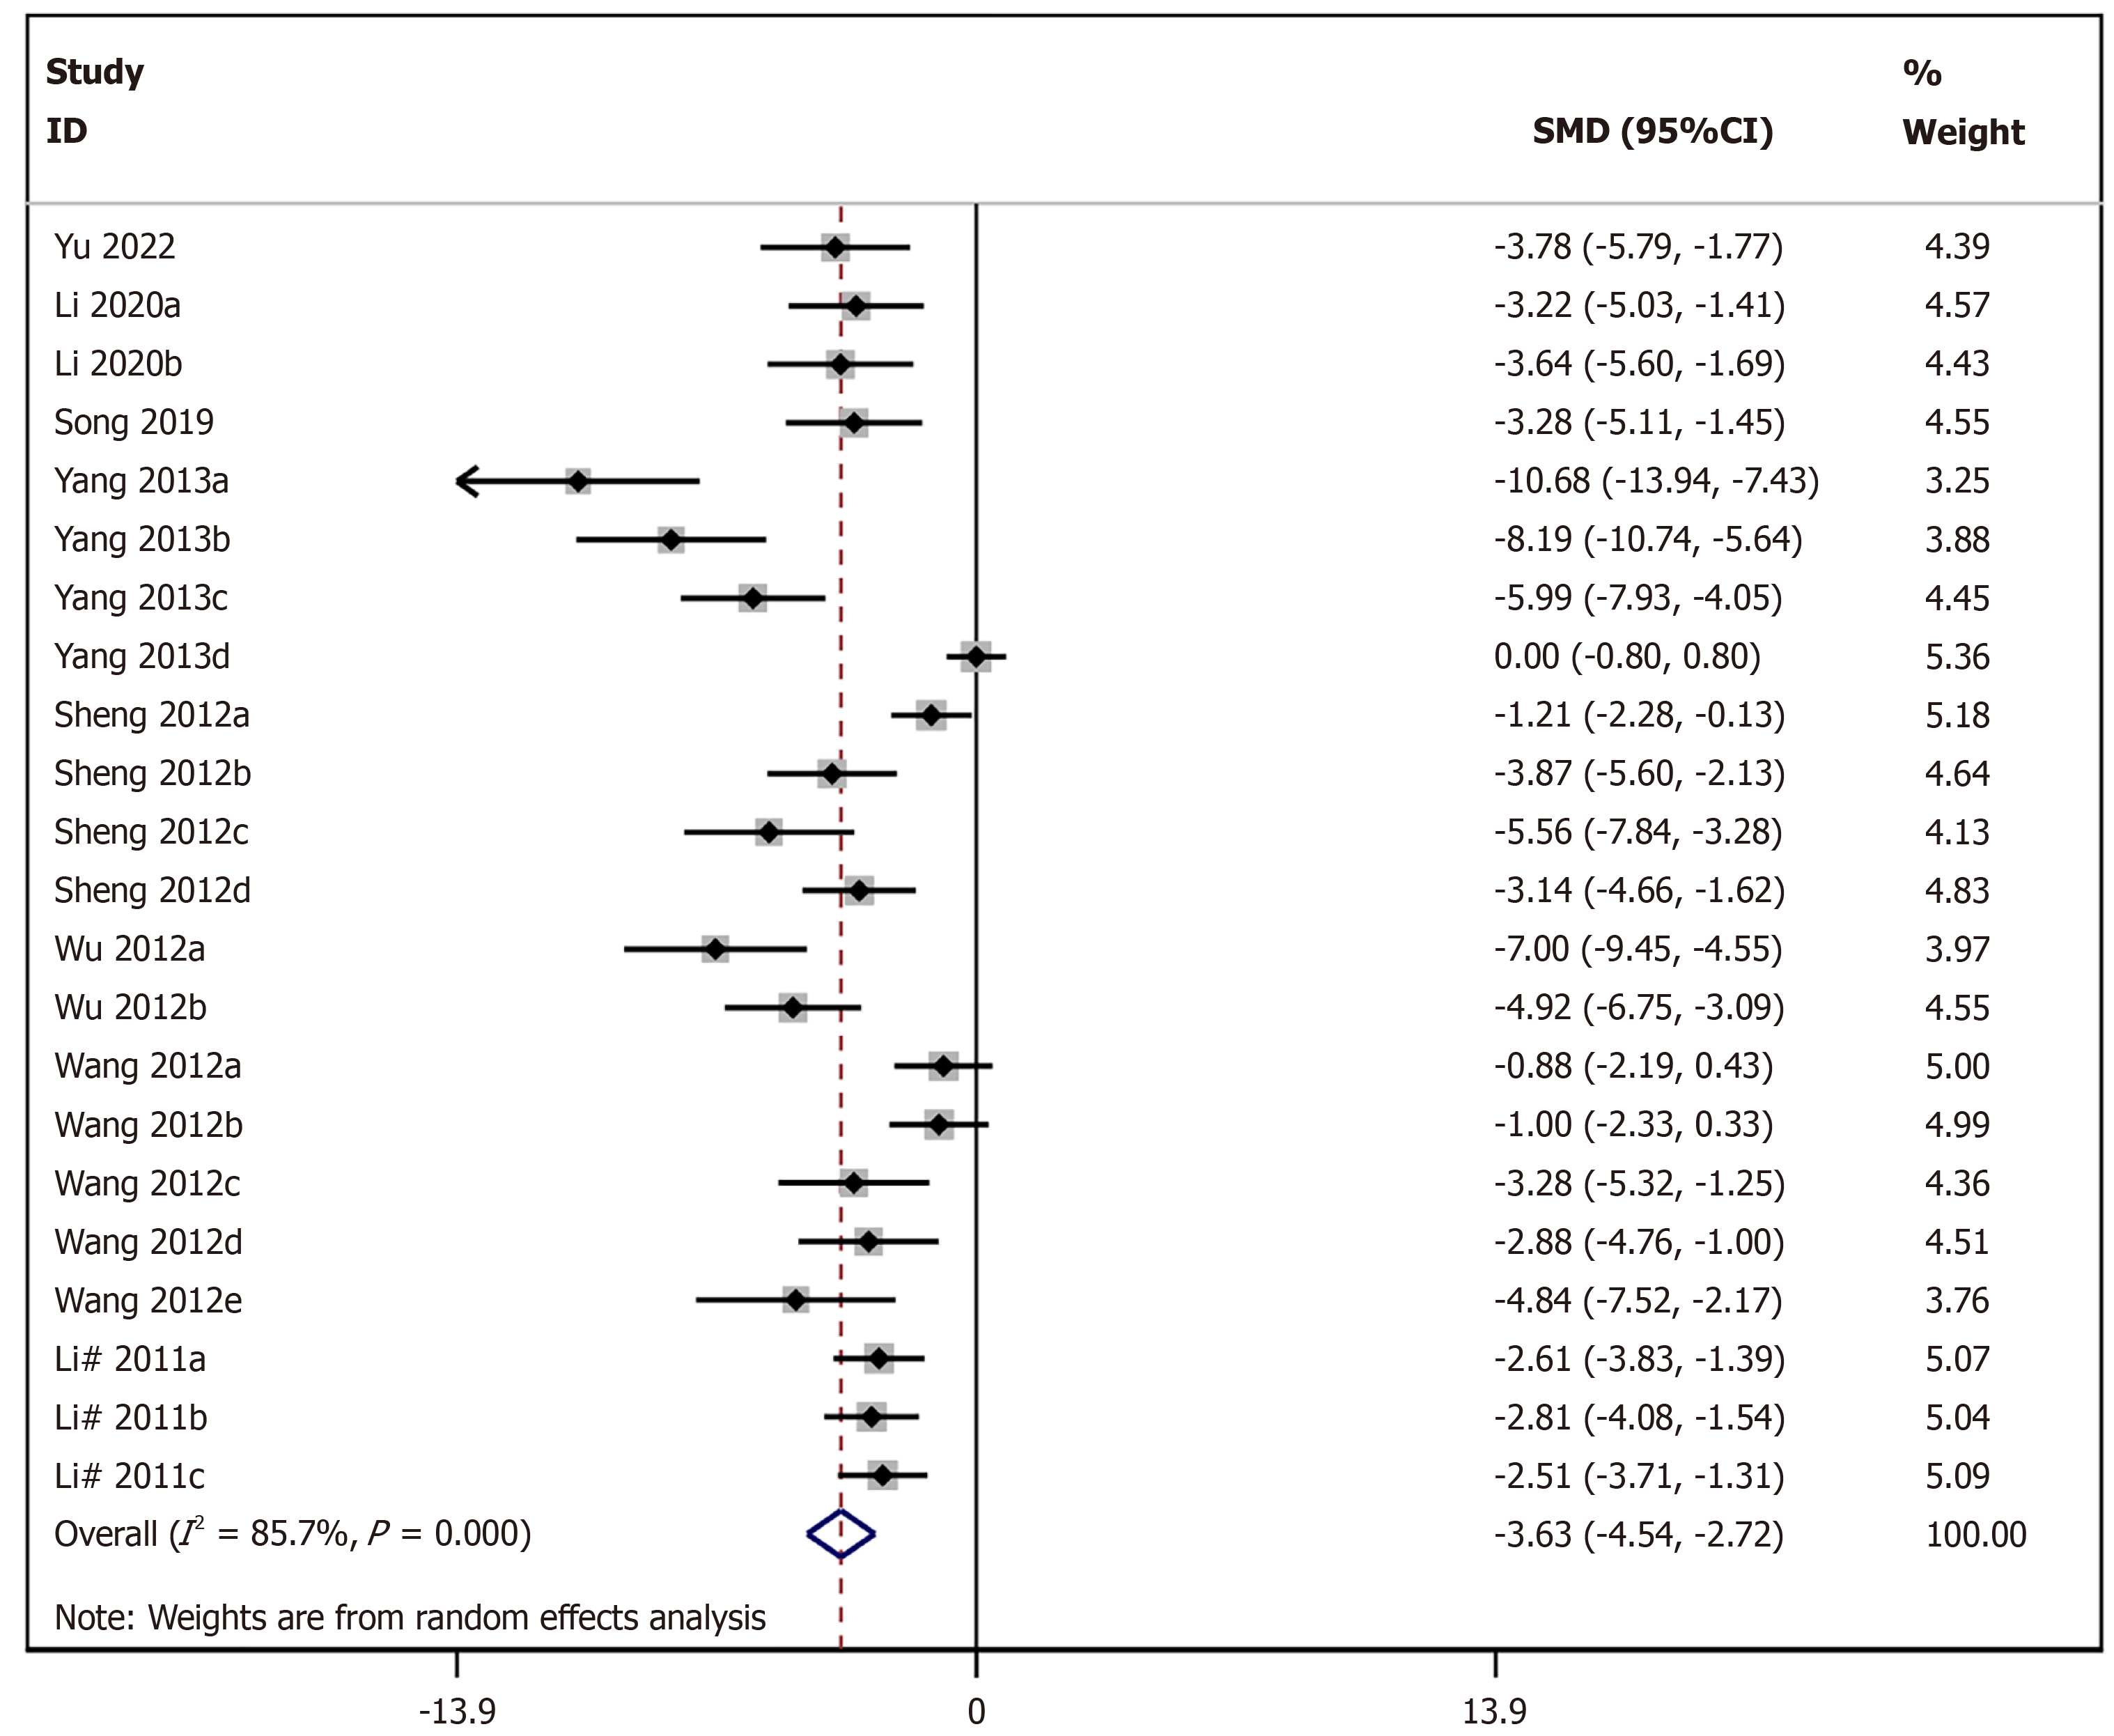
Figure 6 Meta-analysis of serum amylase levels in severe acute pancreatitis rats: Stem cell therapy group vs control group.
Letters after the study name (e.g., “a” and “b”) indicate experimental results at different time points within the same study. SMD: Standardized mean difference; CI: Confidence interval.
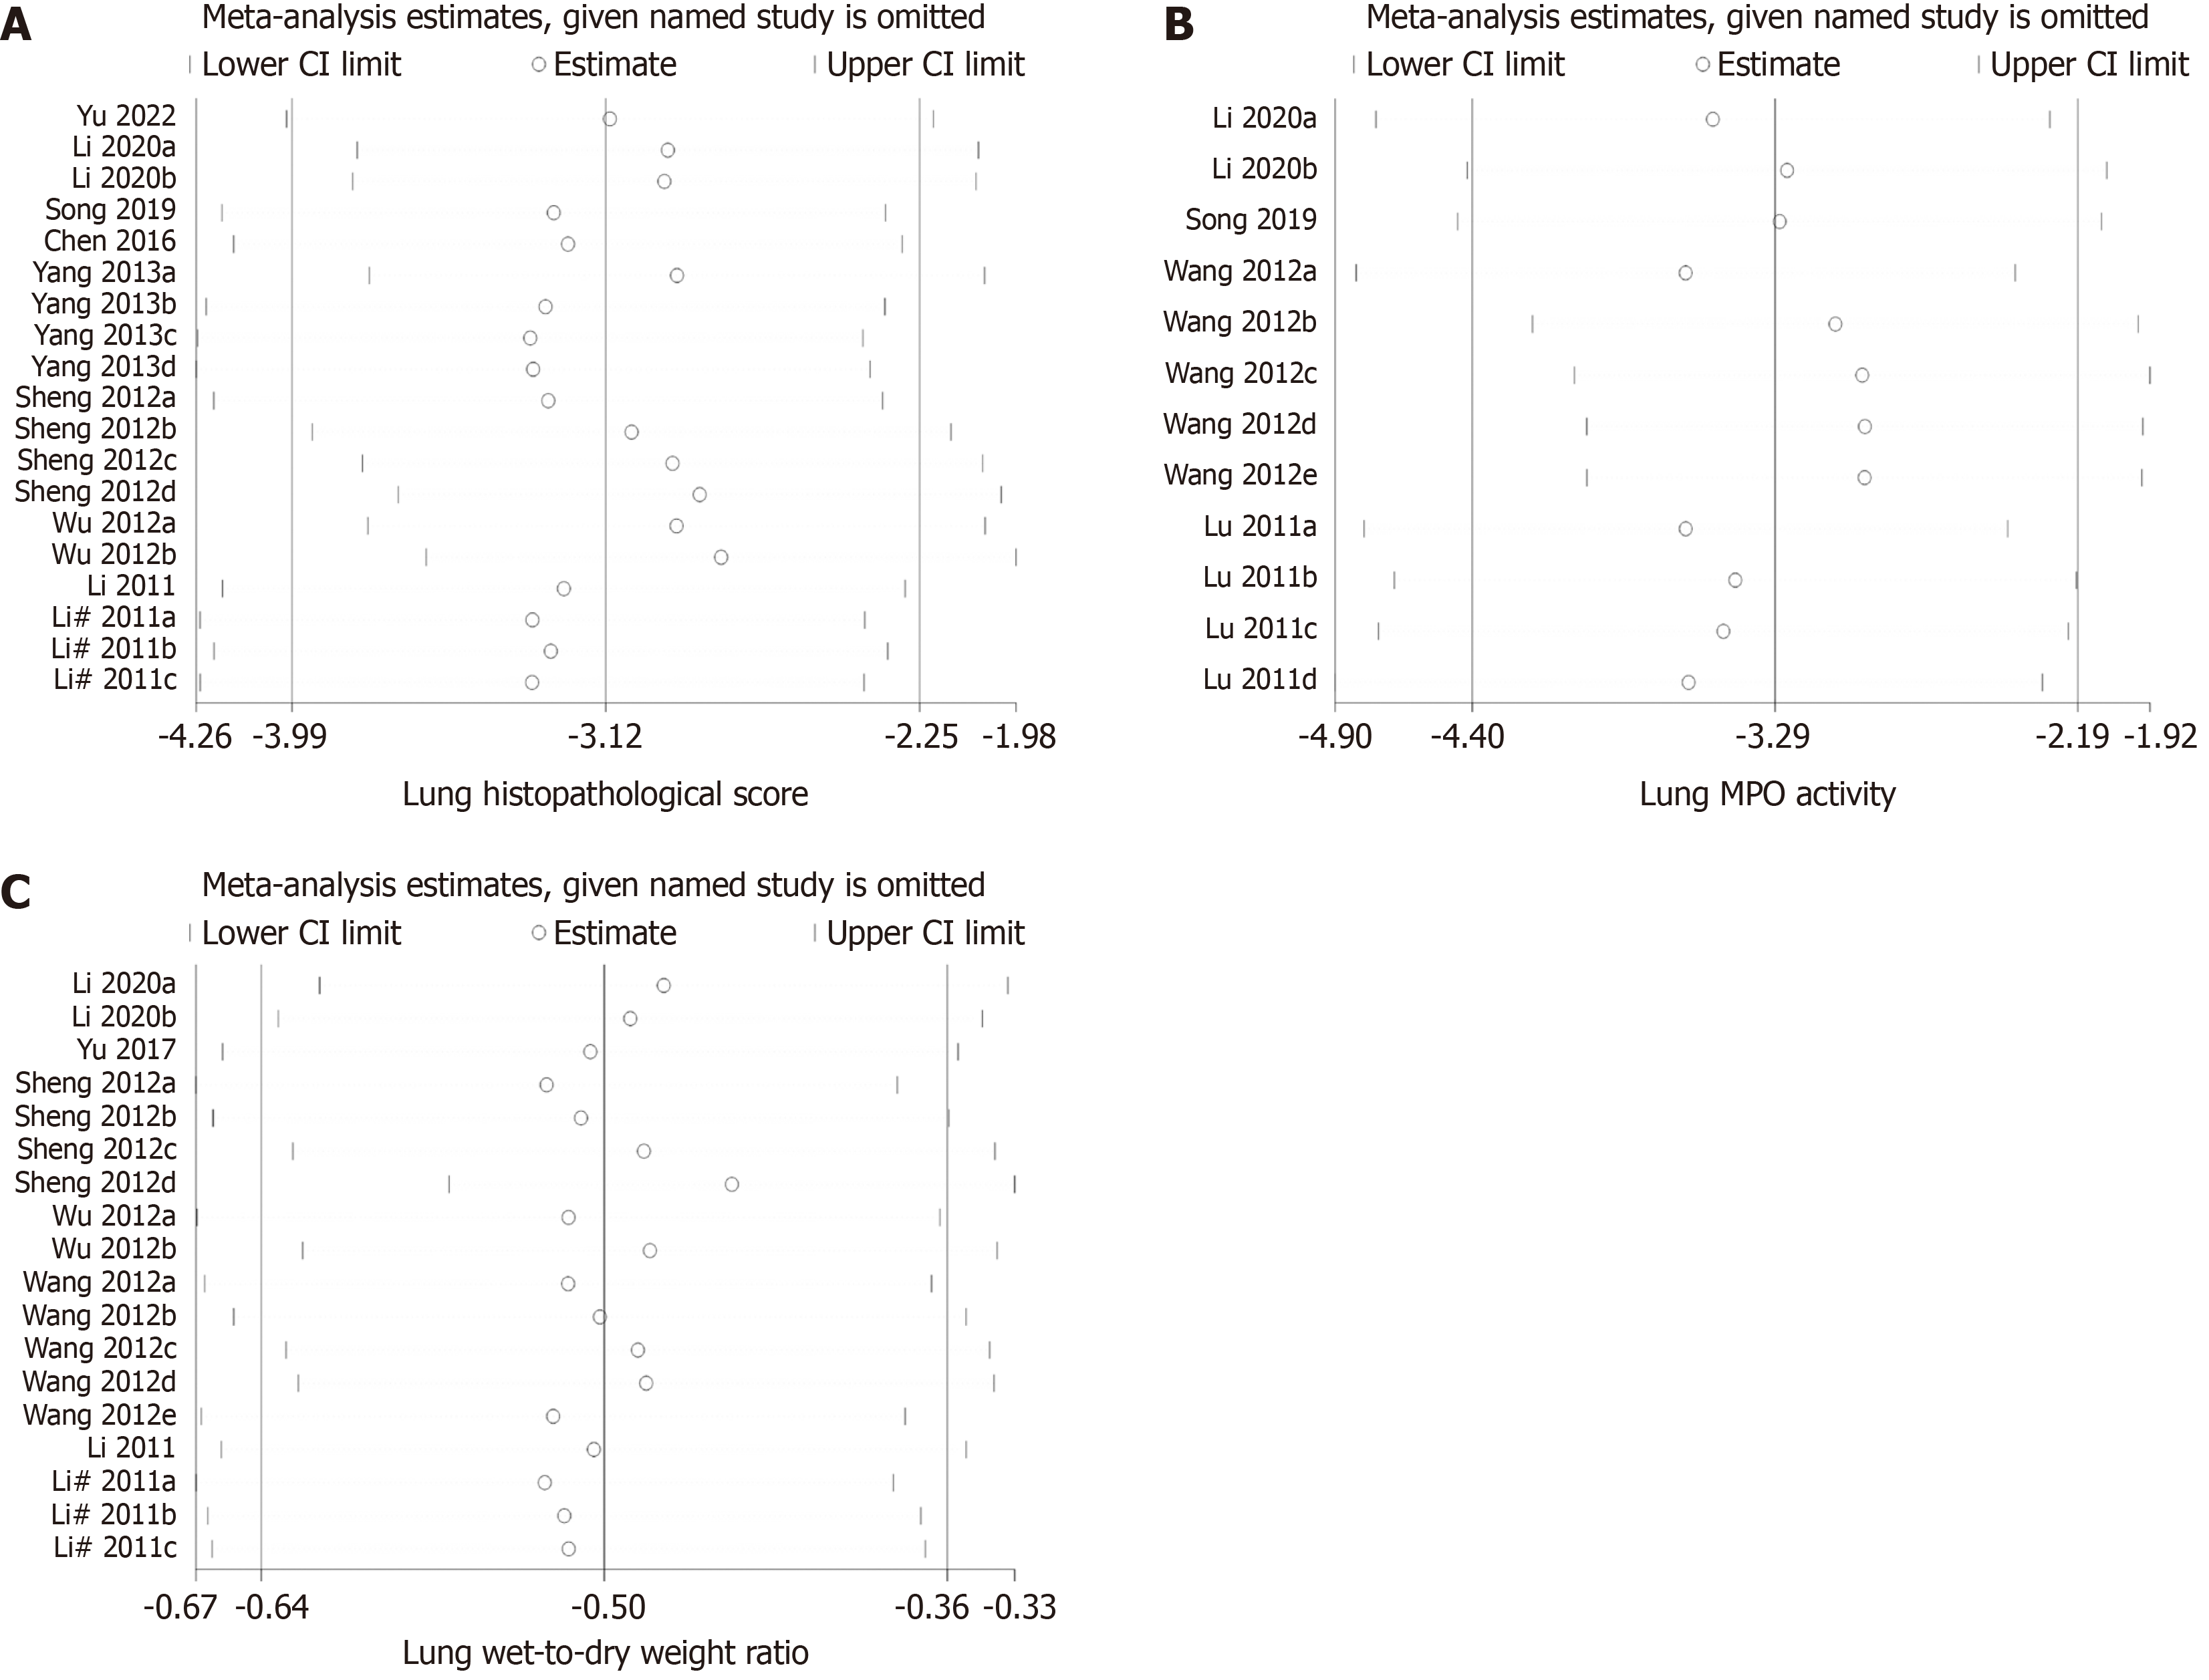
Figure 7 Sensitivity analysis results.
A: Lung histopathological score; B: Lung myeloperoxidase activity; C: Lung wet-to-dry weight ratio. CI: Confidence interval; MPO: Myeloperoxidase.
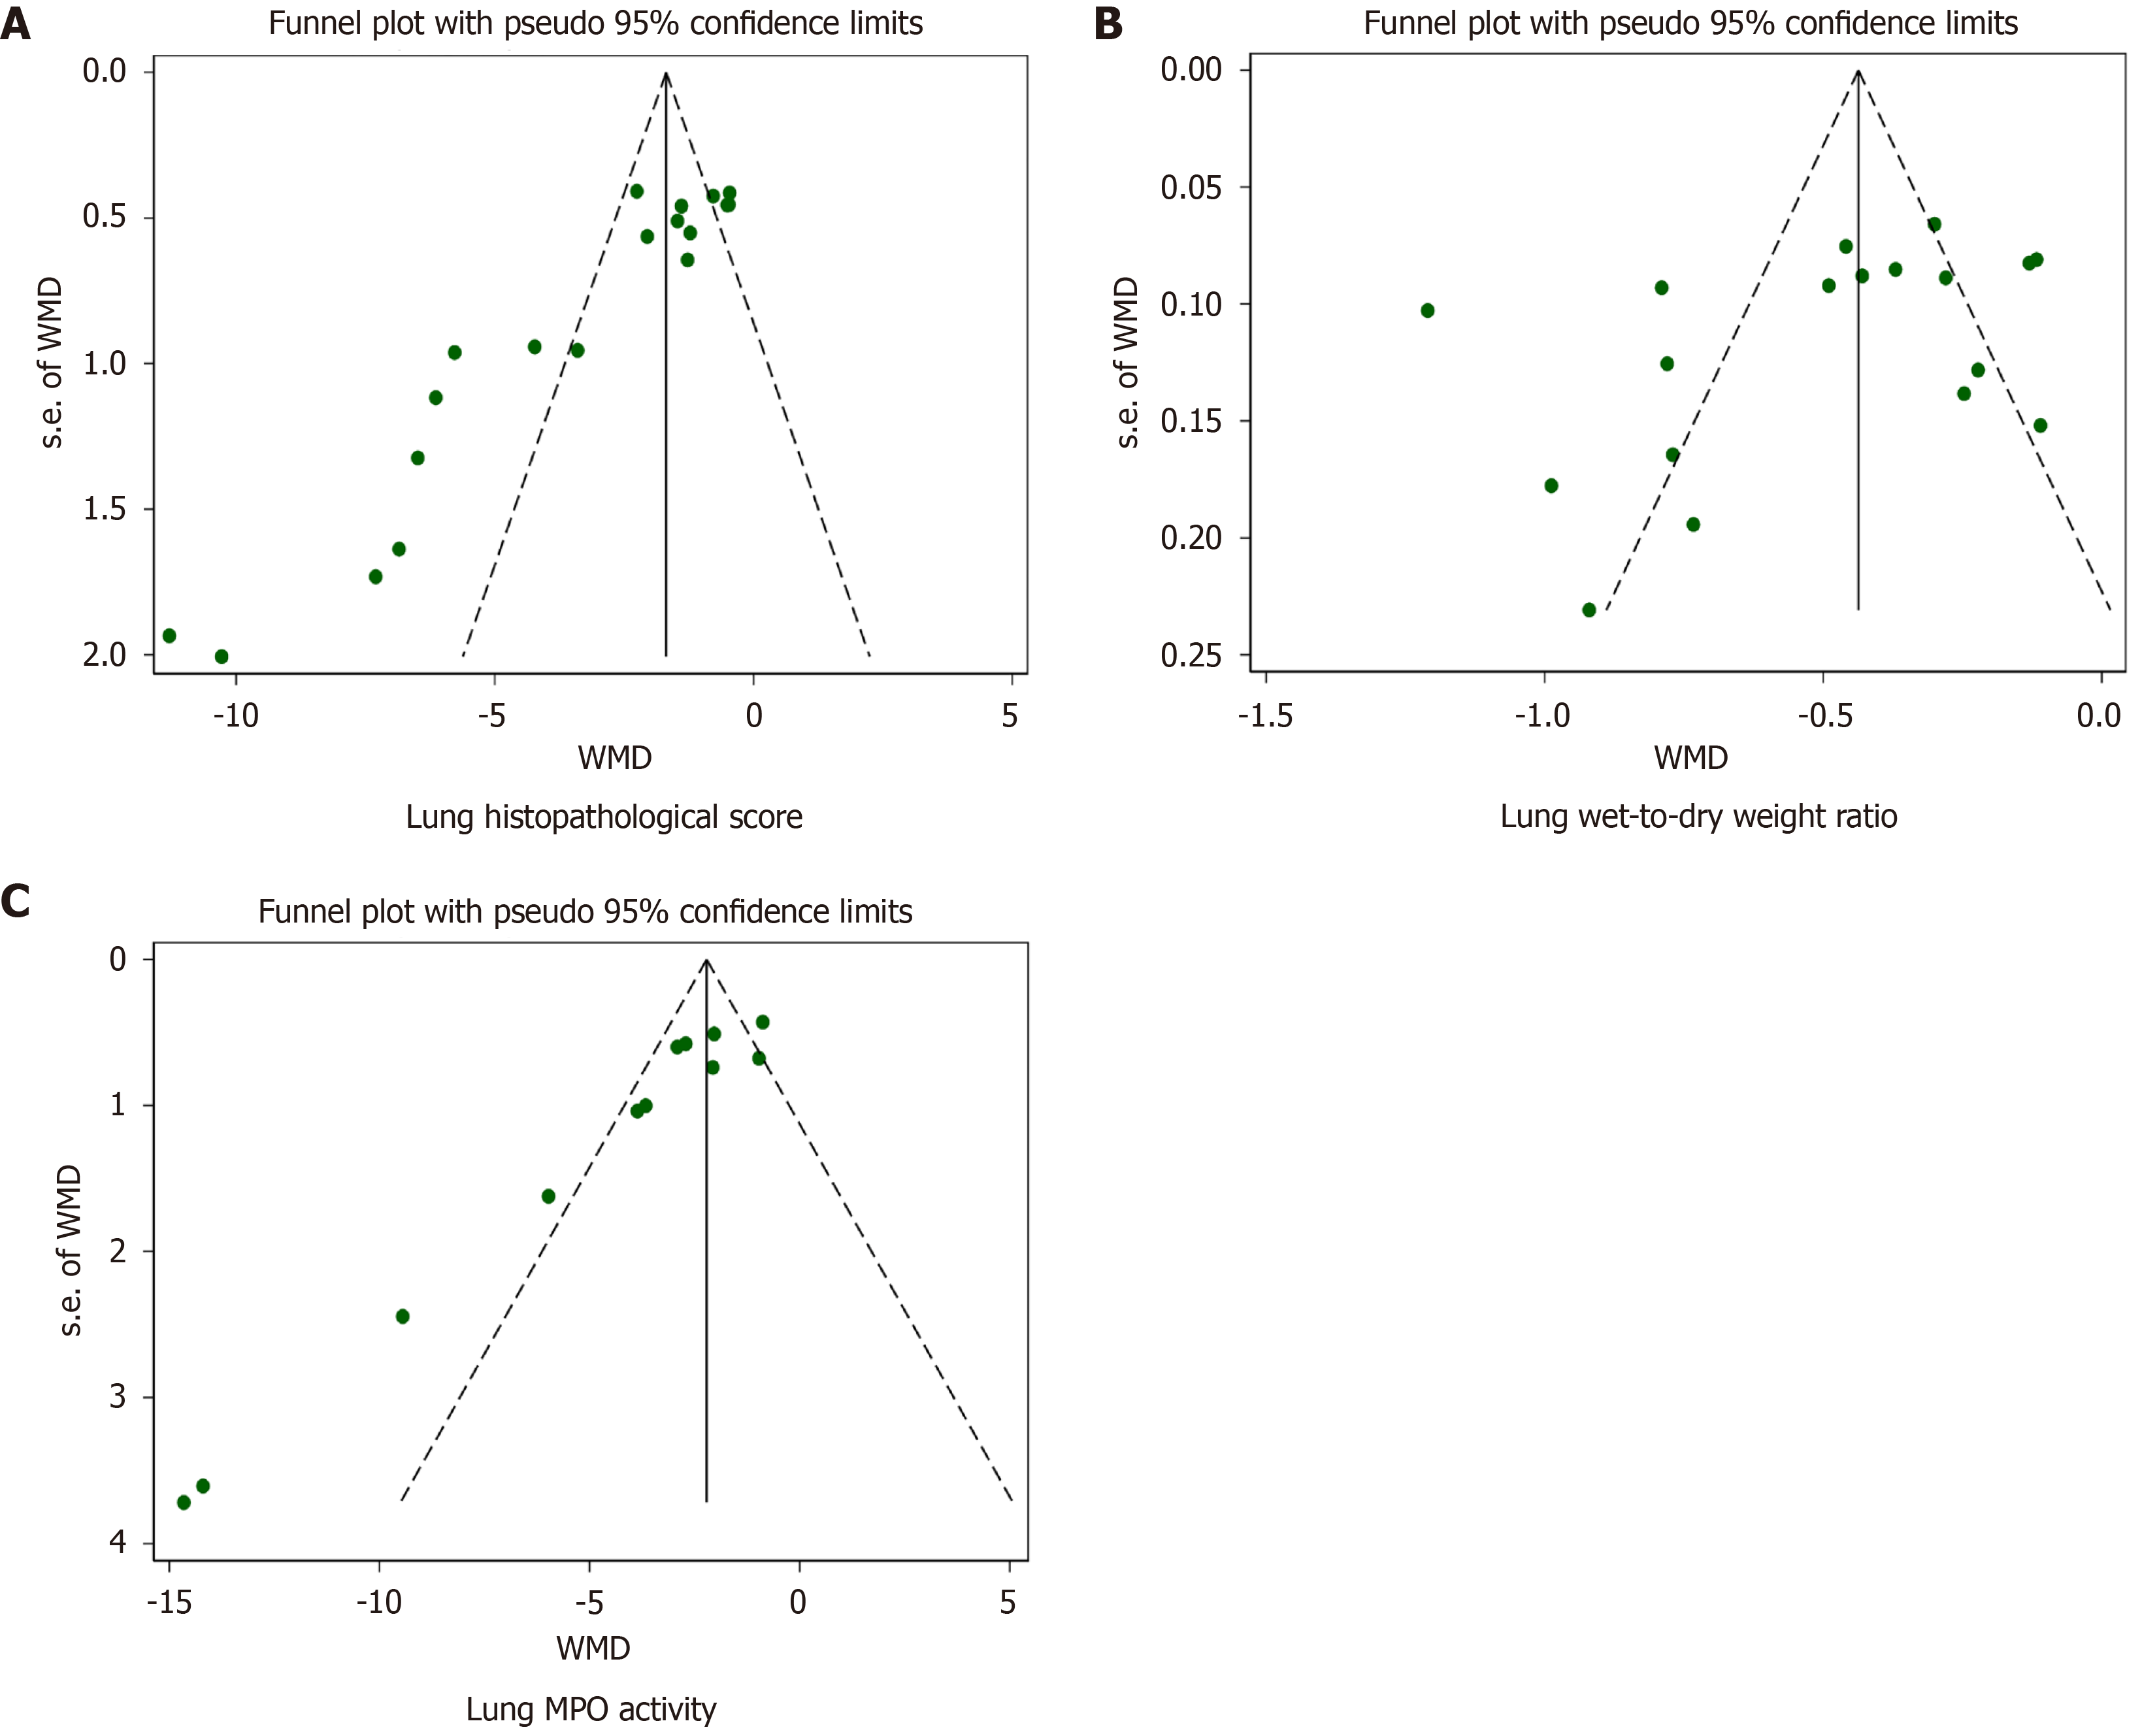
Figure 8 Funnel plots.
A: Lung histopathological score; B: Lung wet-to-dry weight ratio; C: Lung myeloperoxidase activity. WMD: Weighted mean difference; MPO: Myeloperoxidase.
- Citation: Jing GX, Wang ZP, Sun HY, Zhang Y, Gu GQ. Mesenchymal stem cell transplantation for severe acute pancreatitis-associated lung injury: A meta-analysis of animal studies. World J Stem Cells 2026; 18(9): 124515
- URL: https://www.wjgnet.com/1948-0210/full/v18/i9/124515.htm
- DOI: https://dx.doi.org/10.4252/wjsc.124515