
















Copyright: ©Author(s) 2026.
World J Stem Cells. Sep 26, 2026; 18(9): 123933
Published online Sep 26, 2026. doi: 10.4252/wjsc.123933
Published online Sep 26, 2026. doi: 10.4252/wjsc.123933
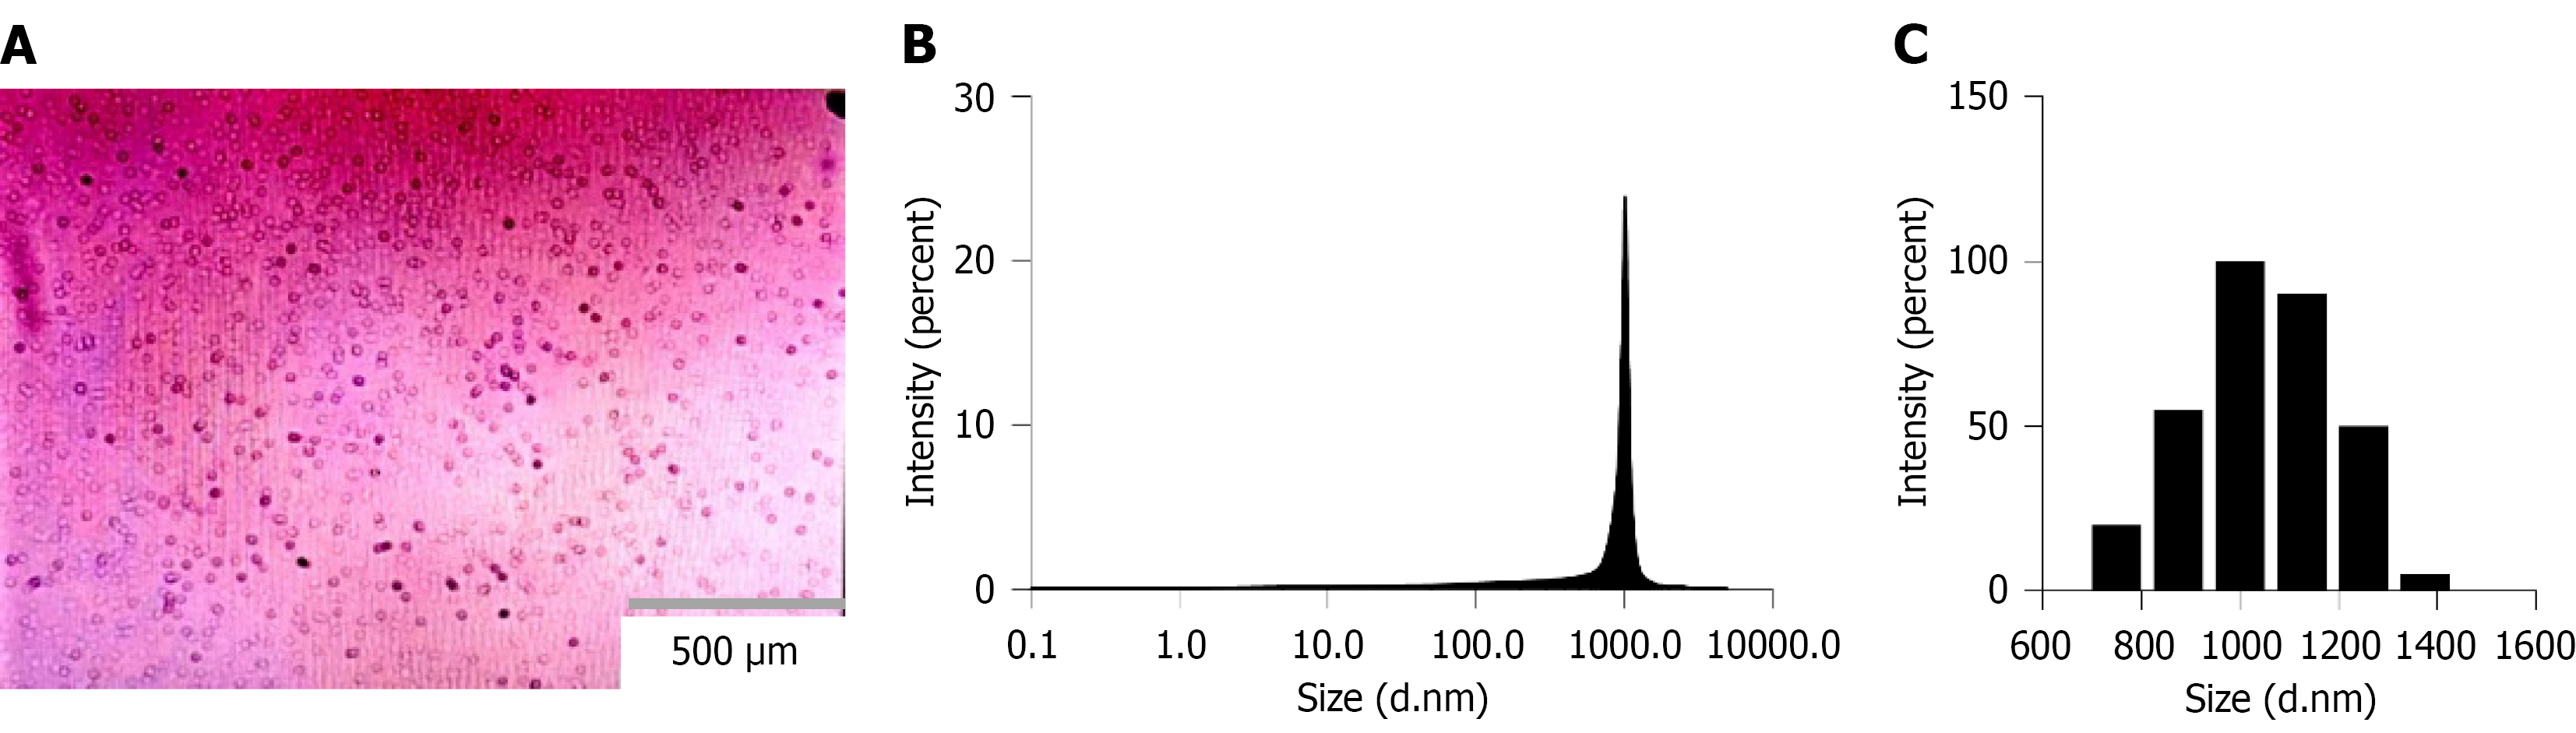
Figure 1 Physicochemical properties of sulfur hexafluoride microbubbles.
A: The distribution of microbubbles (MBs) under the optical microscope (400 ×); B: The particle size-intensity distribution of the MBs: The abscissa represents the MBs size (in nanometers), and the ordinate represents the intensity percentage (%); C: The histogram of the MBs particle size-intensity distribution.
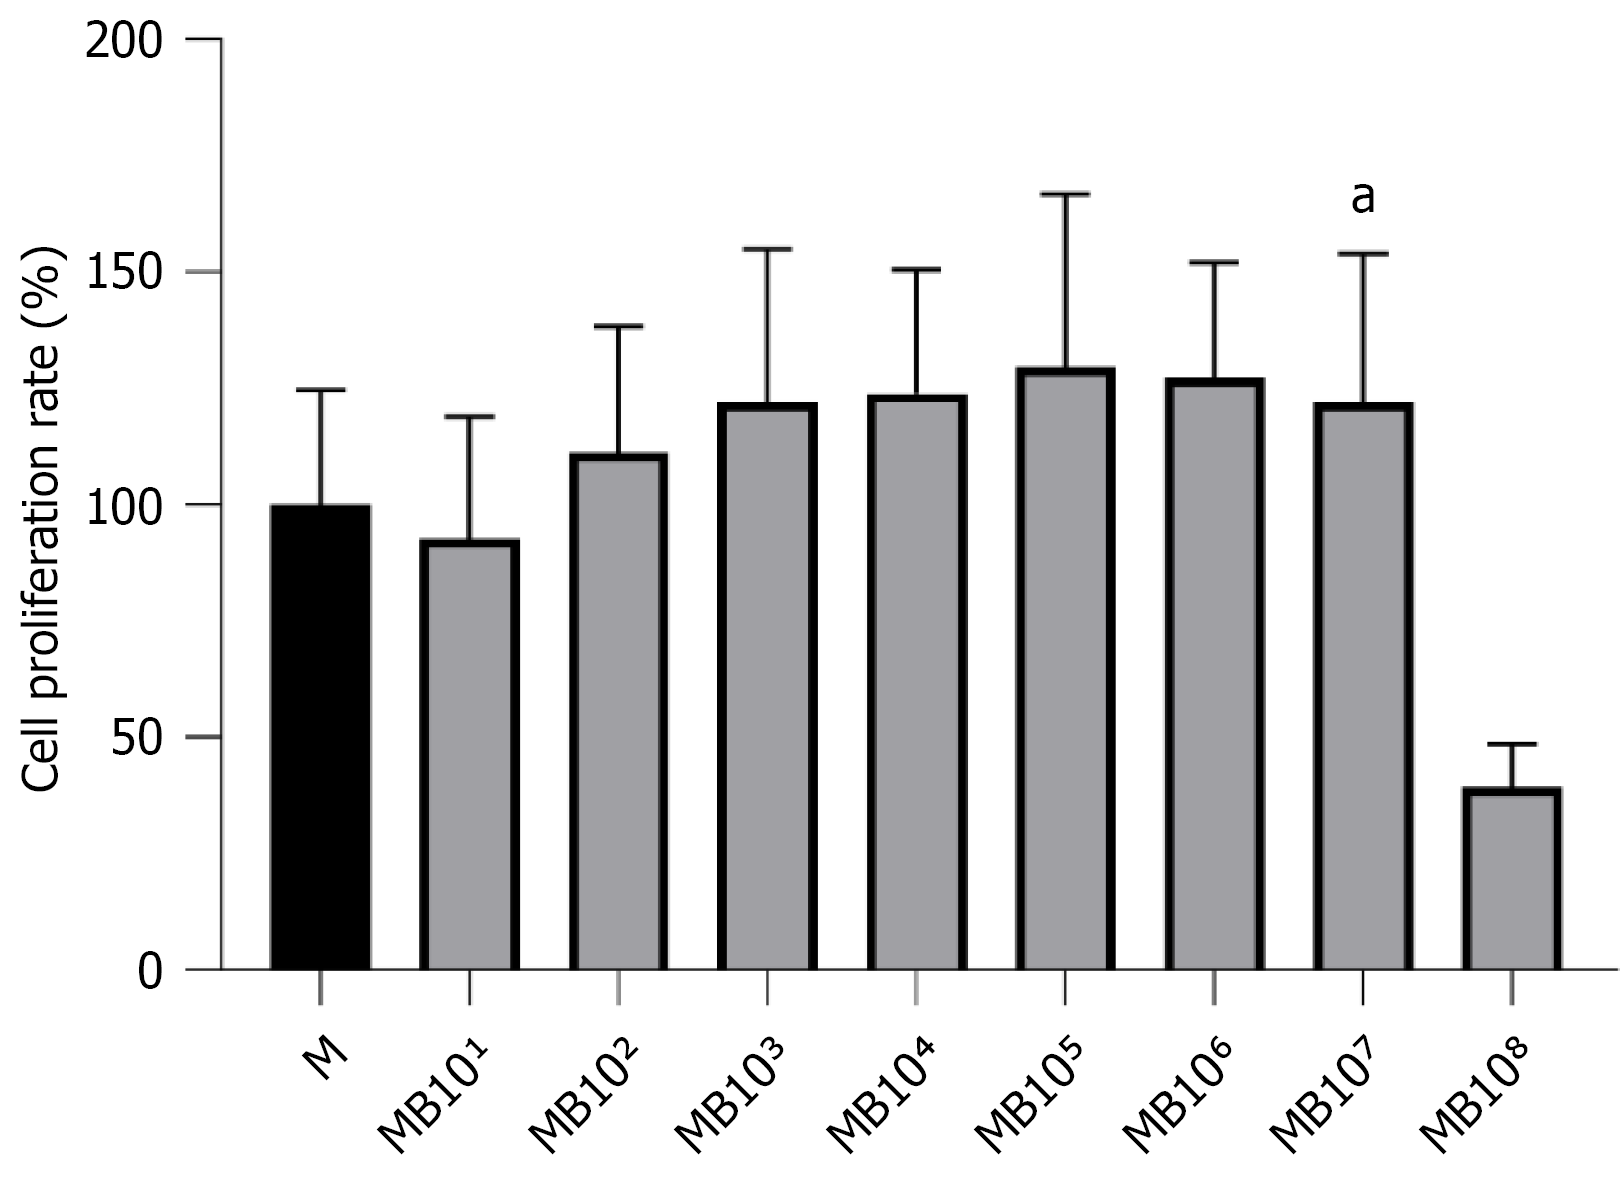
Figure 2 Comparison of proliferation rates of human umbilical cord mesenchymal stem cells treated with different concentrations of microbubbles.
aP < 0.05 vs M group. MB: Microbubble.
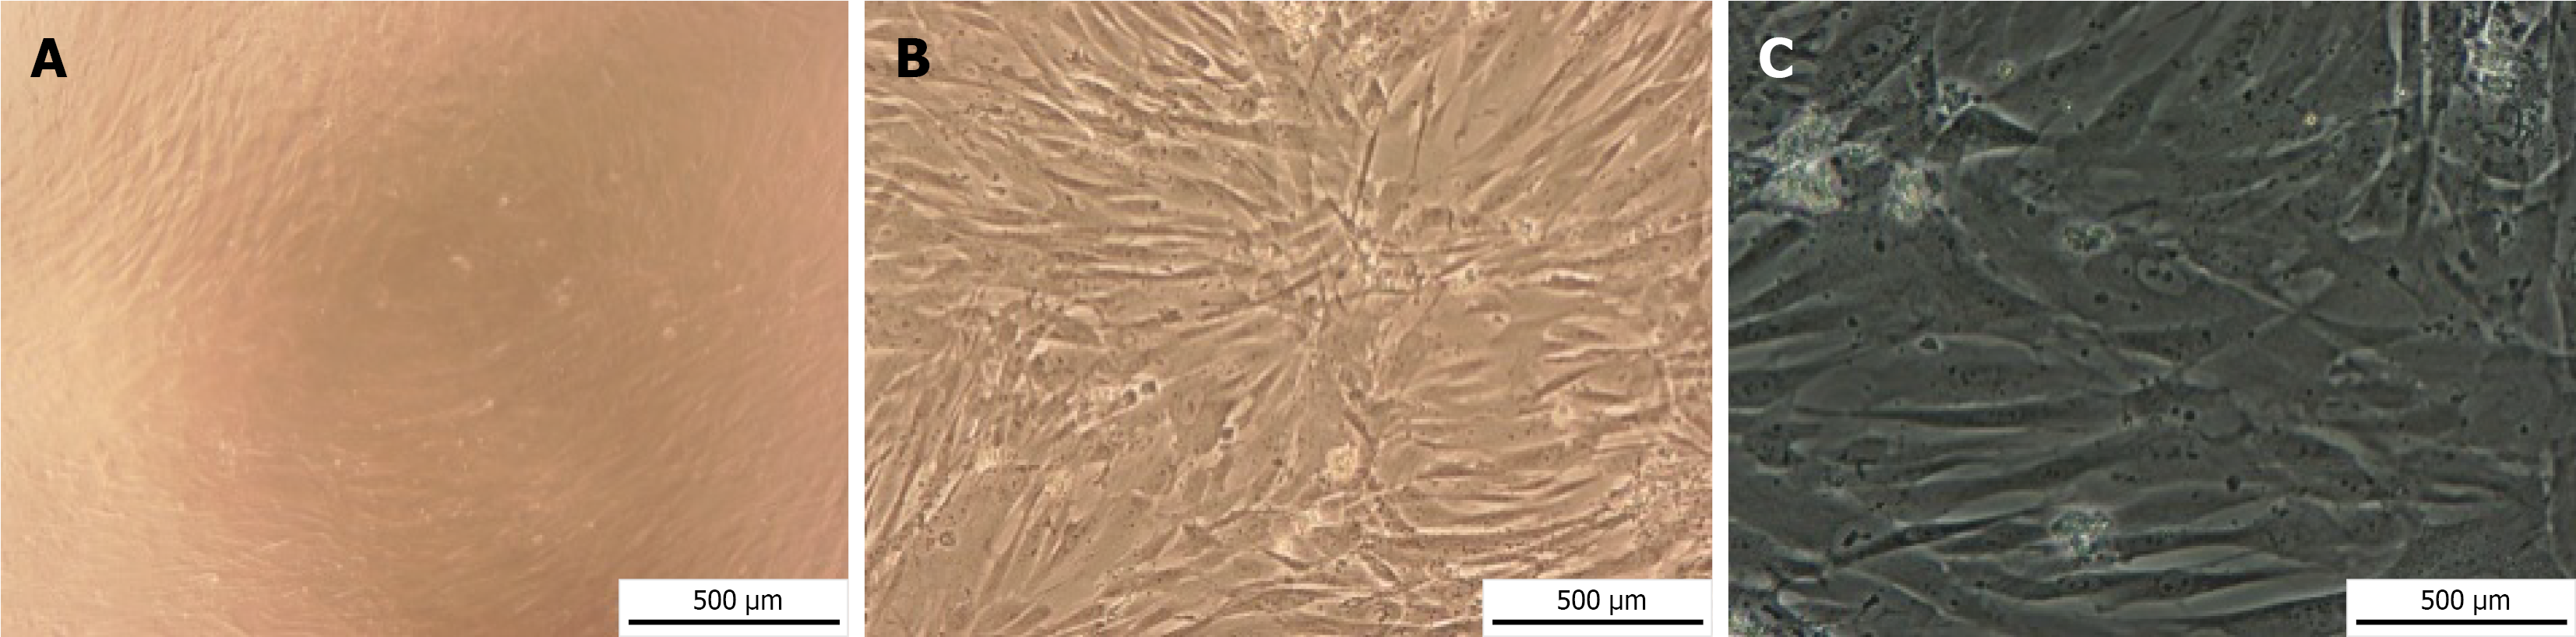
Figure 3 Microscopic morphology of human umbilical cord mesenchymal stem cells.
A: The morphology of human umbilical cord mesenchymal stem cells (hUCMSCs) under a light microscope at 40 × magnification; B: The morphology of hUCMSCs under a light microscope at 200 × magnification; C: The morphology of hUCMSCs under a light microscope at 400 × magnification.
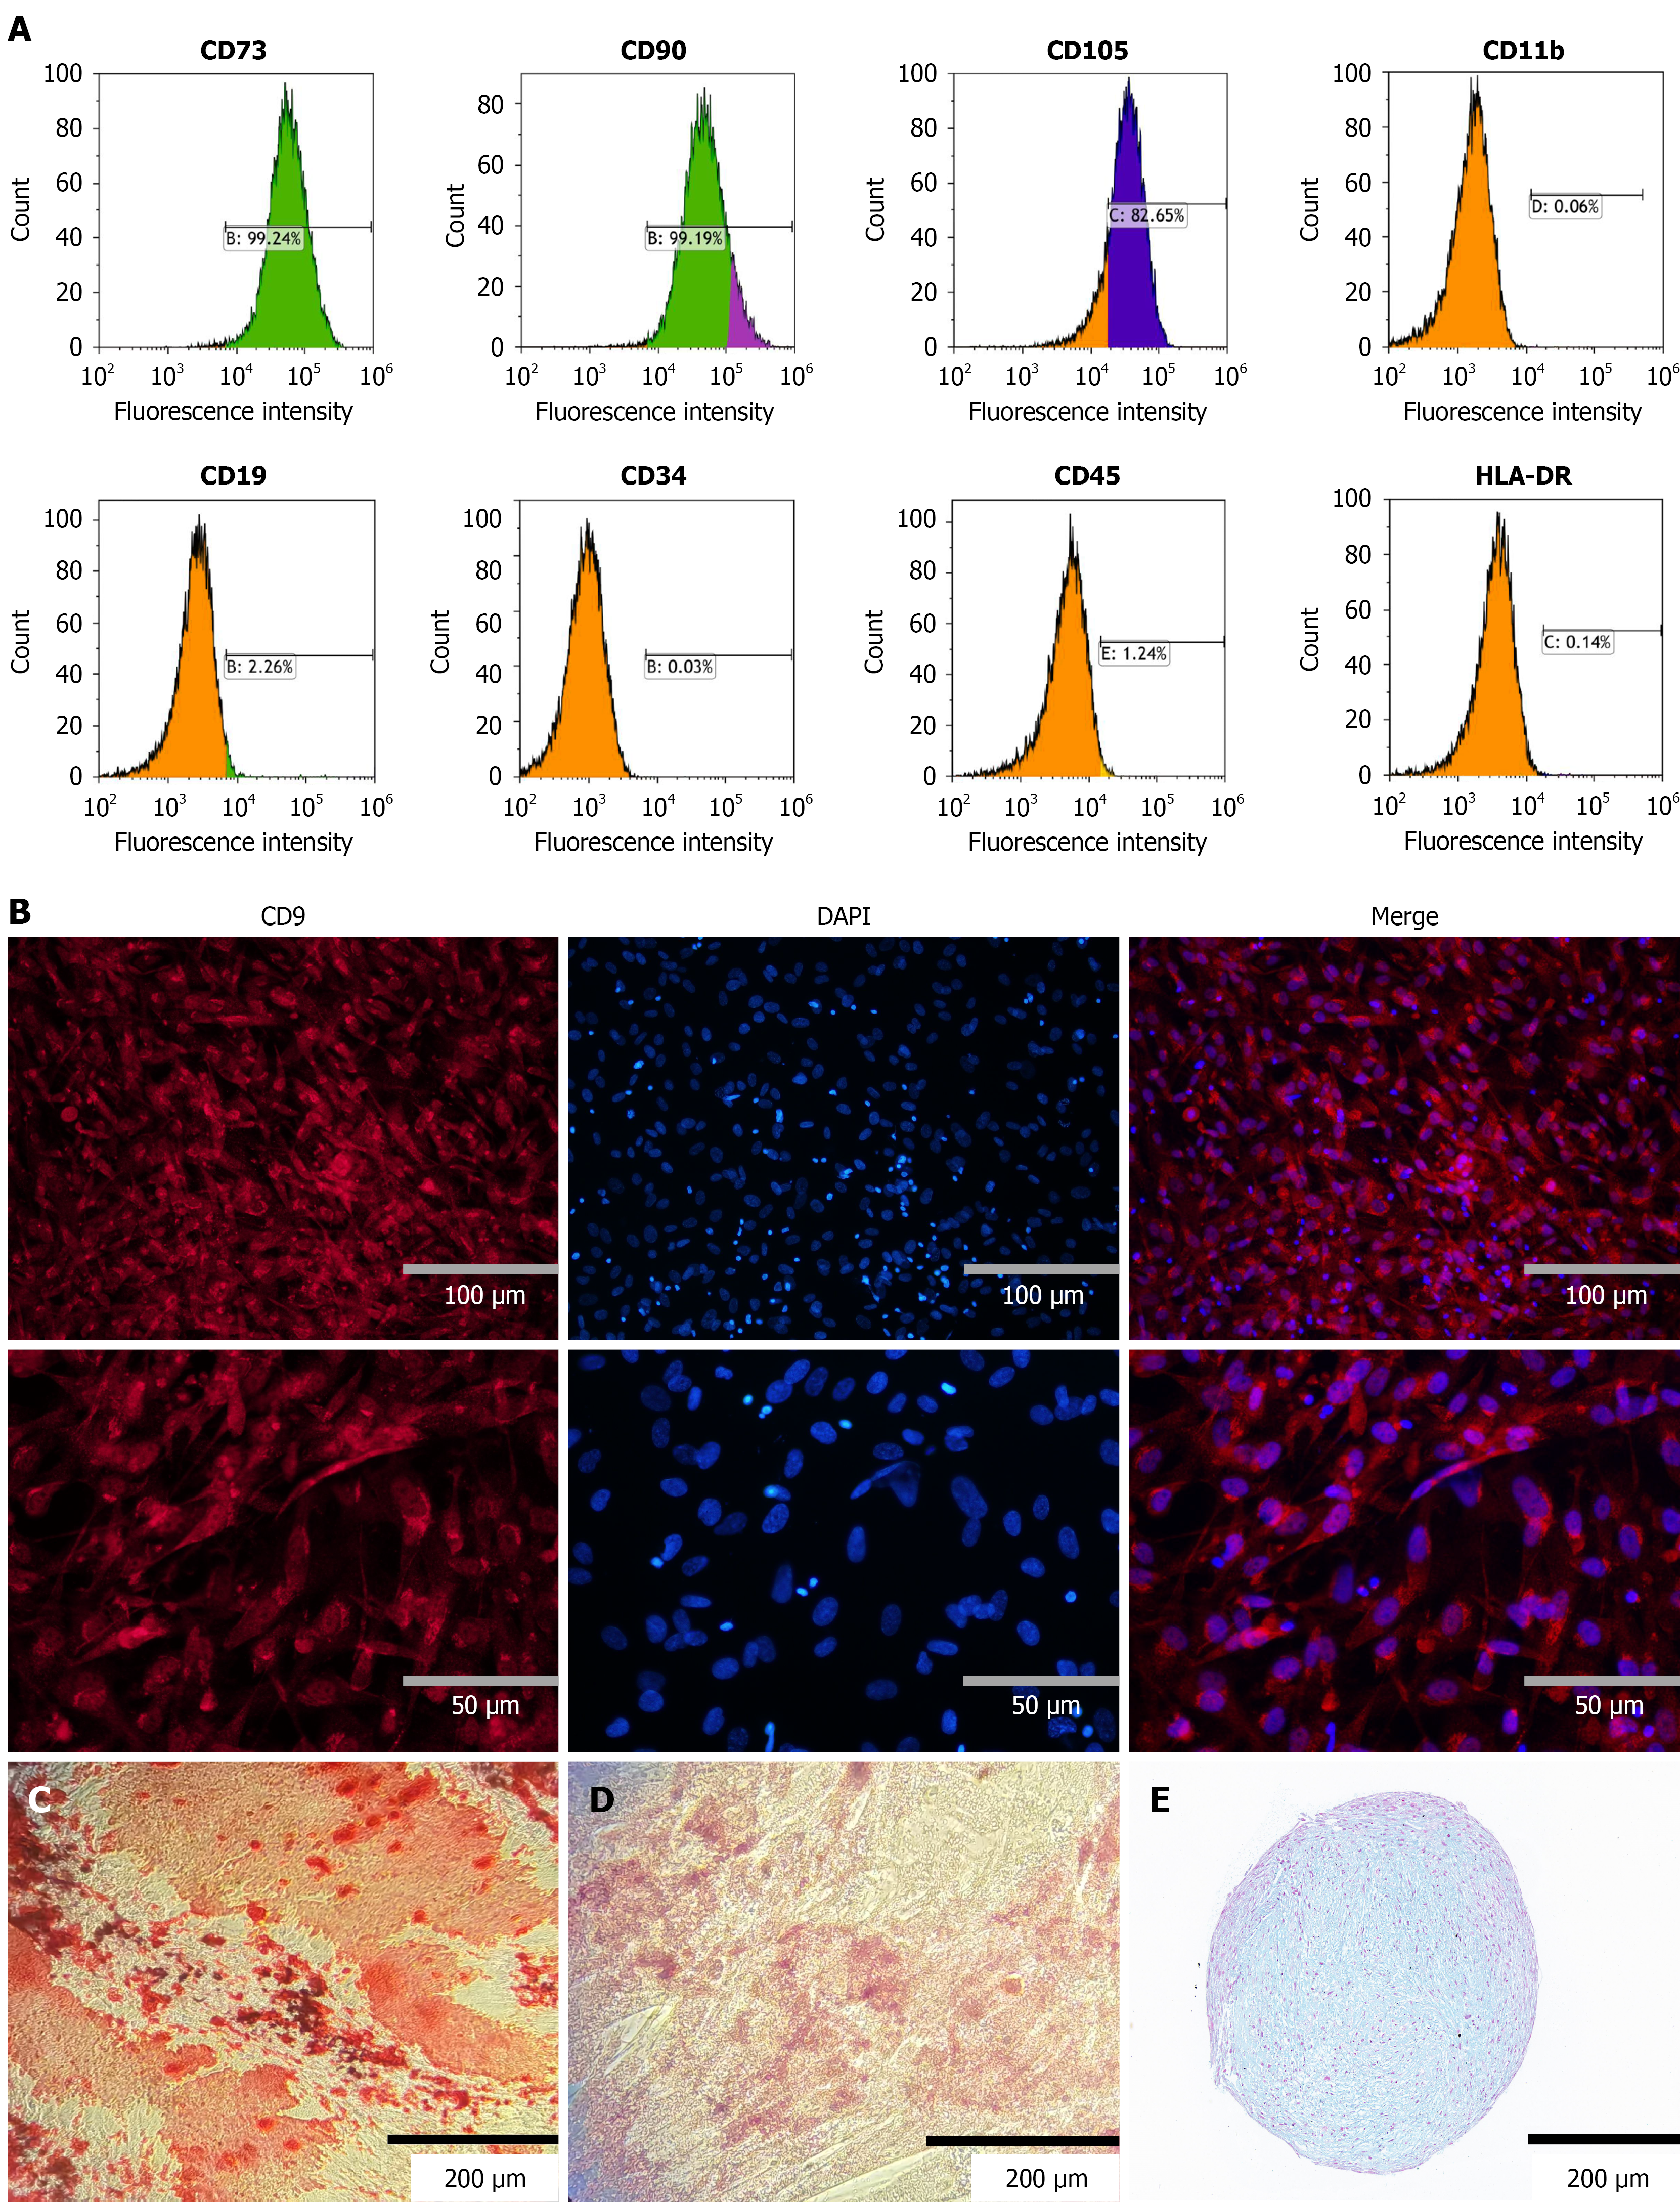
Figure 4 The identification of human umbilical cord mesenchymal stem cells.
A: Cell surface antigens using flow cytometry; B: Identification results of surface antigen CD90 in human umbilical cord mesenchymal stem cells (hUCMSCs) (200 ×, 400 ×); C: Osteogenic differentiation of hUCMSCs (100 ×), with visible red calcium nodules (Alizarin Red staining); D: Adipogenic differentiation of hUCMSCs (100 ×), with visible orange-red lipid droplets in the cytoplasm (Oil Red O staining); E: Chondrogenic differentiation of hUCMSCs (100 ×, alcian blue staining).
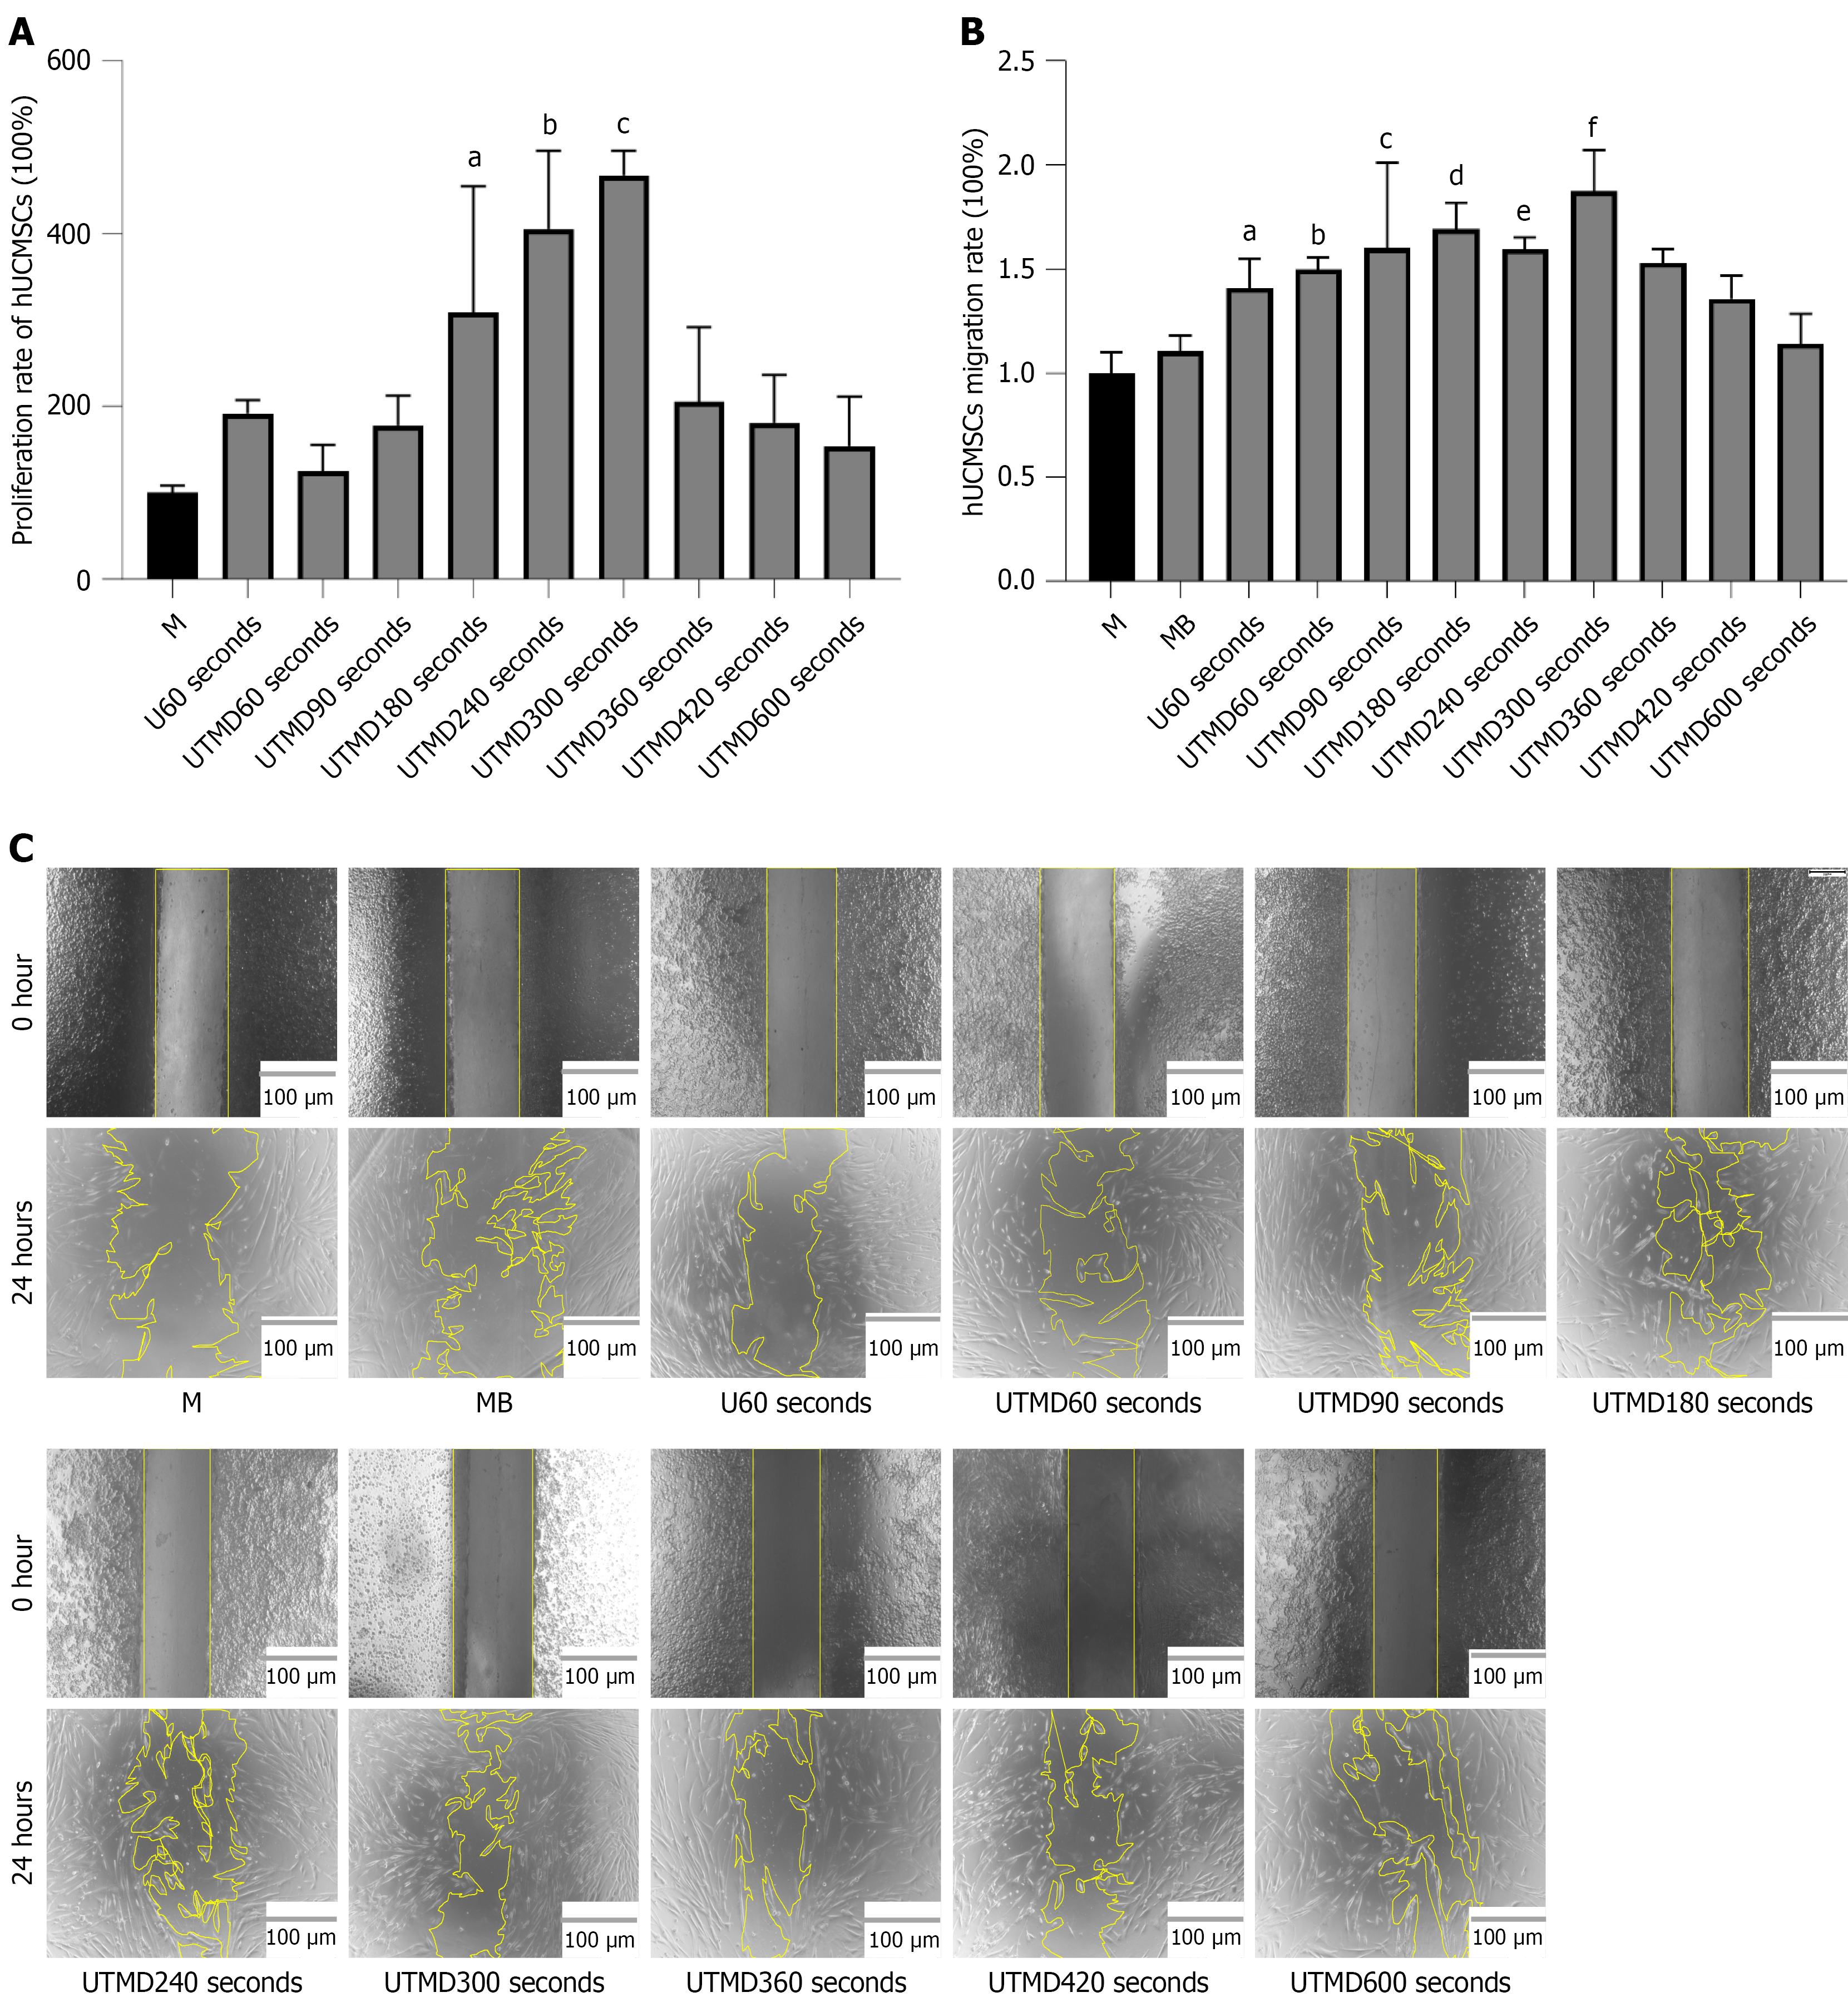
Figure 5 Effects of ultrasound-targeted microbubble destruction exposure duration on the proliferation and migration of human umbilical cord mesenchymal stem cells.
A: Proliferation rates of human umbilical cord mesenchymal stem cells (hUCMSCs) following ultrasound-targeted microbubble destruction (UTMD) treatment for different durations. aP < 0.001 vs the M (control) group; bP < 0.001 vs the M group; cP < 0.001 vs the M group; B and C: Evaluation of cell migration capacity using a wound healing (scratch) assay. Representative microscopic images of the scratch wound in hUCMSC monolayers at 0 hour and 24 hours after treatment with microbubbles alone, ultrasound alone (60 seconds), or UTMD for varying durations (60-600 seconds). aP < 0.05 vs M, bP < 0.05 vs M, cP < 0.05 vs M, dP < 0.01 vs M, eP < 0.05 vs M, fP < 0.05 vs M. Scale bar = 100 μm. Quantitative analysis of the cell migration rate at 24 hours post-treatment. All data are presented as mean ± SD. Statistical significance was determined by one-way ANOVA followed by Tukey’s post hoc test for multiple comparisons.
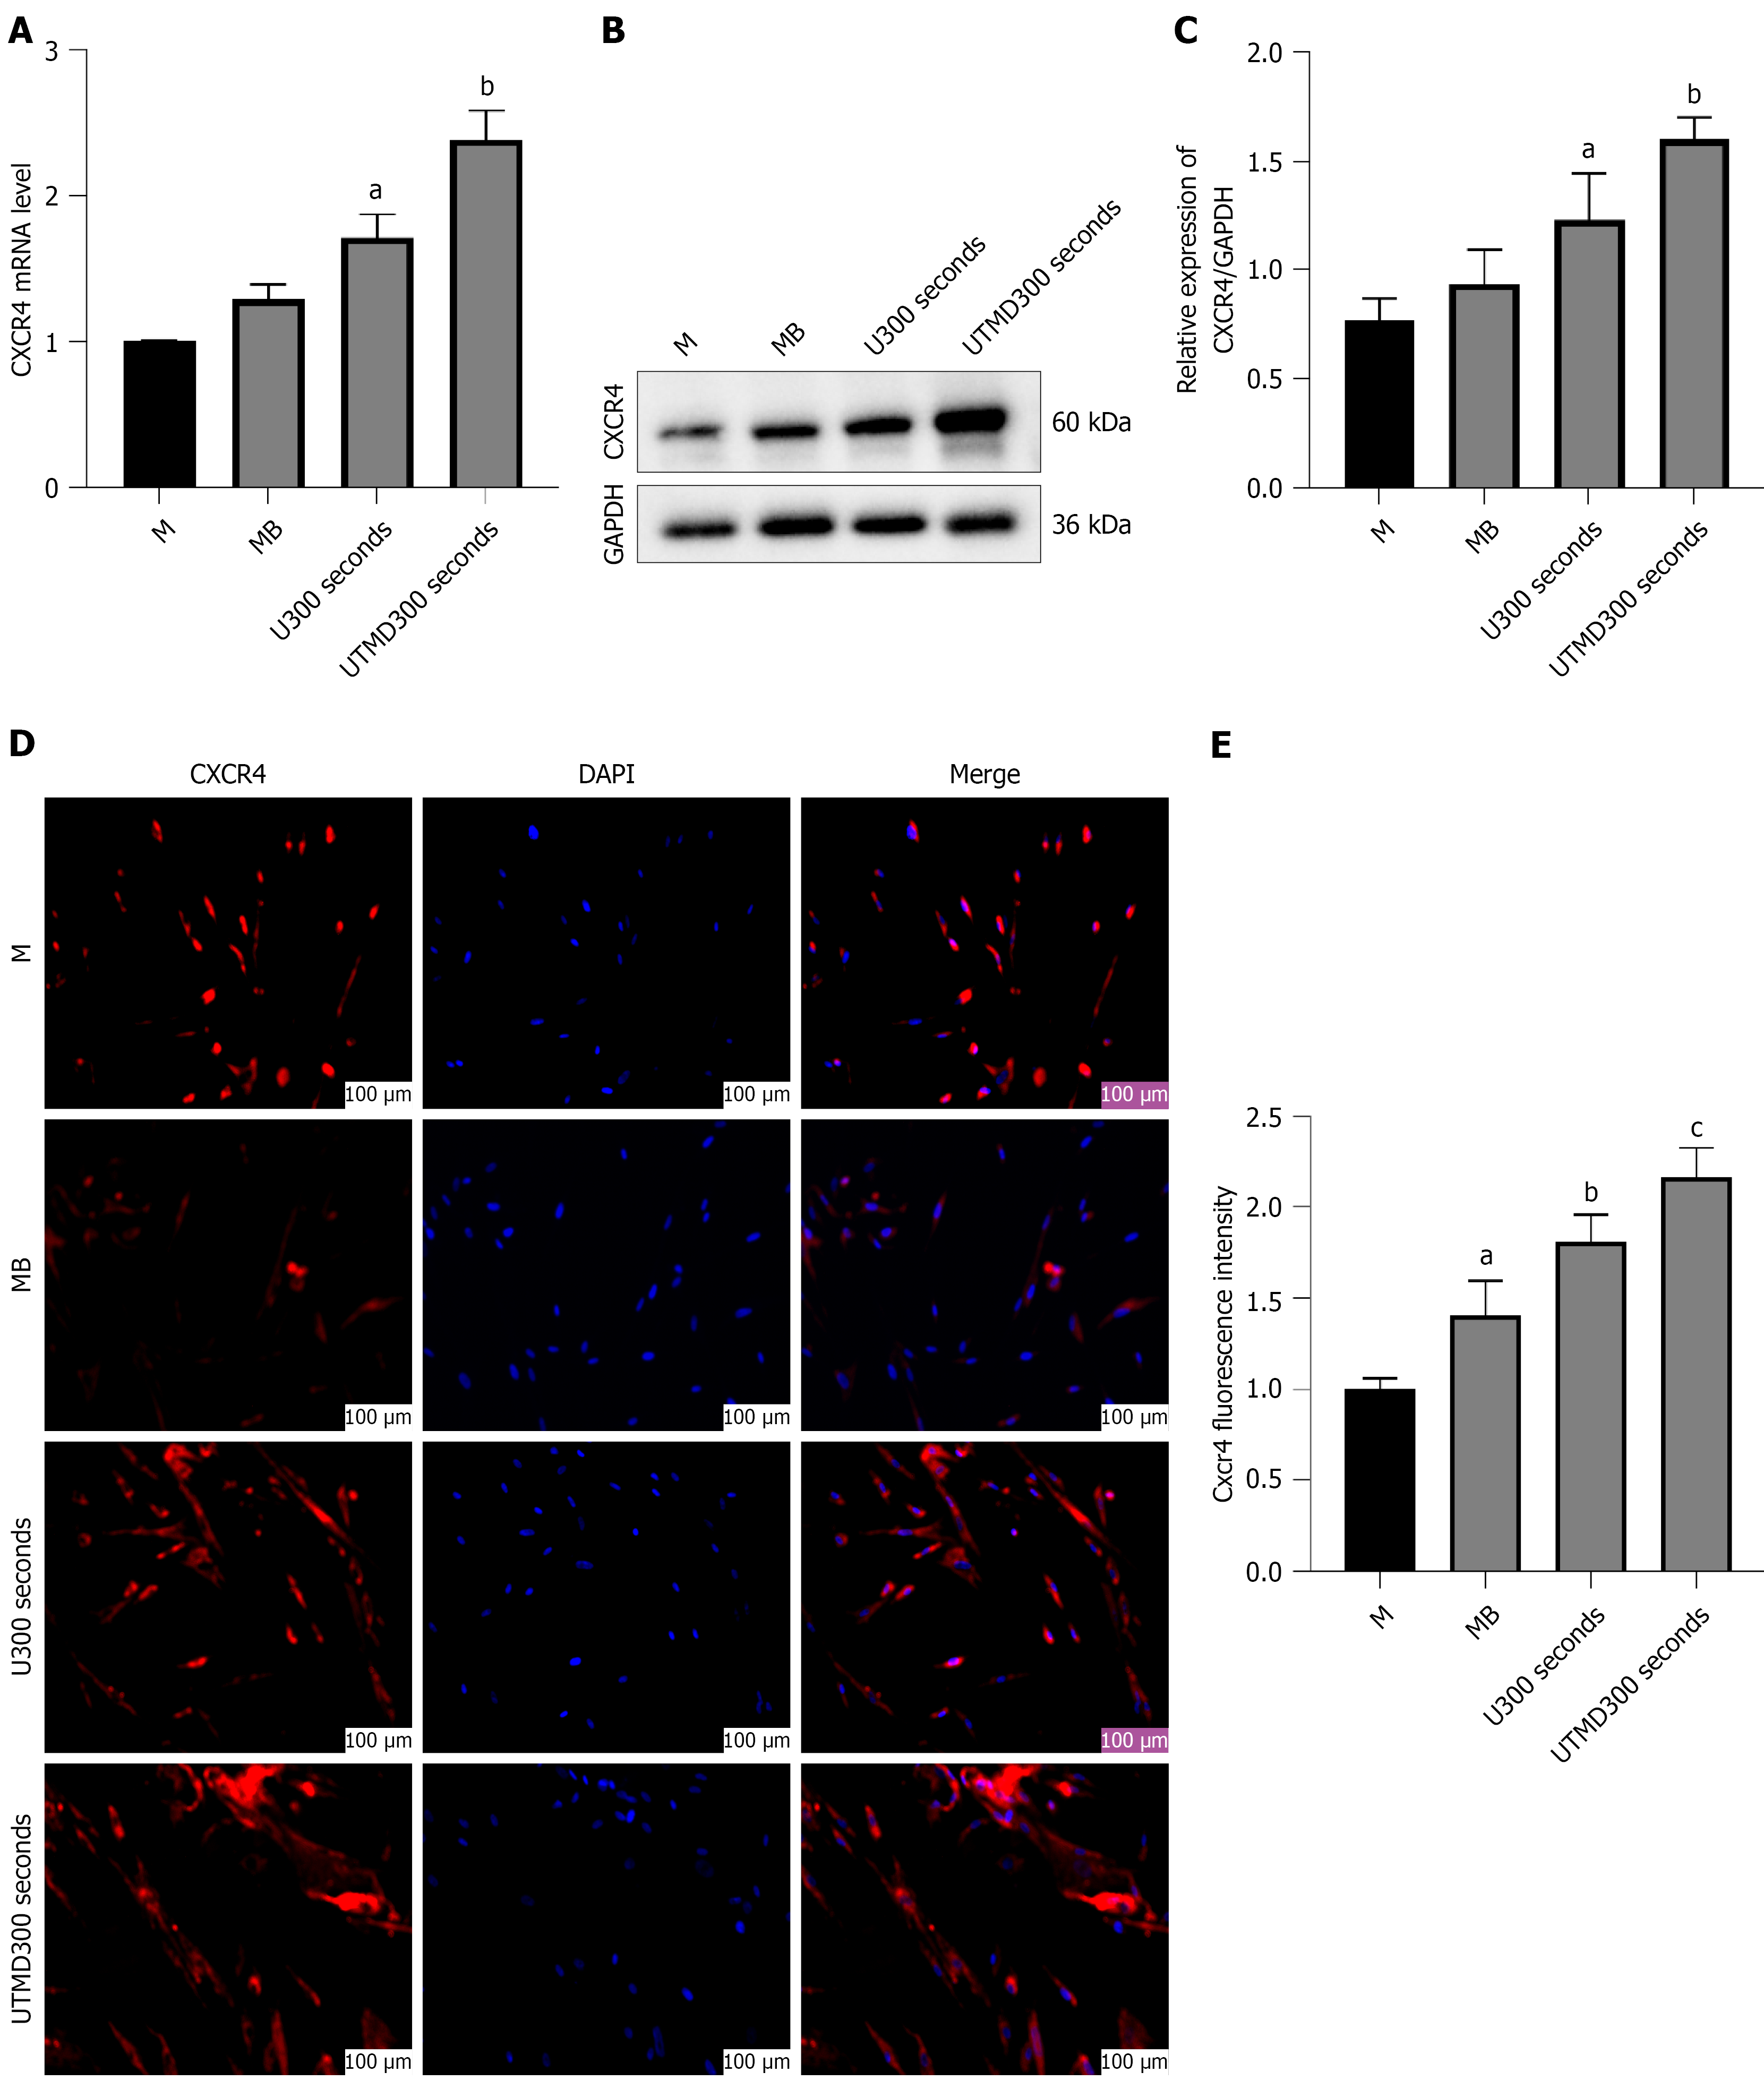
Figure 6 Effects of ultrasound-targeted microbubble destruction exposure duration on C-X-C chemokine receptor type 4 expression in human umbilical cord mesenchymal stem cells.
A: Relative mRNA expression levels of CXCR4 in each group. aP < 0.001 vs M group, bP < 0.001 vs M group; B: C-X-C chemokine receptor type 4 (CXCR4) protein expression in four groups: M (untreated control), MB (microbubbles alone), U300s (ultrasound alone for 300 seconds), and ultrasound-targeted microbubble destruction (UTMD), was analyzed by western blotting, with GAPDH as the loading control; C: Quantification of CXCR4 protein expression normalized to GAPDH, derived from the western blot data in Figure 6B. aP < 0.05 vs M group, bP < 0.01 vs M group; D: Representative immunofluorescence images showing CXCR4 (red) and nuclei (DAPI, blue) in hUCMSCs after UTMD treatment for various durations (original magnification, × 20); E: Quantification of CXCR4 fluorescence intensity from the immunofluorescence images in Figure 6D. aP < 0.05 vs M group, bP < 0.01 vs M group, cP < 0.01 vs MB group. n = 4. All data are presented as mean ± SD. Statistical significance was determined by one-way ANOVA followed by Tukey’s post hoc test for multiple comparisons. CXCR: C-X-C chemokine receptor type 4; MB: Microbubble; UTMD: Ultrasound-targeted microbubble destruction.
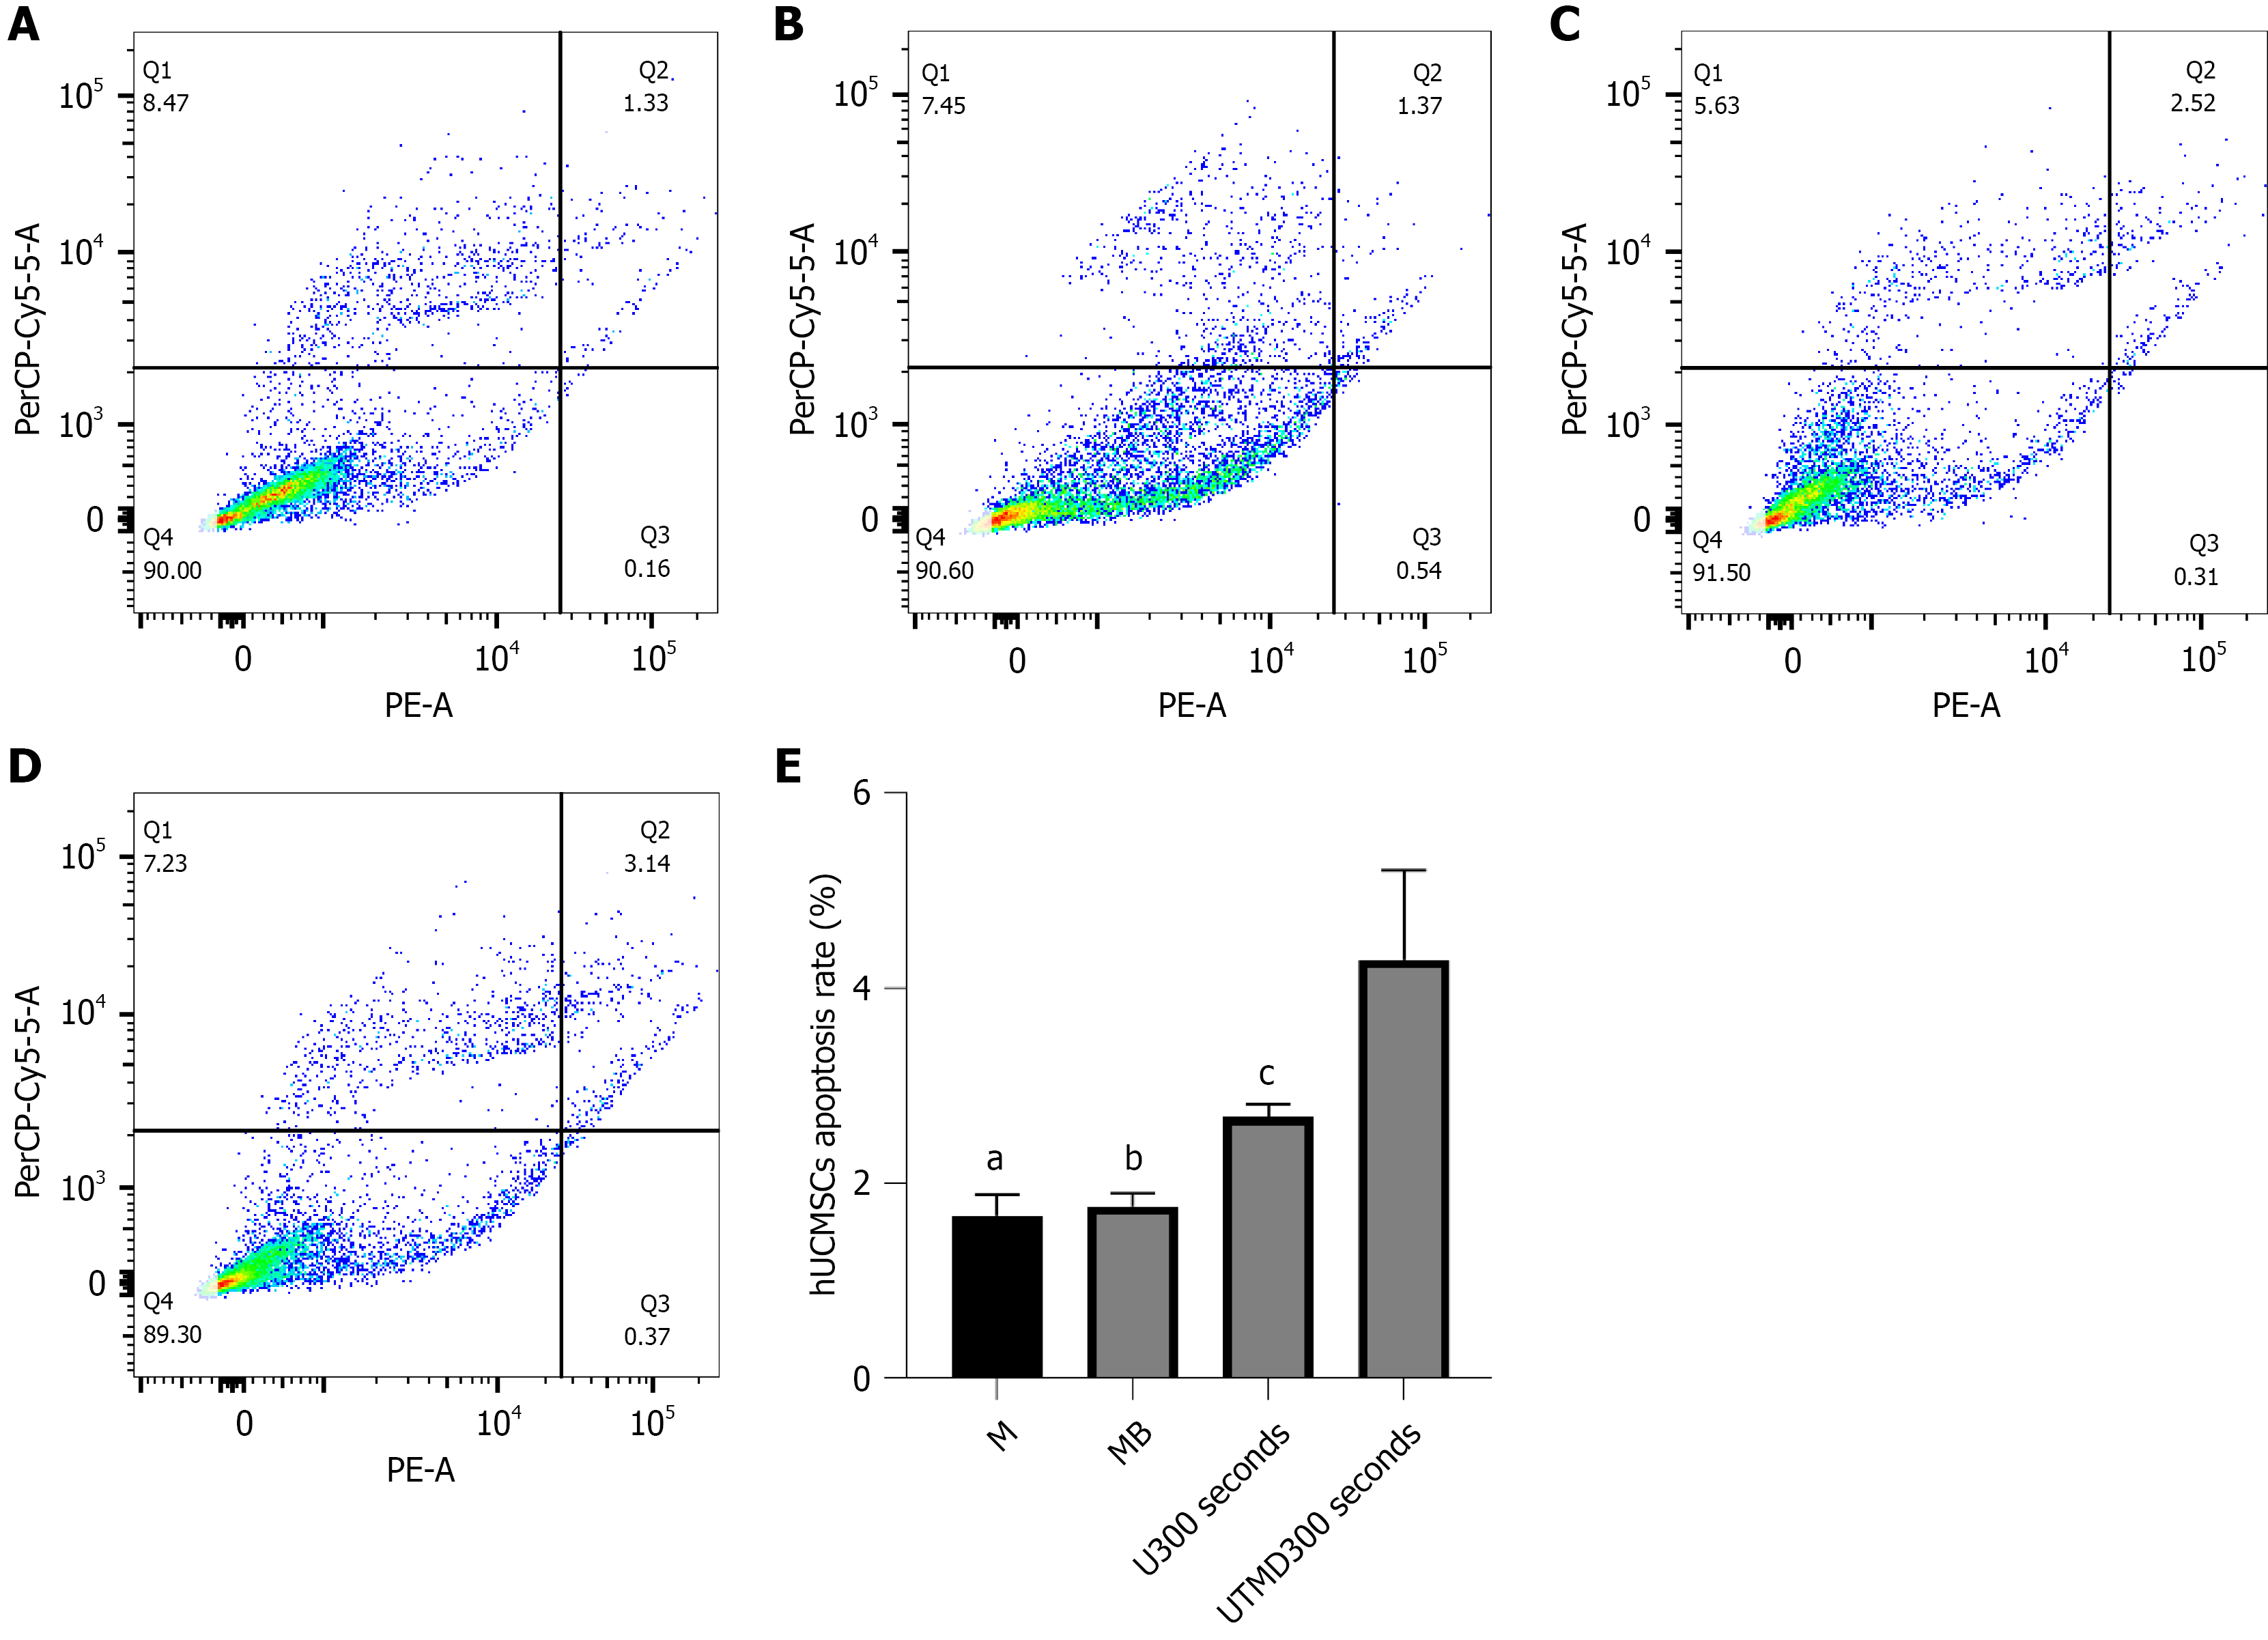
Figure 7 Apoptosis of human umbilical cord mesenchymal stem cells following different treatments, assessed by flow cytometry.
A-D: Representative flow cytometric scatter plots of apoptotic cells in the M (untreated control), MB (microbubbles alone), U300s (ultrasound alone for 300 seconds), and UTMD300s (ultrasound-targeted microbubble destruction for 300 seconds) groups, respectively; E: Quantitative analysis of the total apoptosis rate (early plus late apoptosis) in each group. Statistical significance: aP < 0.01 vs the UTMD300s group; bP < 0.01 vs the UTMD300s group; cP < 0.05 vs the M group. n = 4. All data are presented as mean ± SD. Statistical comparisons were performed using one-way ANOVA followed by Tukey’s post hoc test. UTMD: Ultrasound-targeted microbubble destruction.
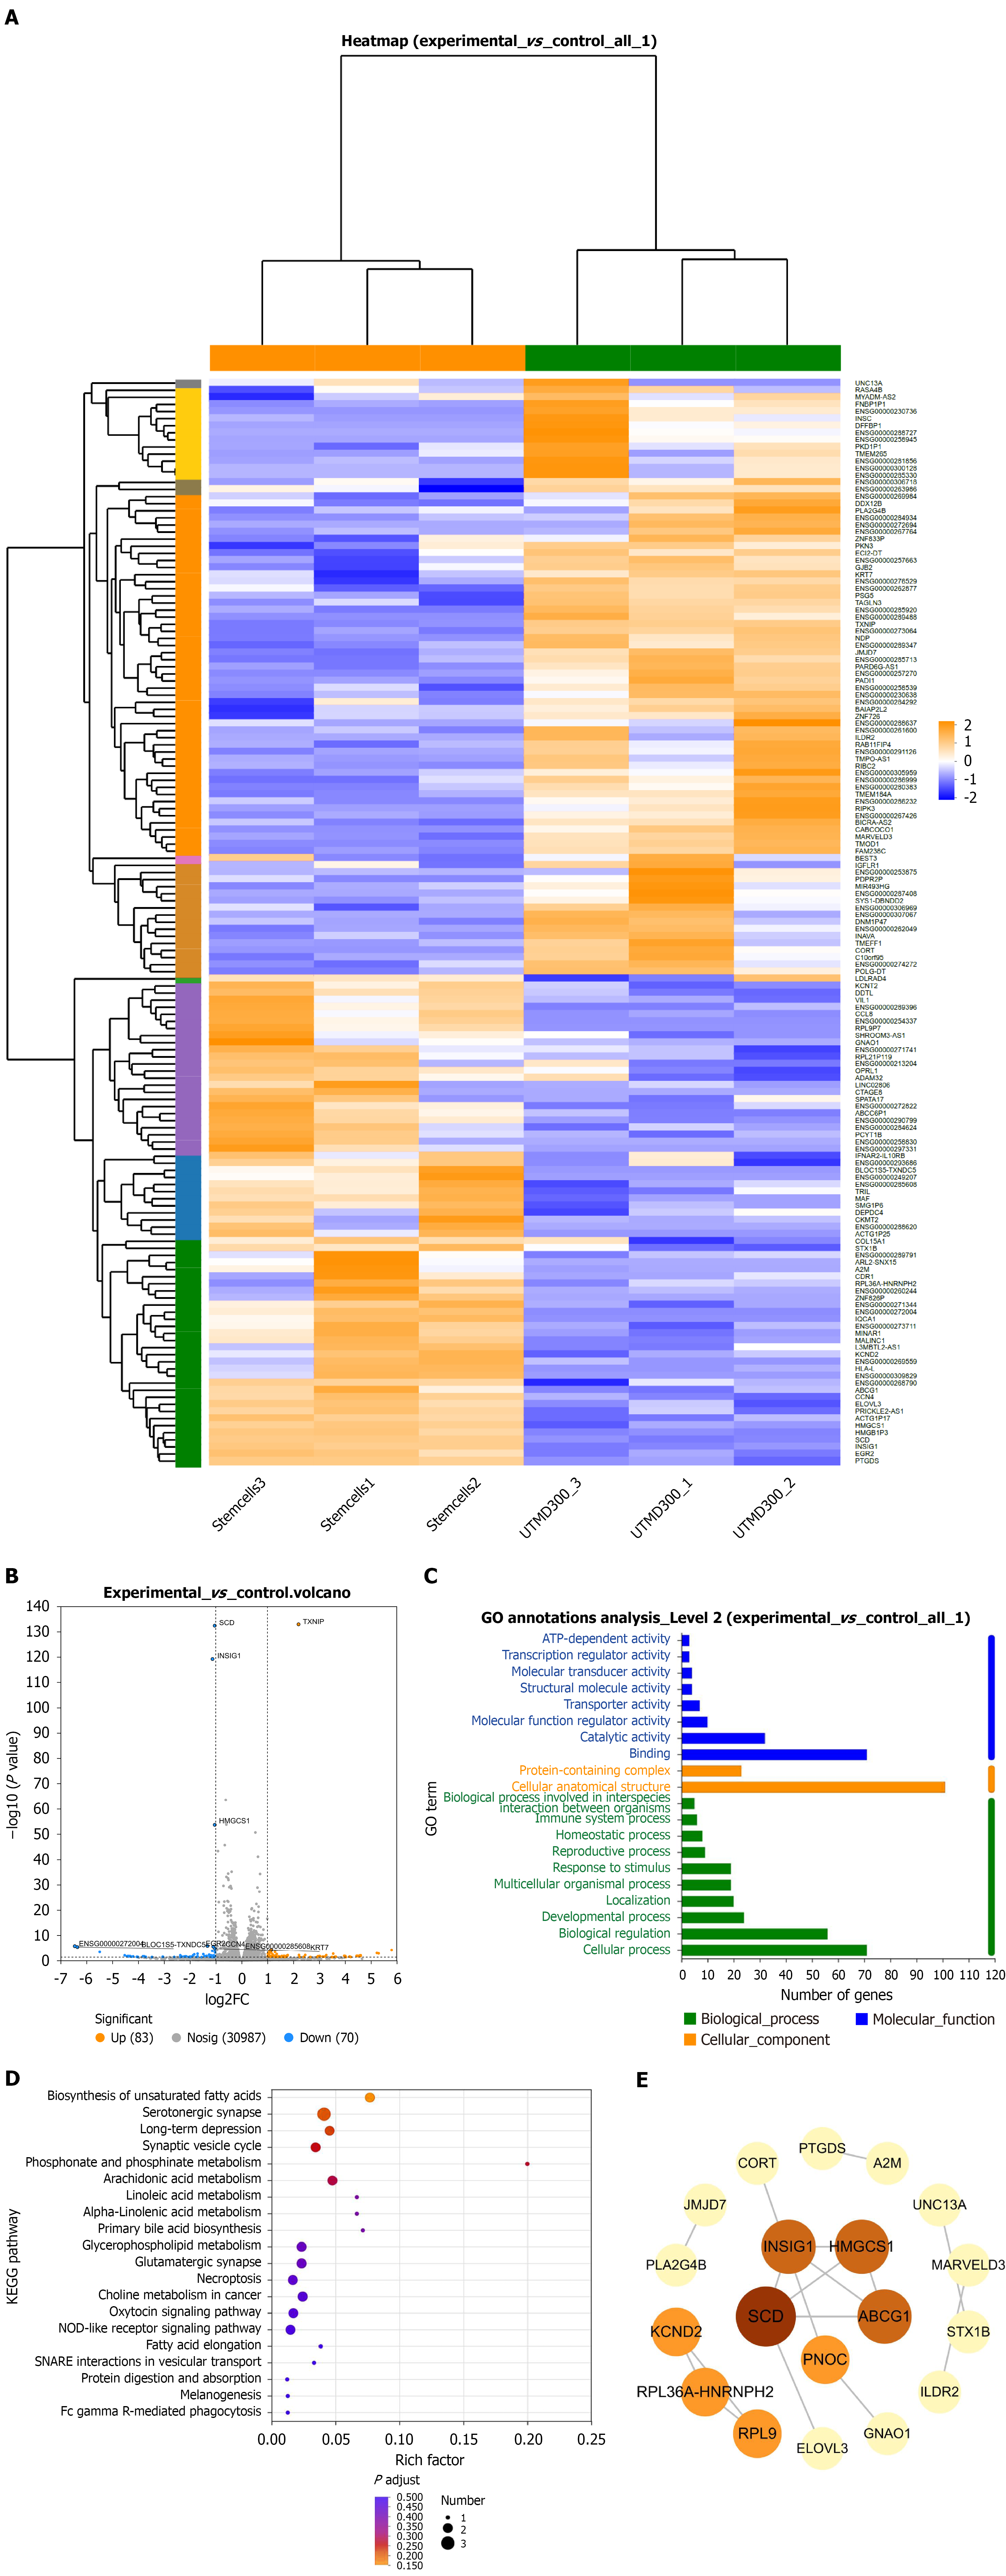
Figure 8 Transcriptomic analysis of differentially expressed genes.
A: Volcano plot of differentially expressed genes (DEGs) between the M, MB, U300s, and UTMD groups; B: Hierarchical clustering heatmap of mRNA expression profiles; C: Bar chart of significantly enriched Gene Ontology terms among DEGs; D: Bar chart of significantly enriched Kyoto Encyclopedia of Genes and Genomes pathways among DEGs; E: Protein-protein interaction network of core regulatory genes among the DEGs.
- Citation: Zhang P, La BY, Zhang ML, Rewan B, Zhang LY, La XL. Experimental study on ultrasound-targeted microbubble destruction promoting the proliferation, migration of human umbilical cord mesenchymal stem cells. World J Stem Cells 2026; 18(9): 123933
- URL: https://www.wjgnet.com/1948-0210/full/v18/i9/123933.htm
- DOI: https://dx.doi.org/10.4252/wjsc.123933