
















Copyright: ©Author(s) 2026.
World J Stem Cells. Sep 26, 2026; 18(9): 122036
Published online Sep 26, 2026. doi: 10.4252/wjsc.122036
Published online Sep 26, 2026. doi: 10.4252/wjsc.122036
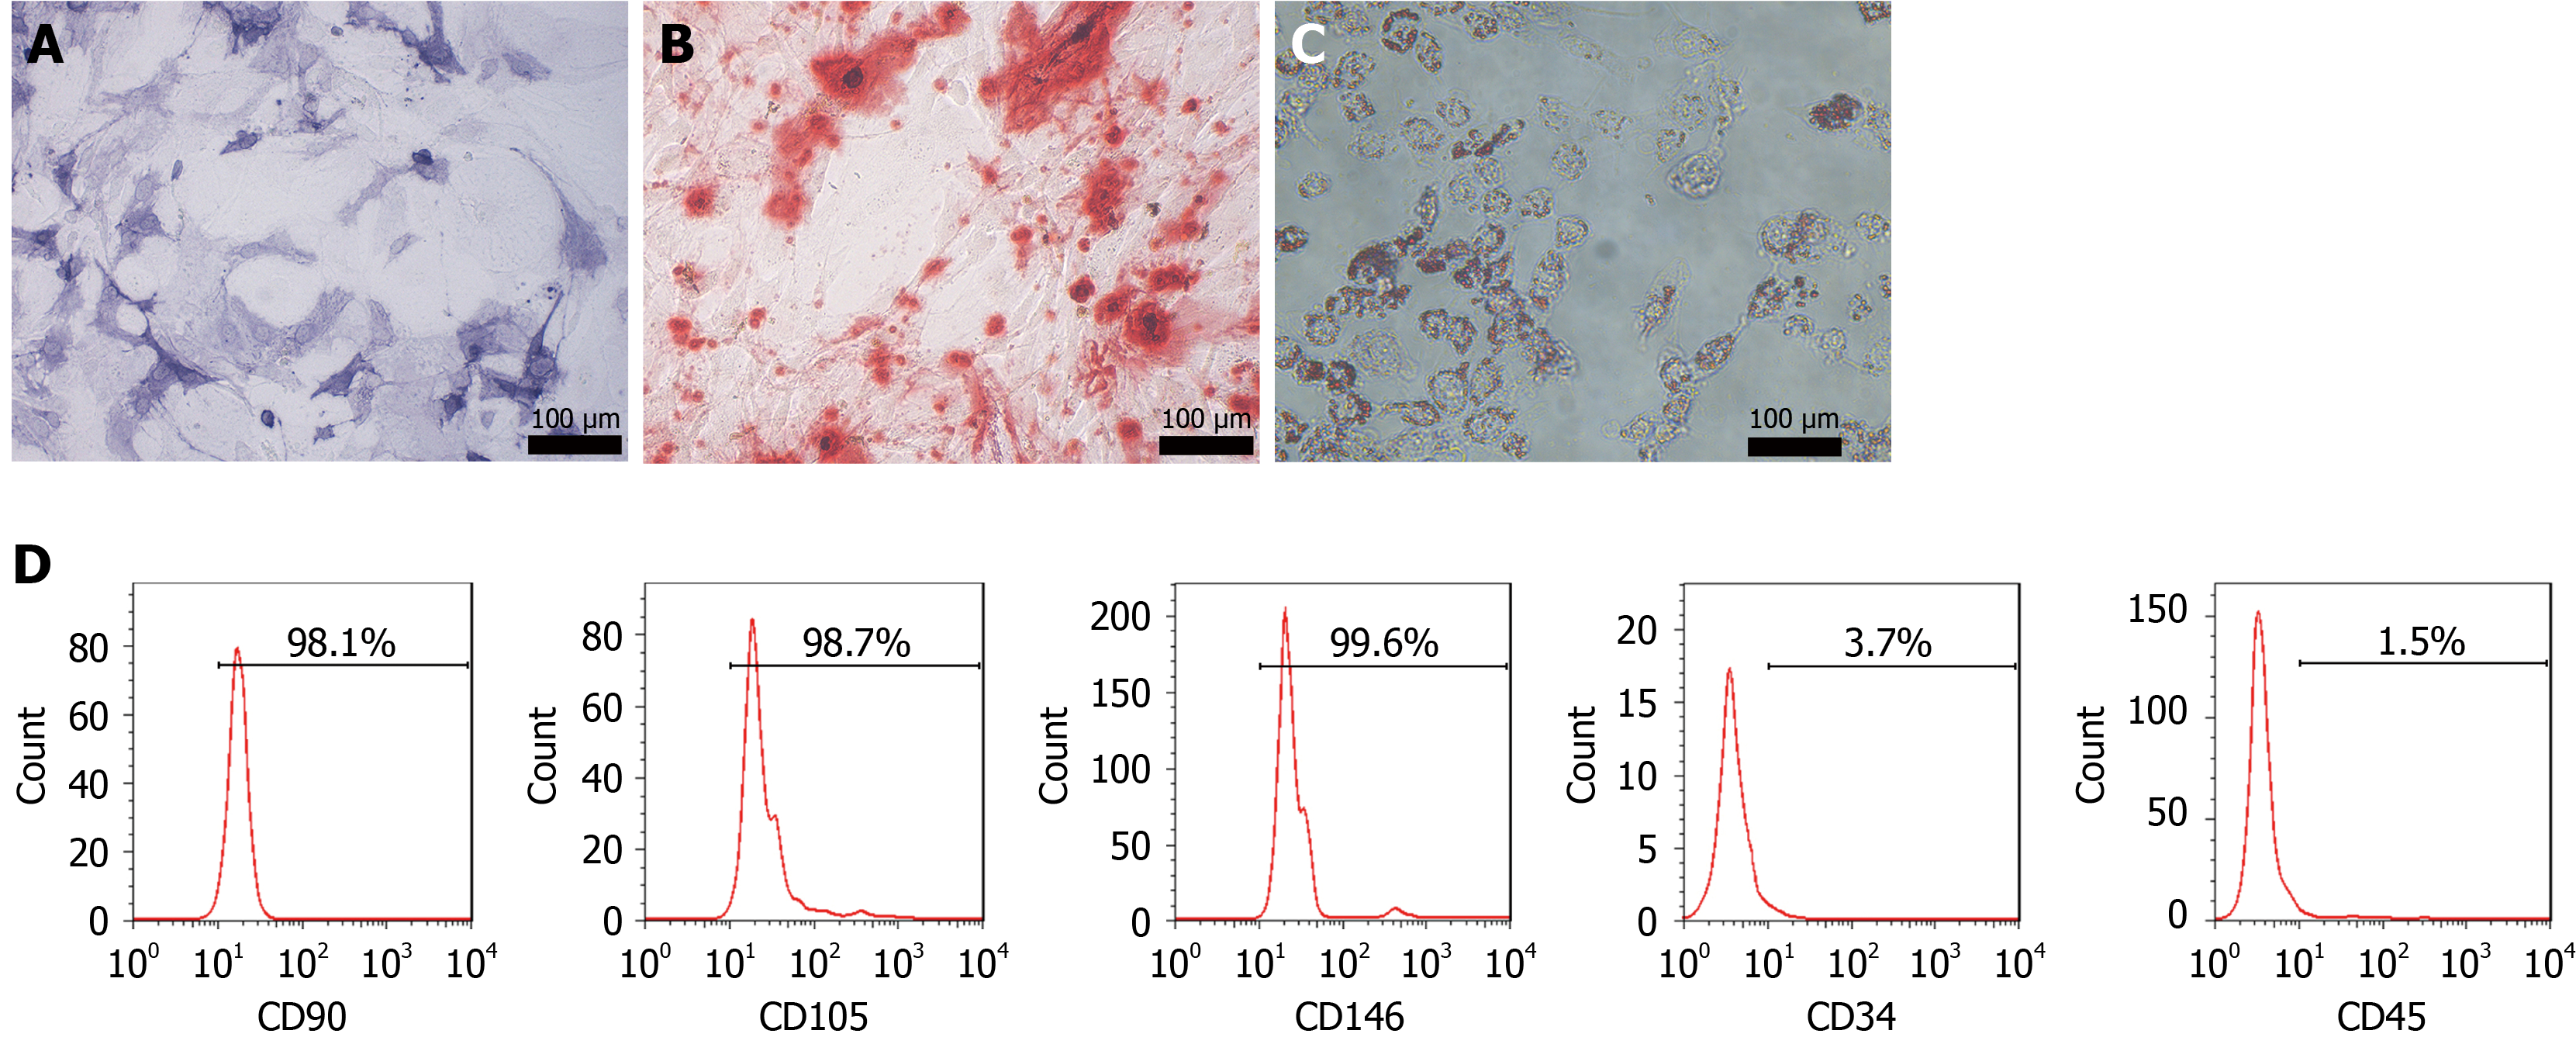
Figure 1 Characteristics of dental pulp stem cells by alkaline phosphatase and Alizarin Red S staining.
A: Image of alkaline phosphatase; B: Alizarin Red S staining of dental pulp stem cells (DPSCs) after osteogenic differentiation induction; C: Image of Oil Red O staining of DPSCs after adipogenic differentiation induction; D: Flow cytometry analysis of stem cell surface markers, including CD90, CD105, CD146, CD34, and CD45. n = 3/group.
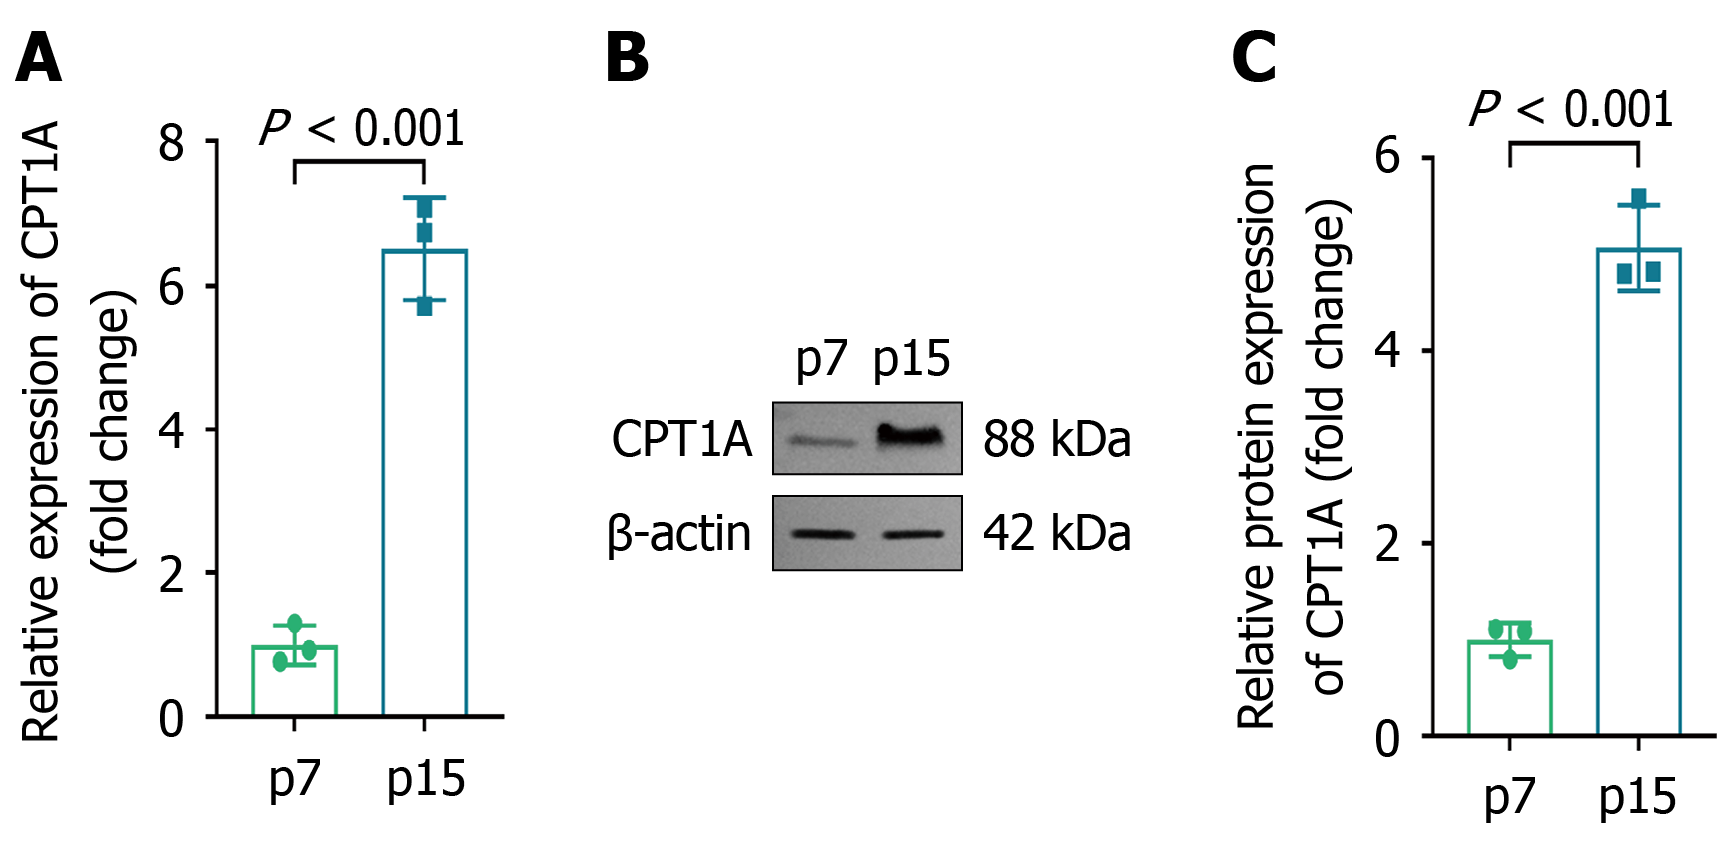
Figure 2 Carnitine palmitoyltransferase 1A is highly expressed in dental pulp stem cells at passage 15.
A: The expression of carnitine palmitoyltransferase 1A (CPT1A) was detected in dental pulp stem cells at passage 7 (p7) and p15 using quantitative real-time polymerase chain reaction; B and C: The protein levels of CPT1A were measured using immunoblotting, and the results were quantified. n = 3/group; P < 0.001 indicates statistically significant differences. CPT1A: Carnitine palmitoyltransferase 1A.
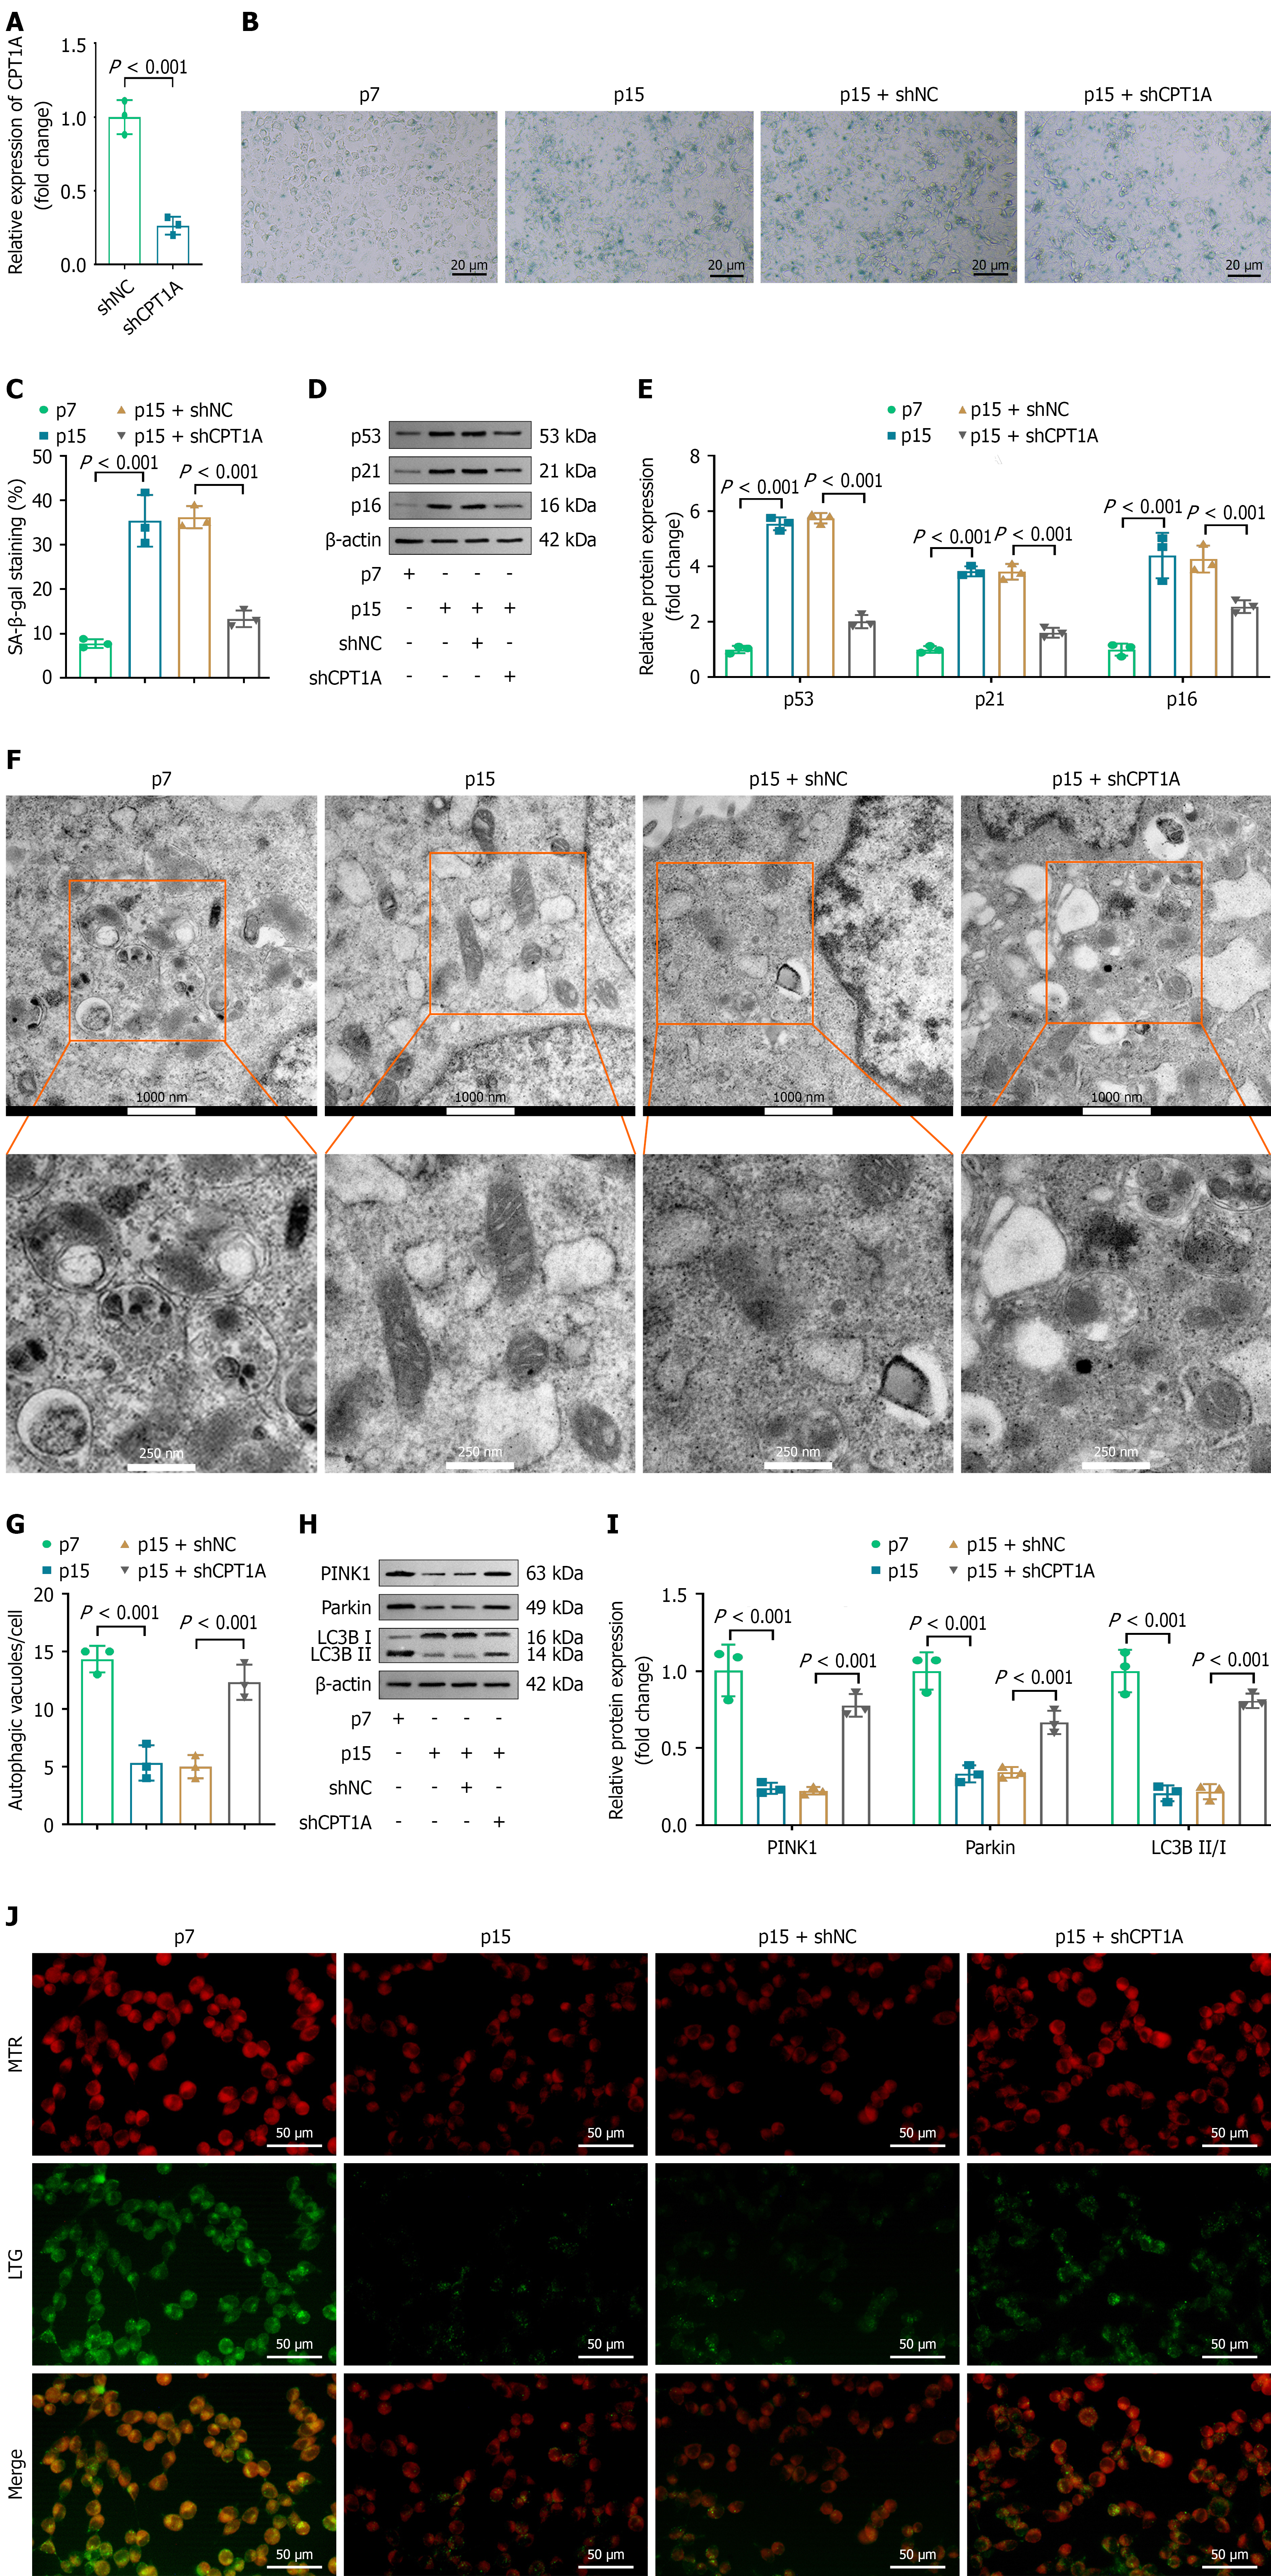
Figure 3 Knockdown of carnitine palmitoyltransferase 1A suppresses senescence and promotes mitophagy.
A: Dental pulp stem cells (DPSCs) at passage 15 (p15) were transfected with shNC and shCPT1A, and quantitative real-time polymerase chain reaction was conducted to measure CPT1A expression; B and C: After transfection, senescence in DPSCs was observed using senescence associated β-galactosidase staining; D and E: The levels of aging markers (p53, p21, and p16) were measured using immunoblotting; F: Transmission electron microscopy evaluation of mitophagy; G: Quantification of autophagic vacuoles per cell; H and I: The levels of mitophagy markers (PINK1, Parkin, and LC3B) were measured using immunoblotting; J: Immunofluorescent assay was conducted to visualize mitochondria (red dots) and lysosomes (green dots). n = 3/group; P < 0.001 indicates statistically significant differences. CPT1A: Carnitine palmitoyltransferase 1A; SA-β-gal: Senescence associated β-galactosidase.
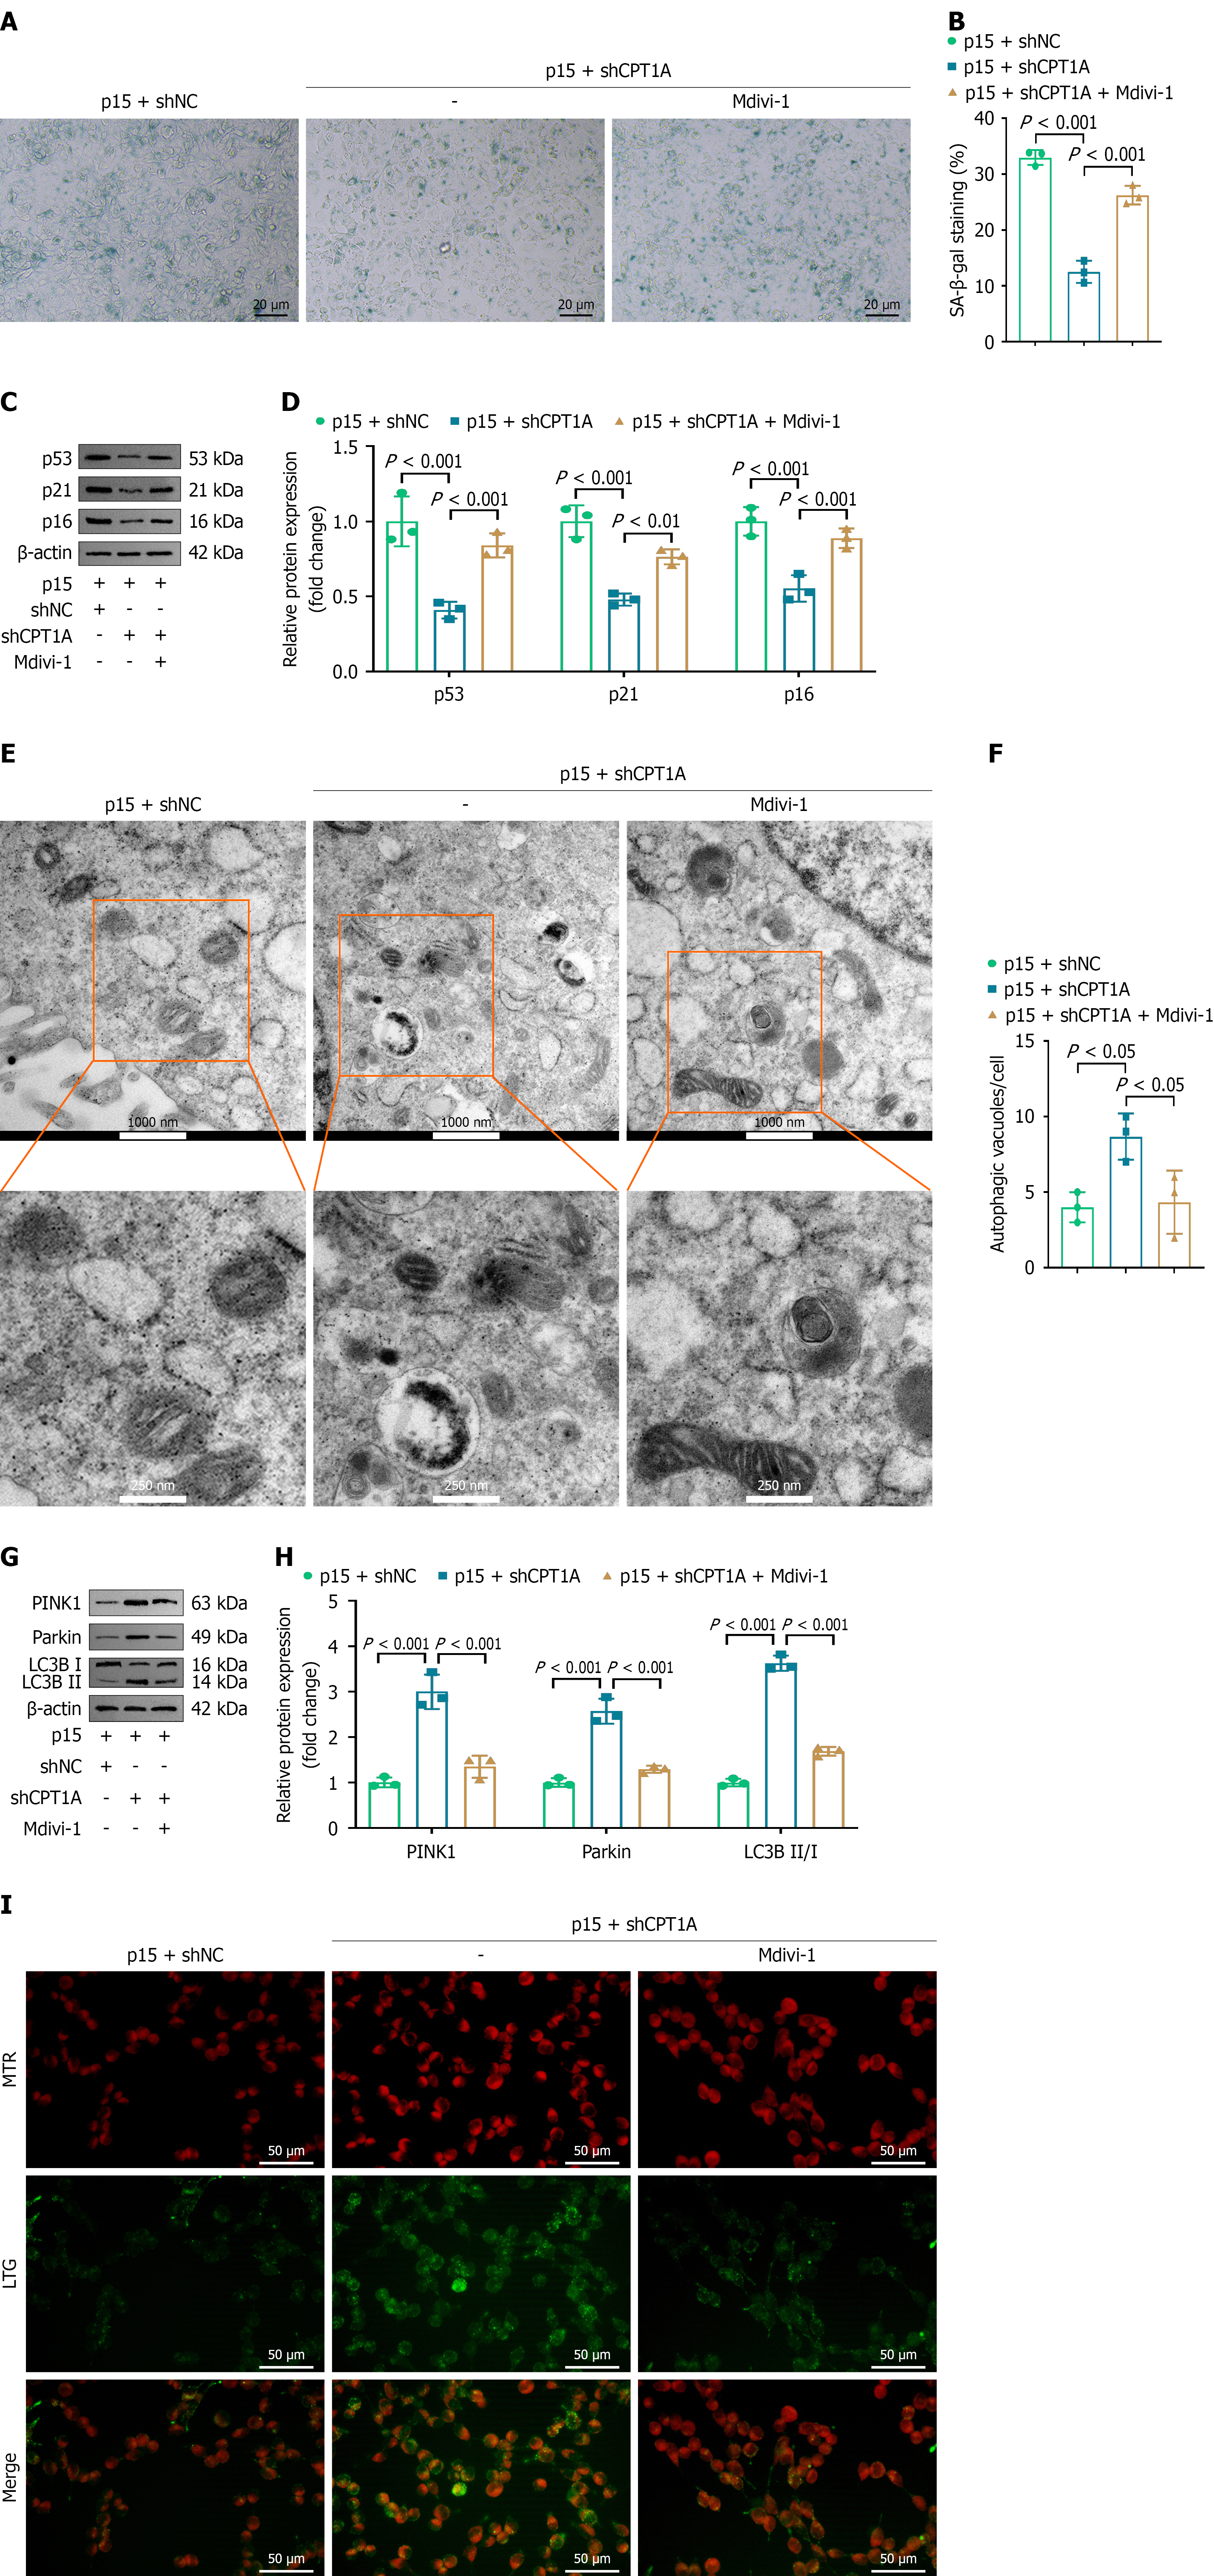
Figure 4 Mitophagy is a necessary process for carnitine palmitoyltransferase 1A to regulate dental pulp stem cell senescence.
A and B: Dental pulp stem cells (DPSCs) at passage 15 (p15) were transfected with shNC and shCPT1A and treated with mitophagy inhibitor Mdivi-1, senescence in DPSCs was observed using senescence associated β-galactosidase staining; C and D: The levels of aging markers (p53, p21, and p16) were measured using immunoblotting; E: Transmission electron microscopy evaluation of mitophagy; F: Quantification of autophagic vacuoles per cell; G and H: The levels of mitophagy markers (PINK1, Parkin, and LC3B) were measured using immunoblotting; I: Immunofluorescent assay was conducted to visualize mitochondria (red dots) and lysosomes (green dots). n = 3/group; P < 0.001 and P < 0.05 indicate statistically significant differences. CPT1A: Carnitine palmitoyltransferase 1A; SA-β-gal: Senescence associated β-galactosidase.
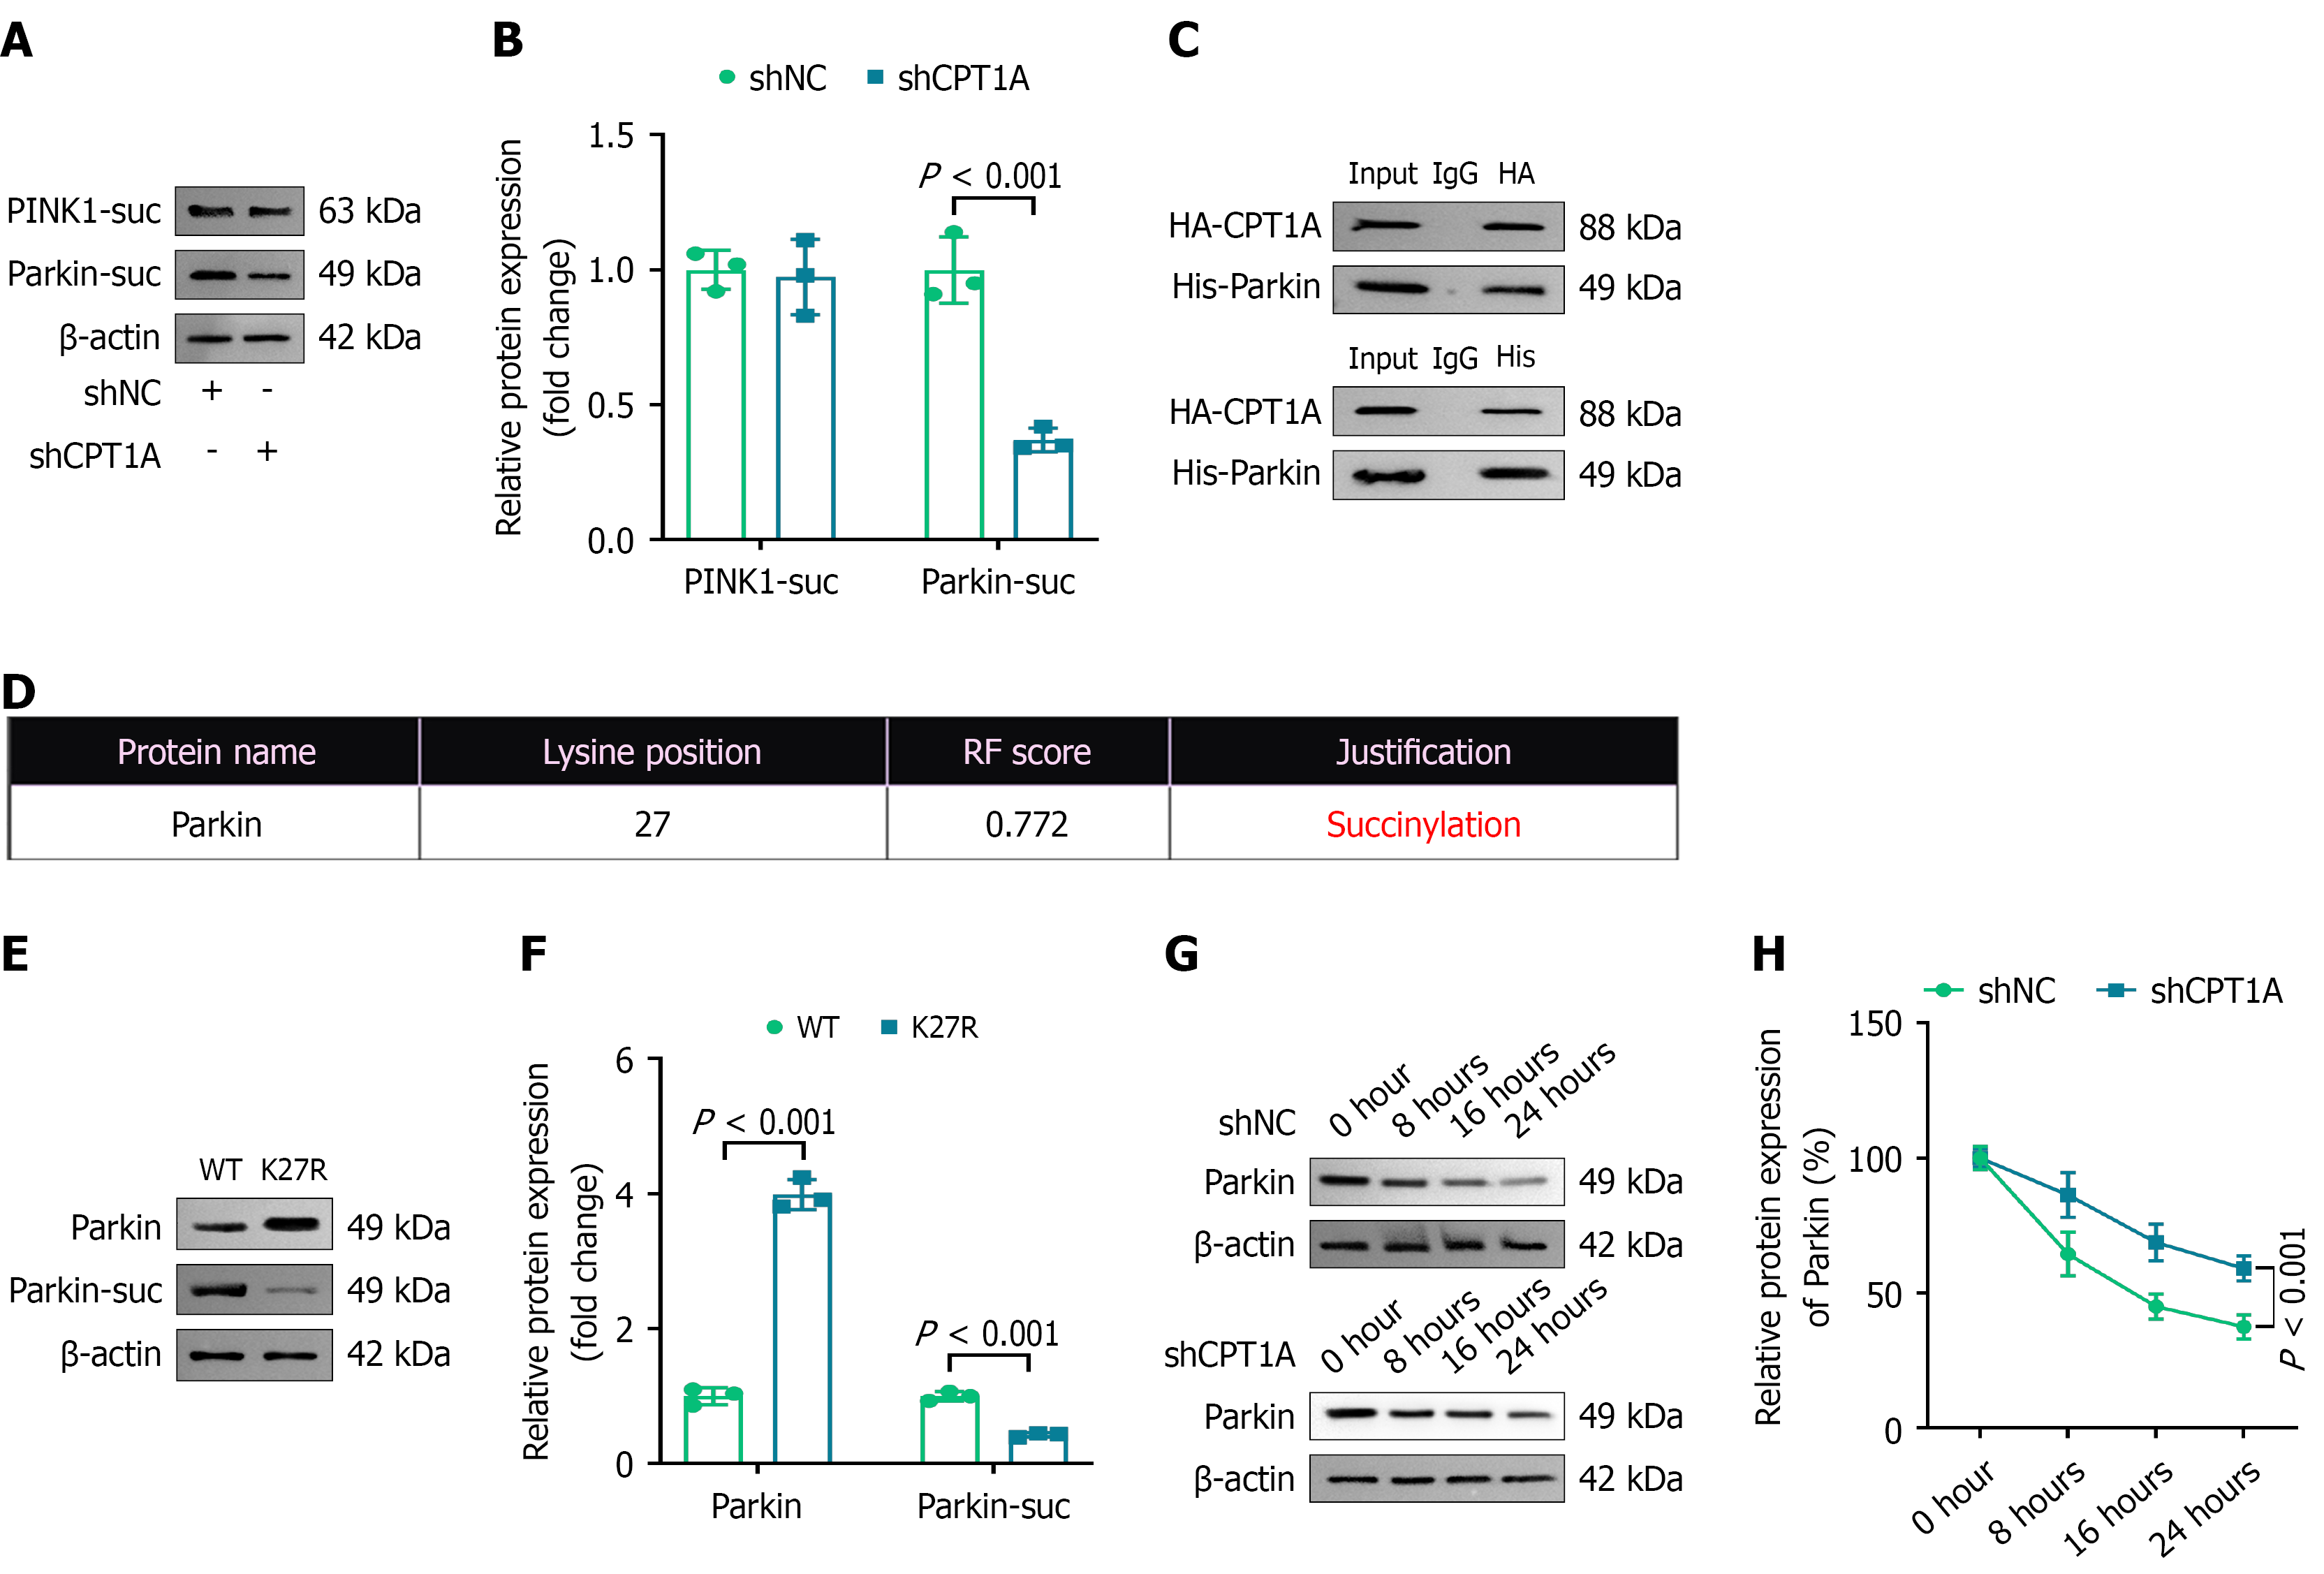
Figure 5 Carnitine palmitoyltransferase 1A is the succinyltransferase for Parkin and promotes its degradation.
A and B: Dental pulp stem cells (DPSCs) were transfected with shNC and shCPT1A, and the succinylation levels of PINK1 and Parkin were measured using immunoprecipitation (IP) with anti-succinyllysine and immunoblotting with anti-PINK1 and anti-Parkin; C: The interaction between CPT1A and Parkin proteins was evaluated in HEK293T cells using co-IP; D: Potential succinylation sites in Parkin were predicted using the GPSuc database; E and F: After wild type or K27R Parkin plasmids were transfected into HEK293T cells, immunoblotting was performed to measure Parkin protein levels, and Parkin succinylation levels were detected by IP using anti-succinyllysine and immunoblotting using anti-Parkin; G and H: DPSCs were transfected with shNC or shCPT1A and then treated with cycloheximide for 0, 8, 16, and 24 hours, and Parkin protein levels were detected using immunoblotting. n = 3/group; P < 0.001 indicates statistically significant differences. CPT1A: Carnitine palmitoyltransferase 1A; WT: Wild type.
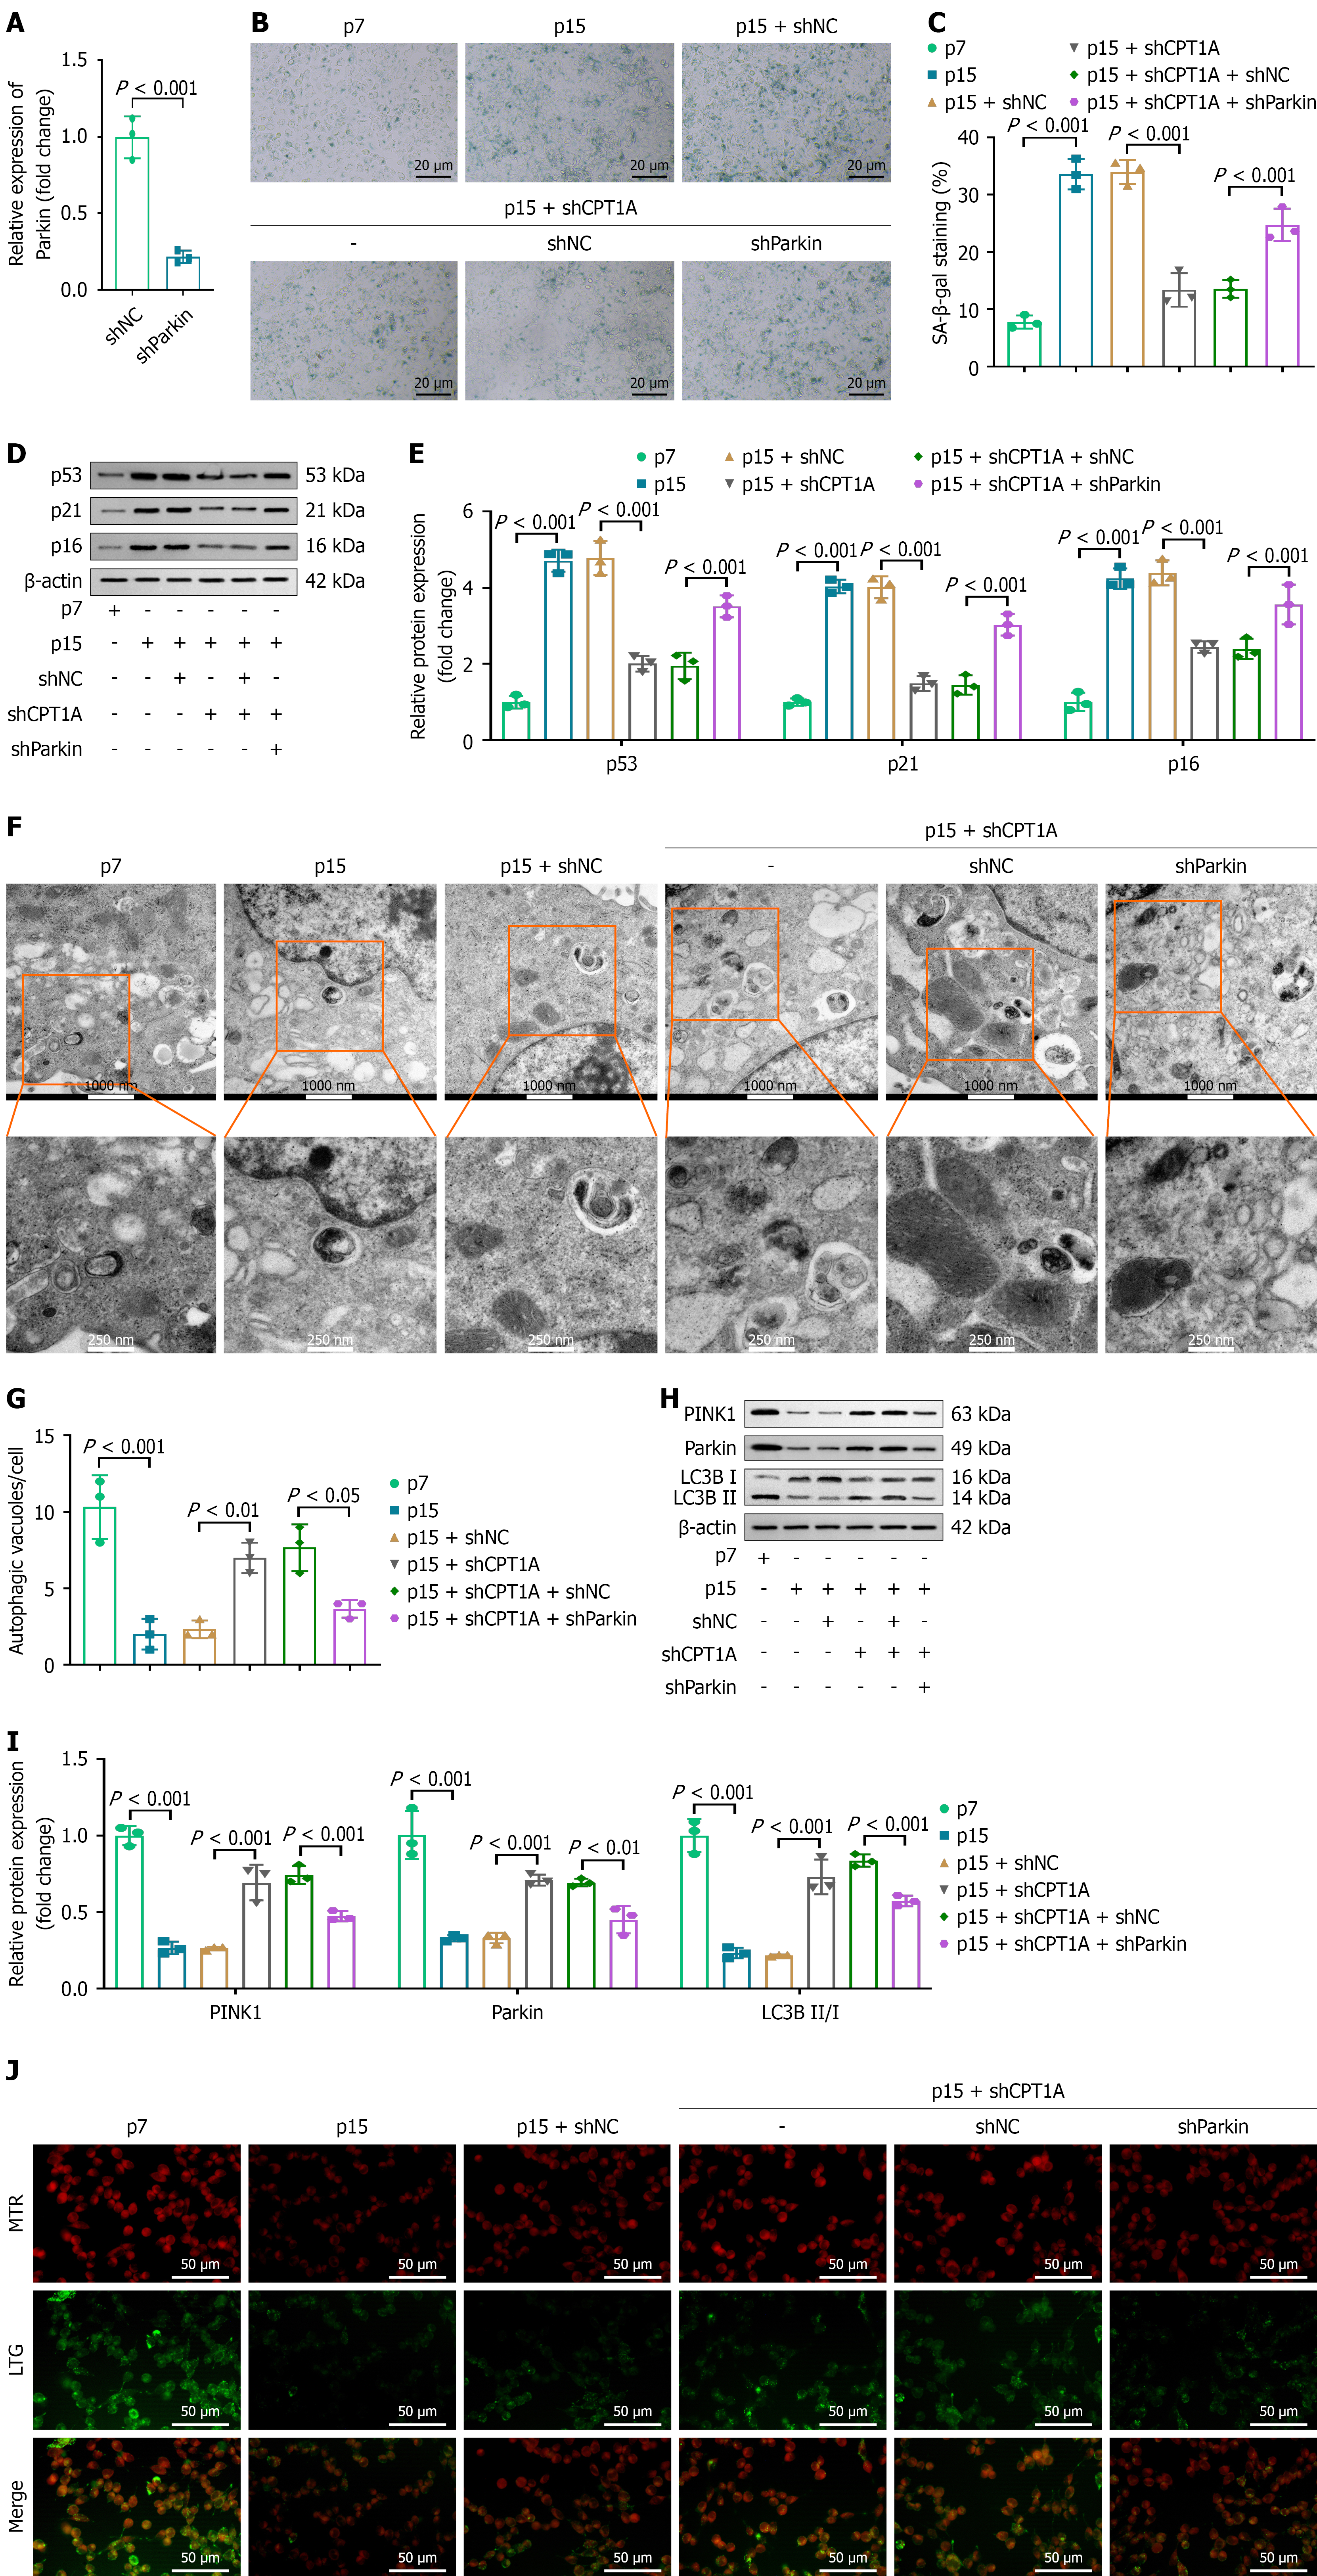
Figure 6 Parkin reverses the impacts on senescence and mitophagy caused by carnitine palmitoyltransferase 1A.
A: Dental pulp stem cells (DPSCs) at passage 15 (p15) were transfected with shNC and shParkin, and quantitative real-time polymerase chain reaction was conducted to measure Parkin expression; B and C: After transfection with shCPT1A and shParkin, senescence in DPSCs was observed using senescence associated β-galactosidase staining; D and E: The levels of aging markers (p53, p21, and p16) were measured using immunoblotting; F: Transmission electron microscopy evaluation of mitophagy; G: Quantification of autophagic vacuoles per cell; H and I: The levels of mitophagy markers (PINK1, Parkin, and LC3B) were measured using immunoblotting; J: Immunofluorescent assay was conducted to visualize mitochondria (red dots) and lysosomes (green dots). n = 3/group; P < 0.001, P < 0.01, and P < 0.05 indicate statistically significant differences. CPT1A: Carnitine palmitoyltransferase 1A; SA-β-gal: Senescence associated β-galactosidase.
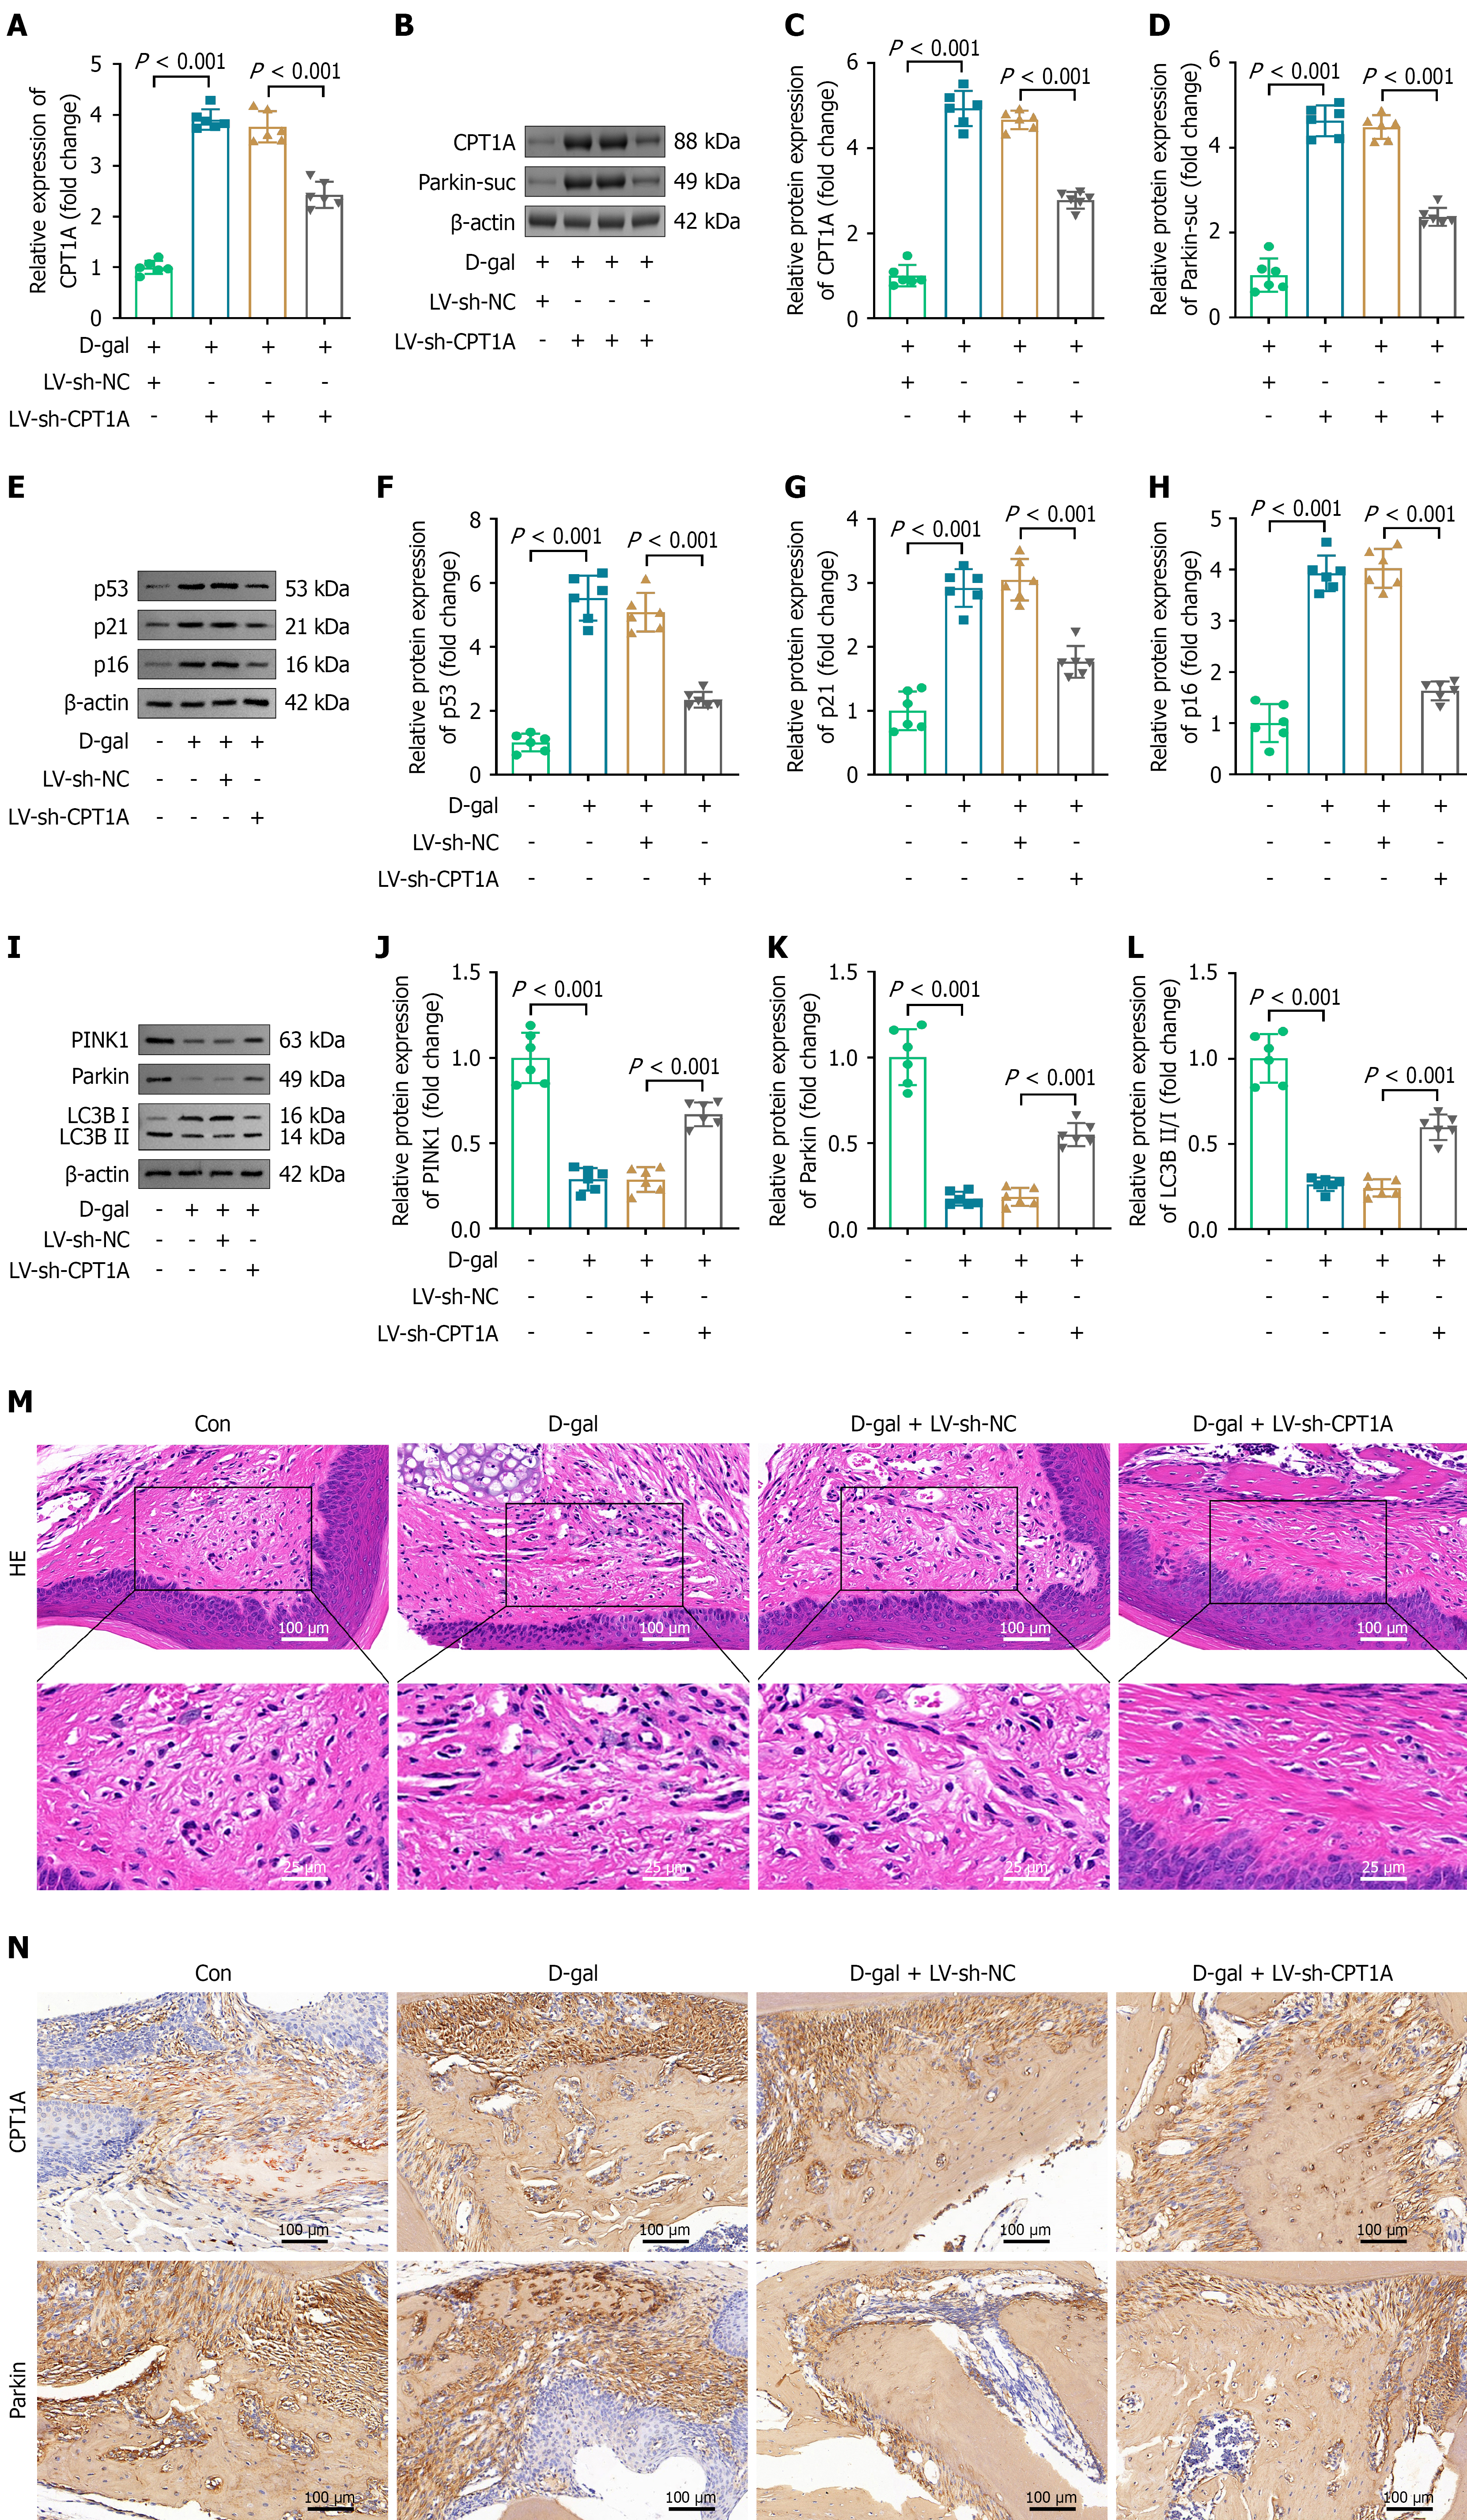
Figure 7 Knockdown of carnitine palmitoyltransferase 1A attenuates D-gal-induced senescence and facilitates mitophagy.
A: Carnitine palmitoyltransferase 1A (CPT1A) expression in the dental pulp tissues of mice was measured by quantitative real-time polymerase chain reaction; B-D: CPT1A protein levels in the dental pulp tissues were measured using immunoblotting, and Parkin succinylation levels were detected by immunoblotting after immunoprecipitation; E-L: The levels of aging markers (p53, p21, and p16) (E-H) and mitophagy markers (PINK1, Parkin, and LC3B) (I-L) in the dental pulp tissues of mice were examined using immunoblotting; M: The pathology of dental pulp tissues was evaluated using hematoxylin and eosin staining assay; N: CPT1A and Parkin levels in the dental pulp tissues were detected using immunohistochemistry. n = 6/group; P < 0.001 indicates statistically significant differences. CPT1A: Carnitine palmitoyltransferase 1A; HE: Hematoxylin and eosin.
- Citation: Lv HC, Fan YF, Ge XJ. Carnitine palmitoyltransferase 1A facilitates the senescence of human dental pulp stem cells by Parkin succinylation-mediated mitophagy. World J Stem Cells 2026; 18(9): 122036
- URL: https://www.wjgnet.com/1948-0210/full/v18/i9/122036.htm
- DOI: https://dx.doi.org/10.4252/wjsc.122036