
















Copyright: ©Author(s) 2026.
World J Stem Cells. Jul 26, 2026; 18(7): 119714
Published online Jul 26, 2026. doi: 10.4252/wjsc.119714
Published online Jul 26, 2026. doi: 10.4252/wjsc.119714
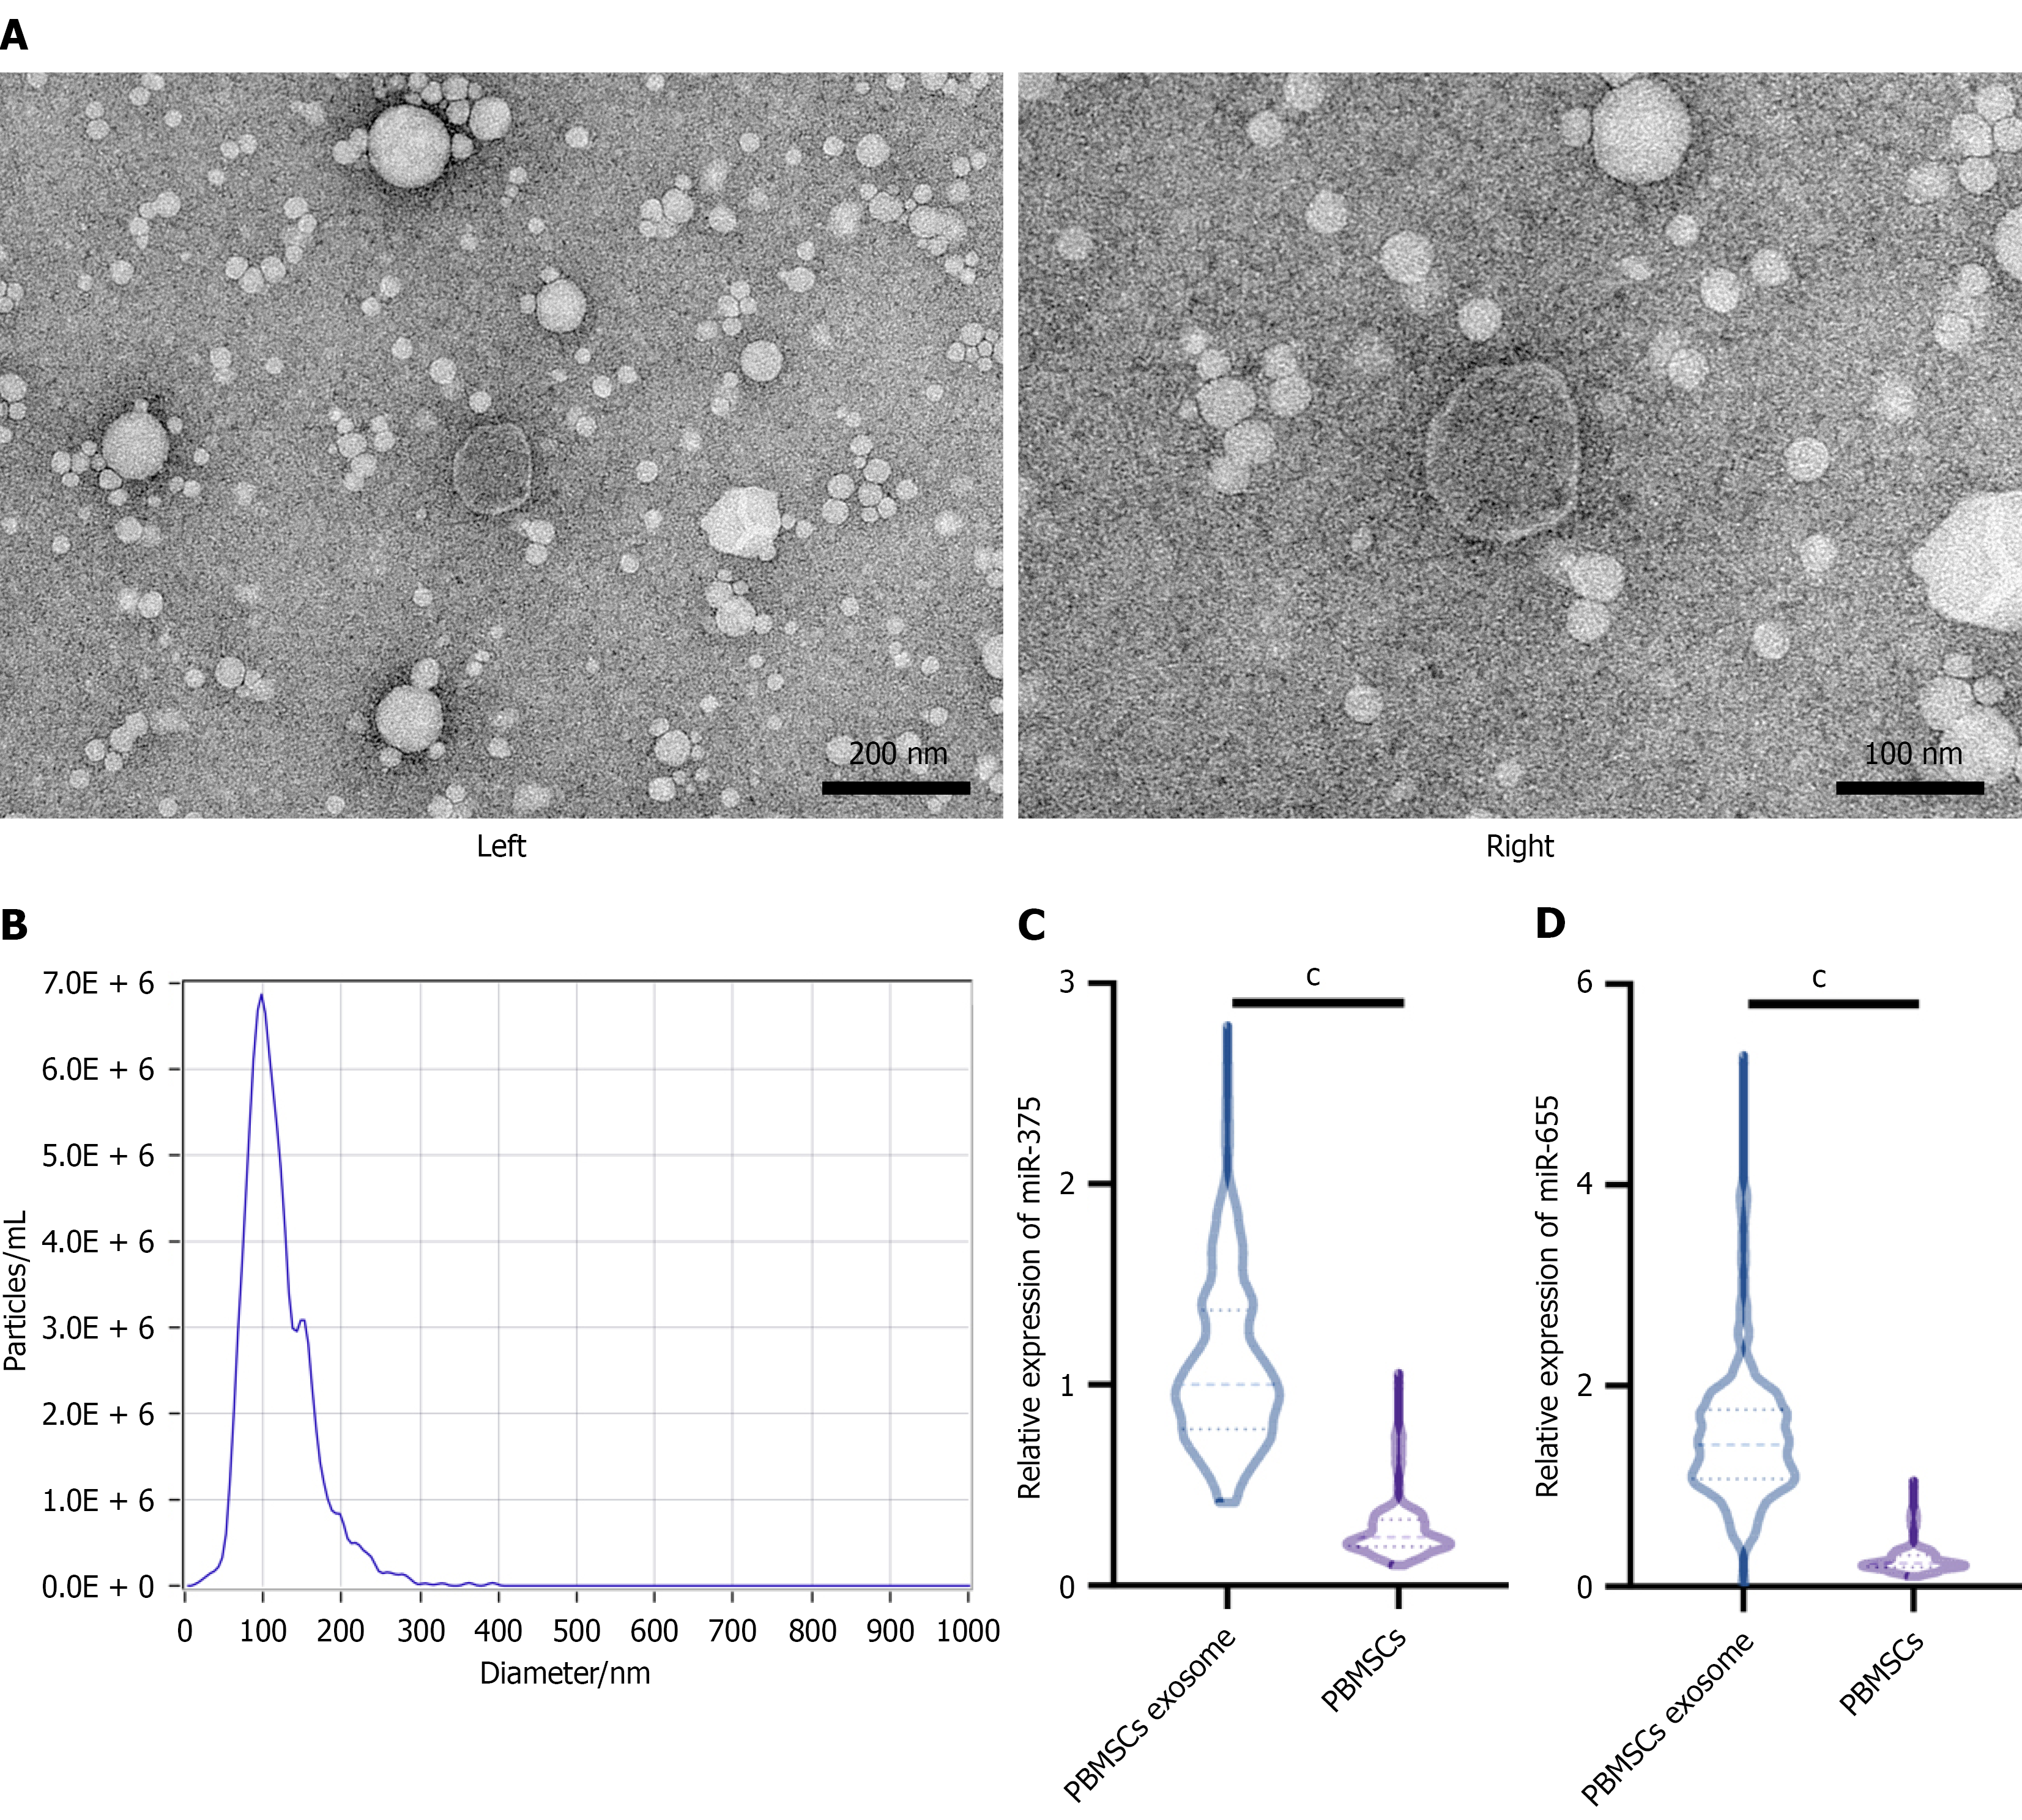
Figure 1 The expression levels of miR-375 and miR-655 in peripheral blood mesenchymal stem cells exosomes and peripheral blood mesenchymal stem cells from esophageal squamous cell carcinoma patients.
A: Transmission electron microscopy characterization of exosomes isolated from peripheral blood mesenchymal stem cells (PBMSCs) of esophageal squamous cell carcinoma (ESCC) patients (scale bar: Left, 200 nm; right, 100 nm); B: Nanoparticle tracking analysis characterization of exosomes isolated from PBMSCs of ESCC patients; C and D: Quantitative real-time polymerase chain reaction was used to measure the miR-375 (C), and miR-655 (D) levels in PBMSCs exosomes and PBMSCs of ESCC patients. cP < 0.001. PBMSCs: Peripheral blood mesenchymal stem cells.
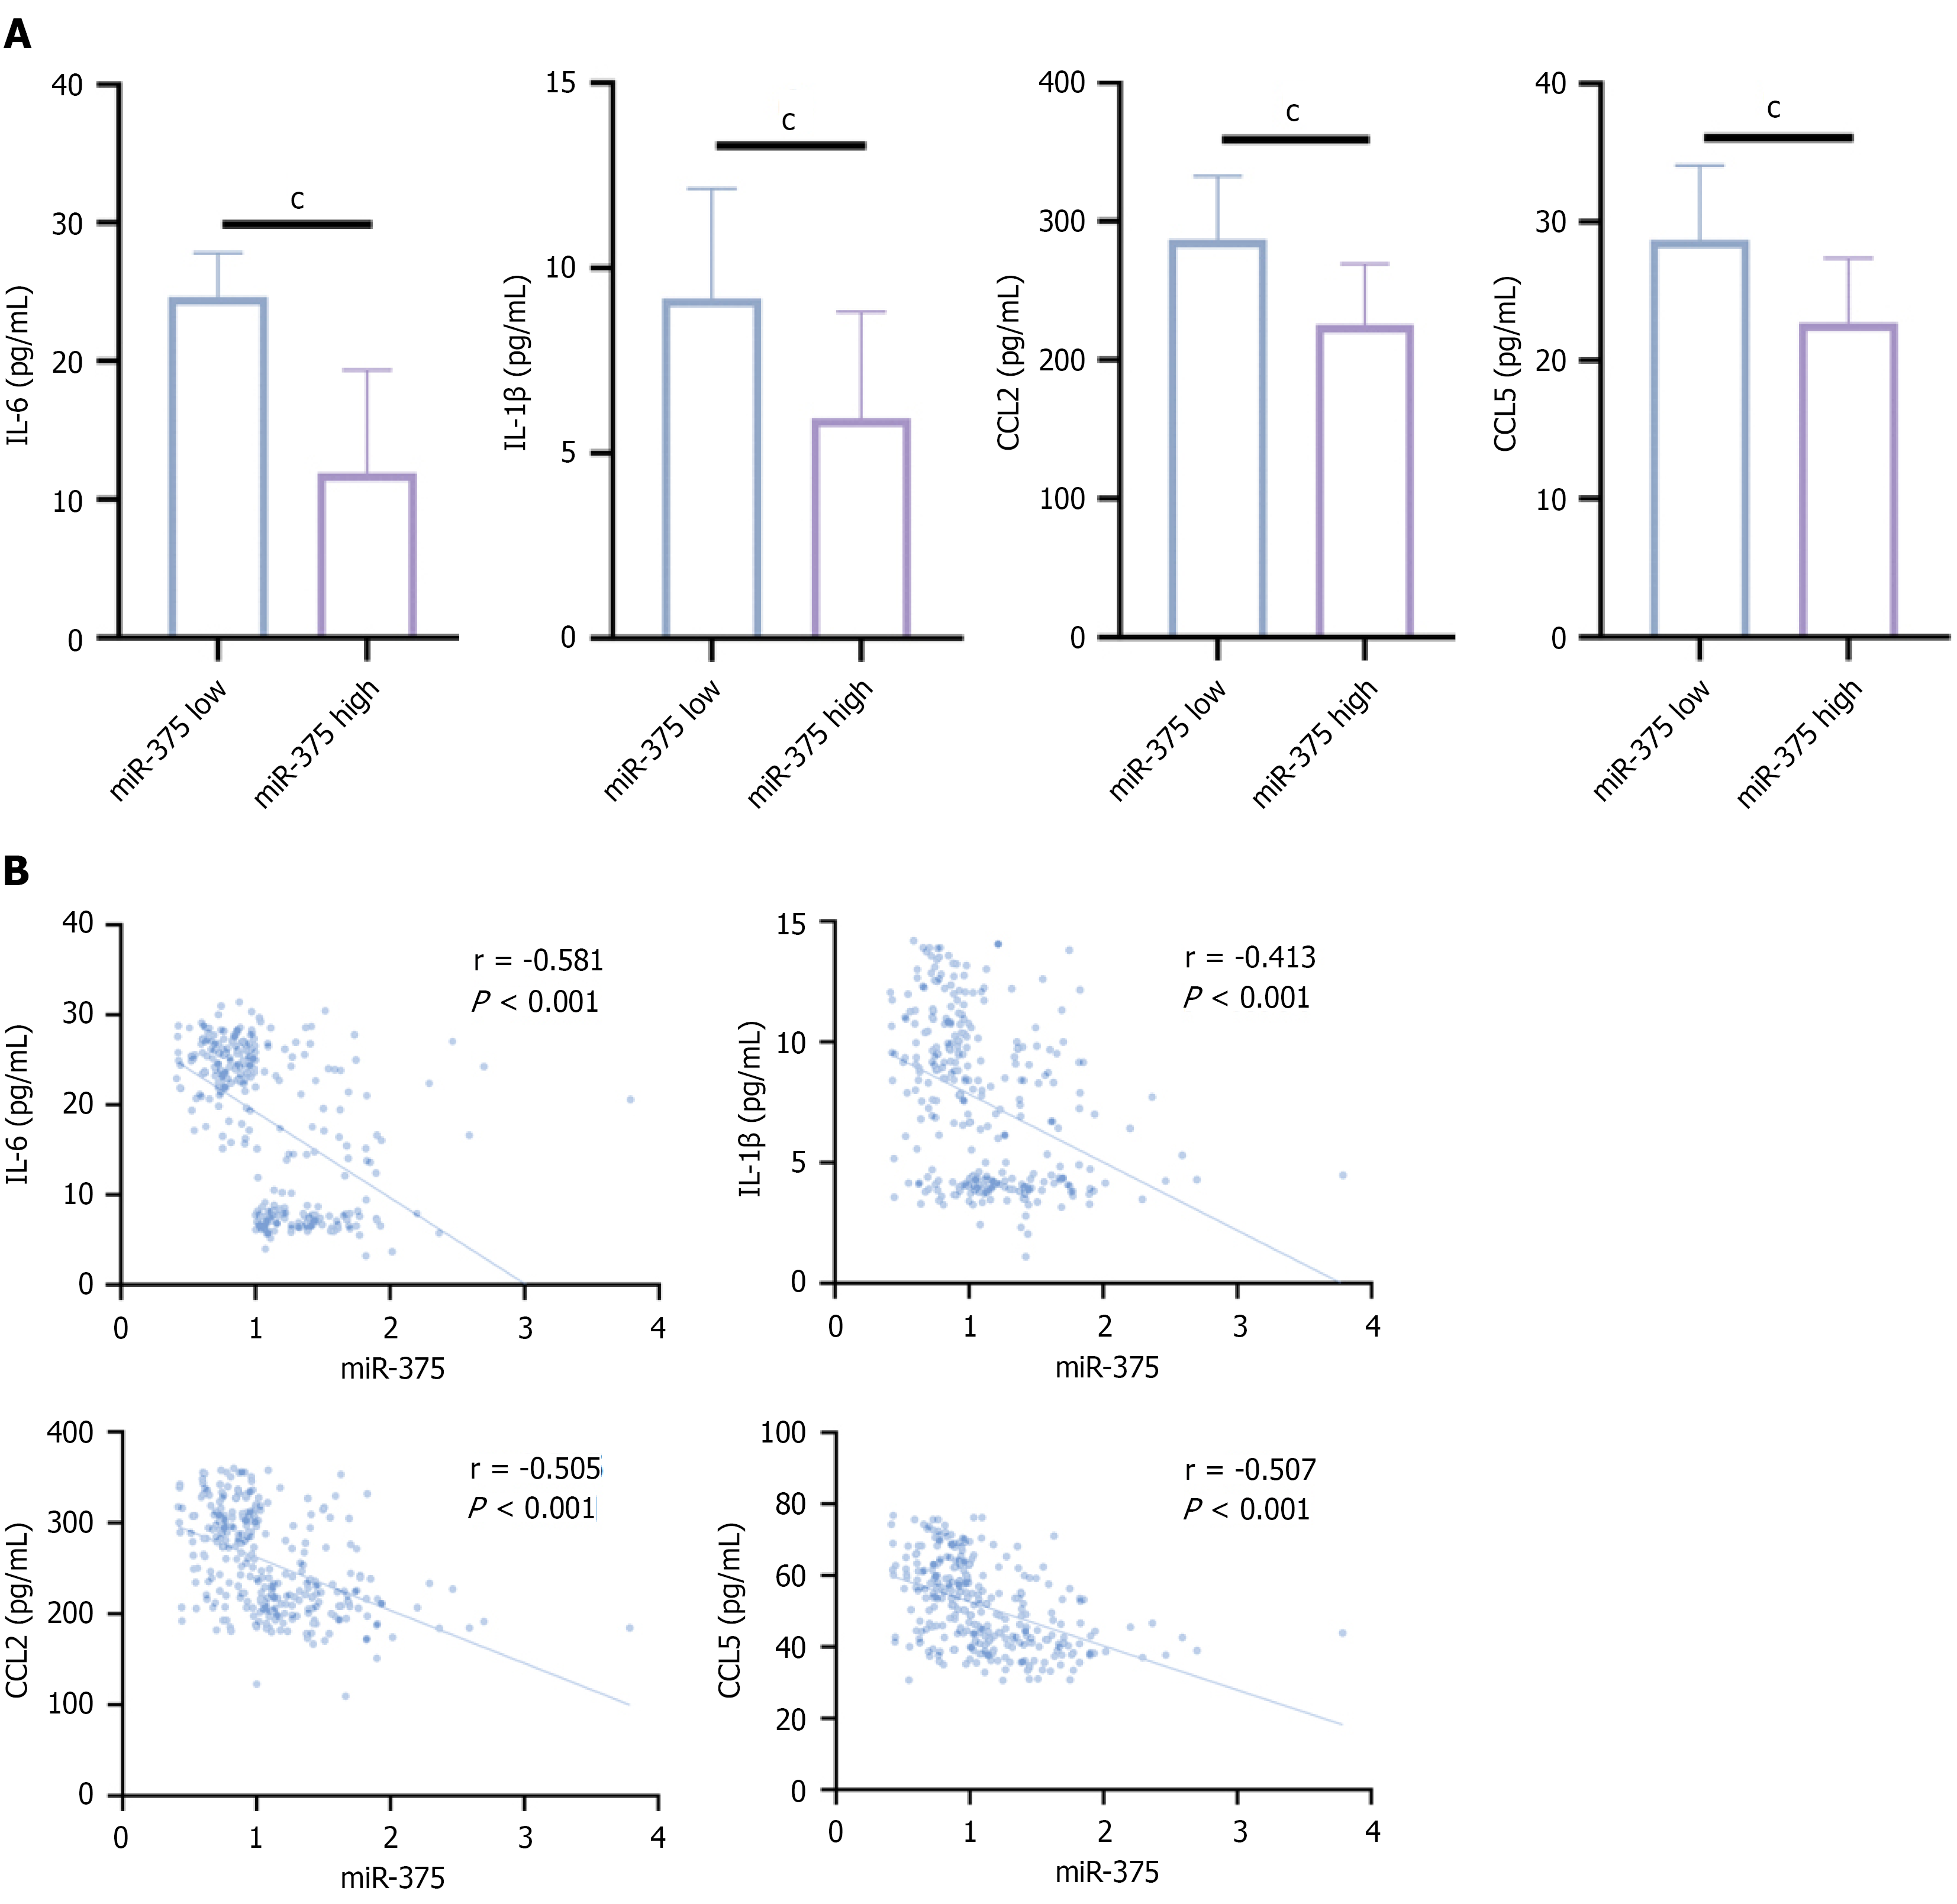
Figure 2 Correlation analysis of miR-375 expression with inflammatory factors.
A: Correlation analysis of miR-375 expression (low/high) with interleukin (IL)-6, IL-1β, CC-chemokine ligand 2 (CCL2) and CCL5; B: Correlation analysis of miR-375 with IL-6, IL-1β, CCL2 and CCL5. cP < 0.001. IL: Interleukin; CCL: CC-chemokine ligand.
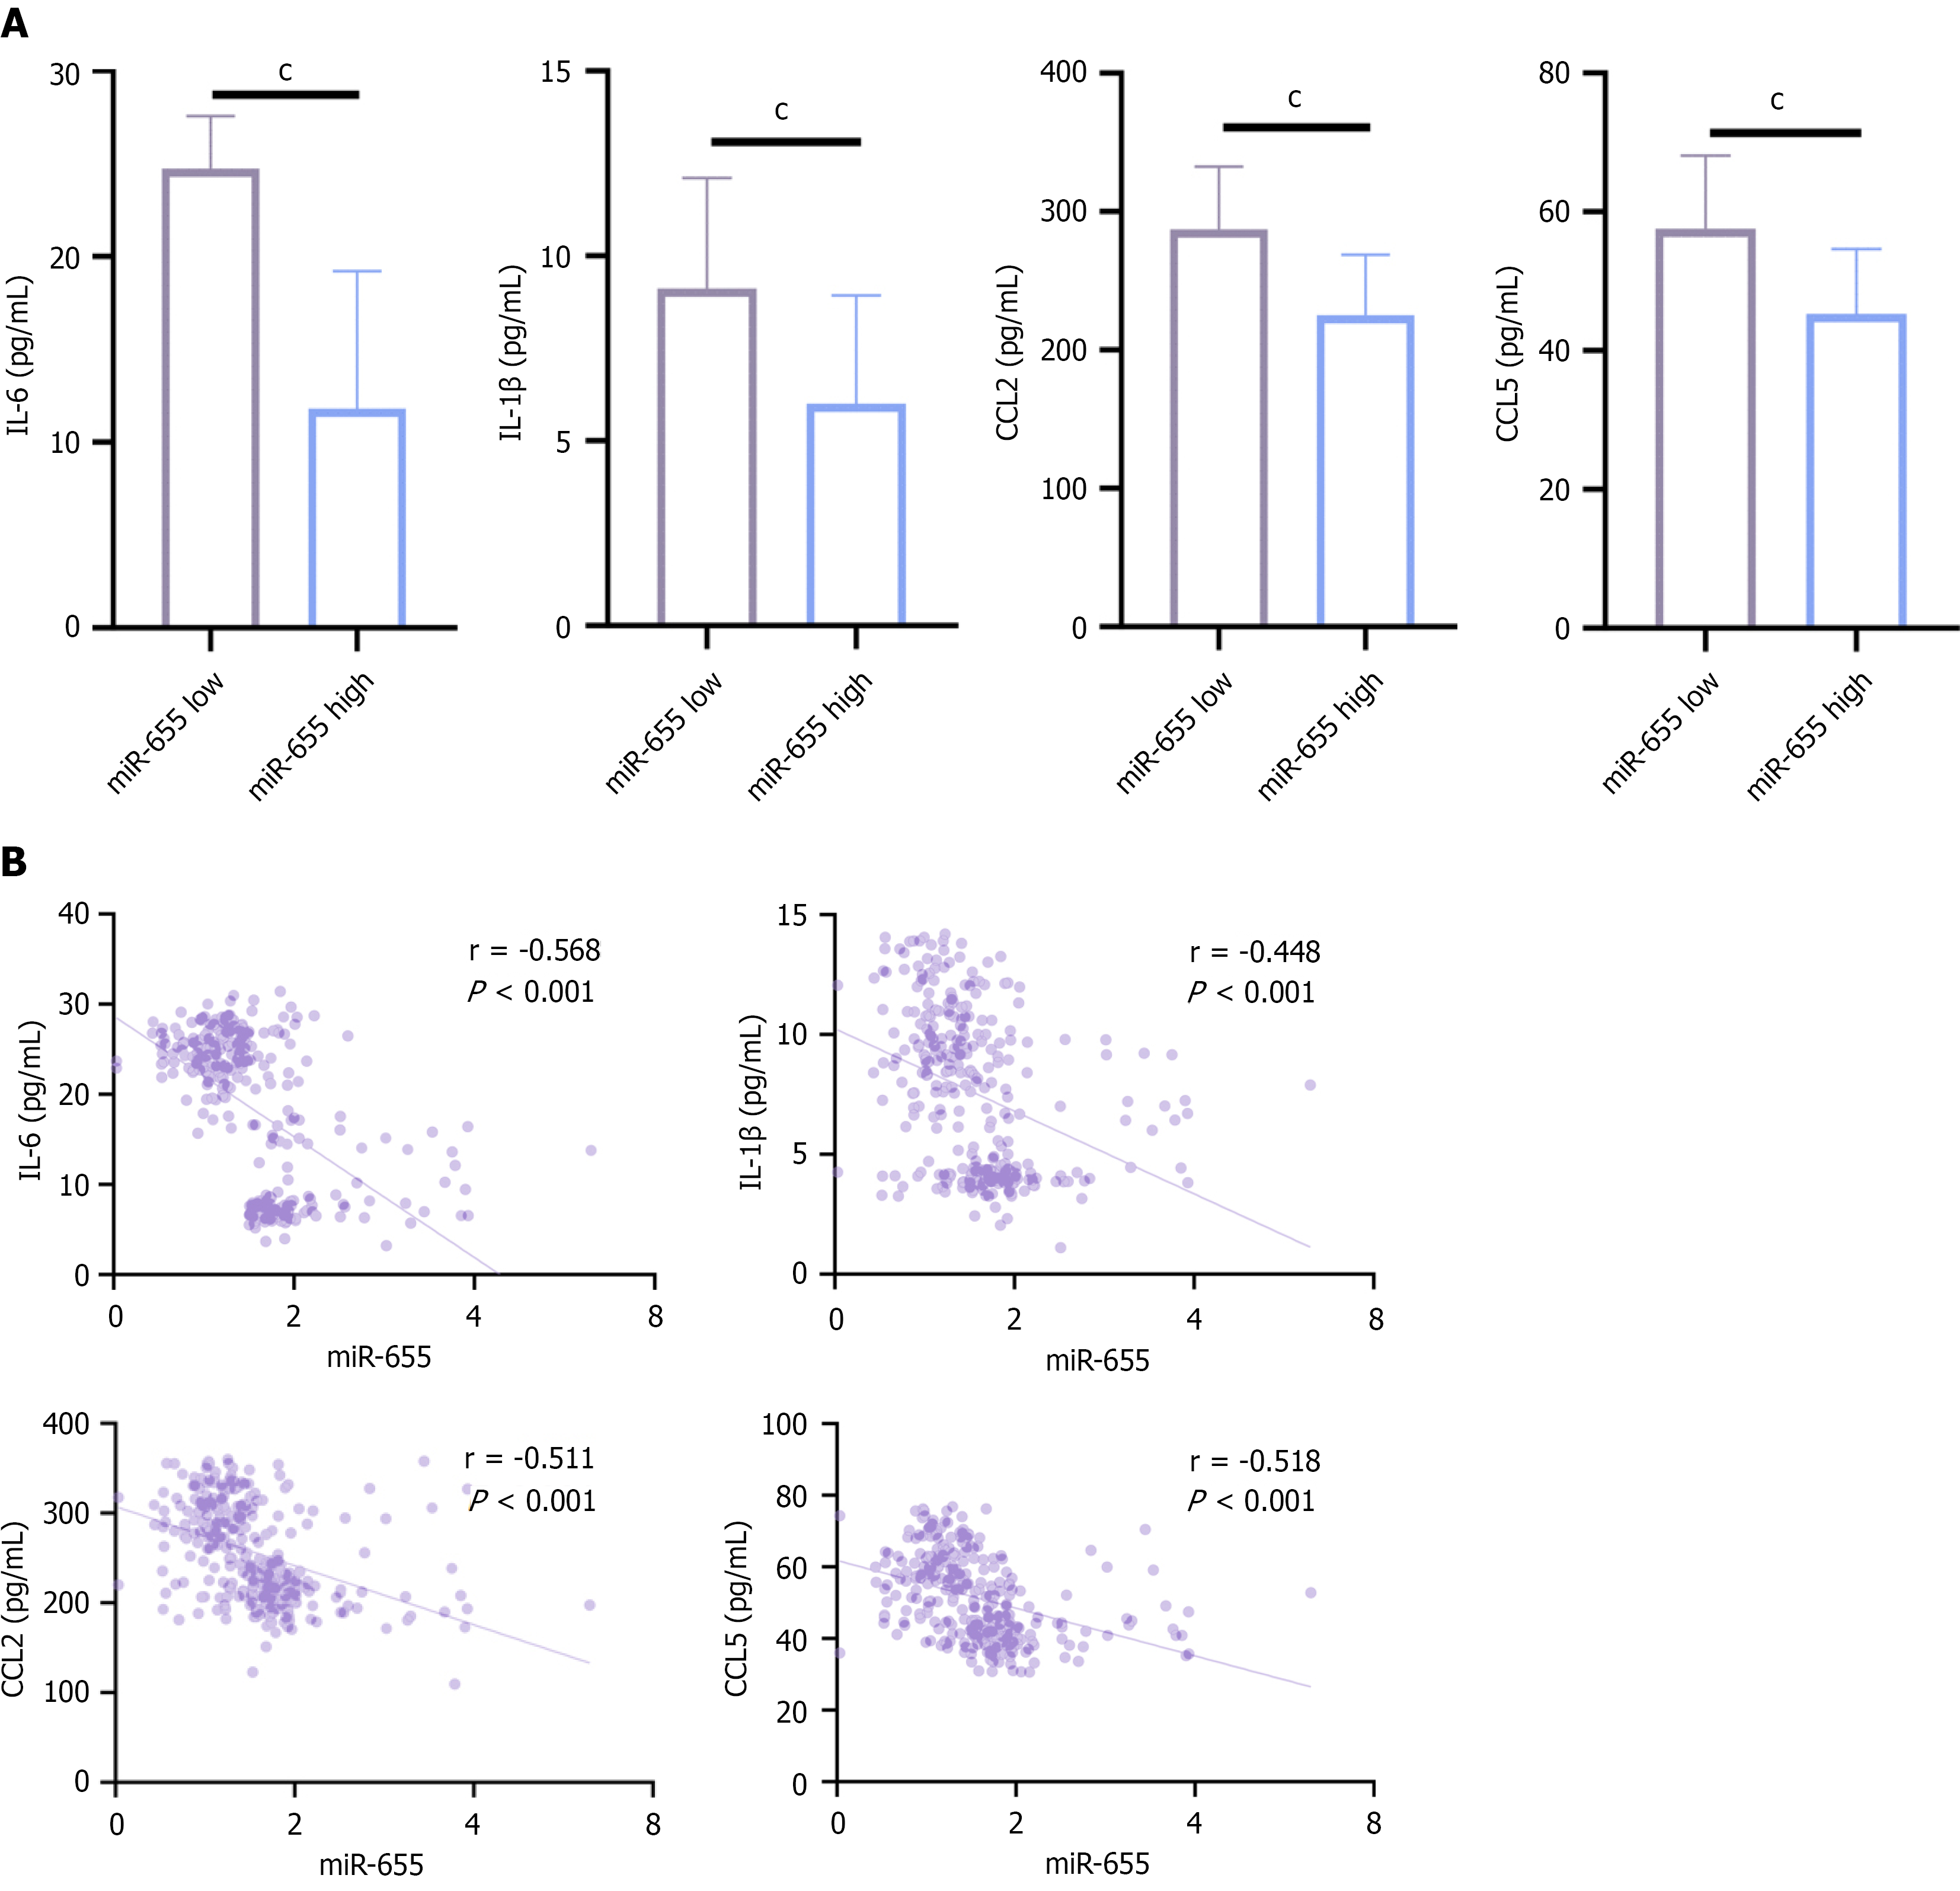
Figure 3 Correlation analysis of miR-655 expression with inflammatory factors.
A: Correlation analysis of miR-655 expression (low/high) with interleukin (IL)-6, IL-1β, CC-chemokine ligand 2 (CCL2) and CCL5; B: Correlation analysis of miR-655 with IL-6, IL-1β, CCL2 and CCL5. cP < 0.001. IL: Interleukin; CCL: CC-chemokine ligand.
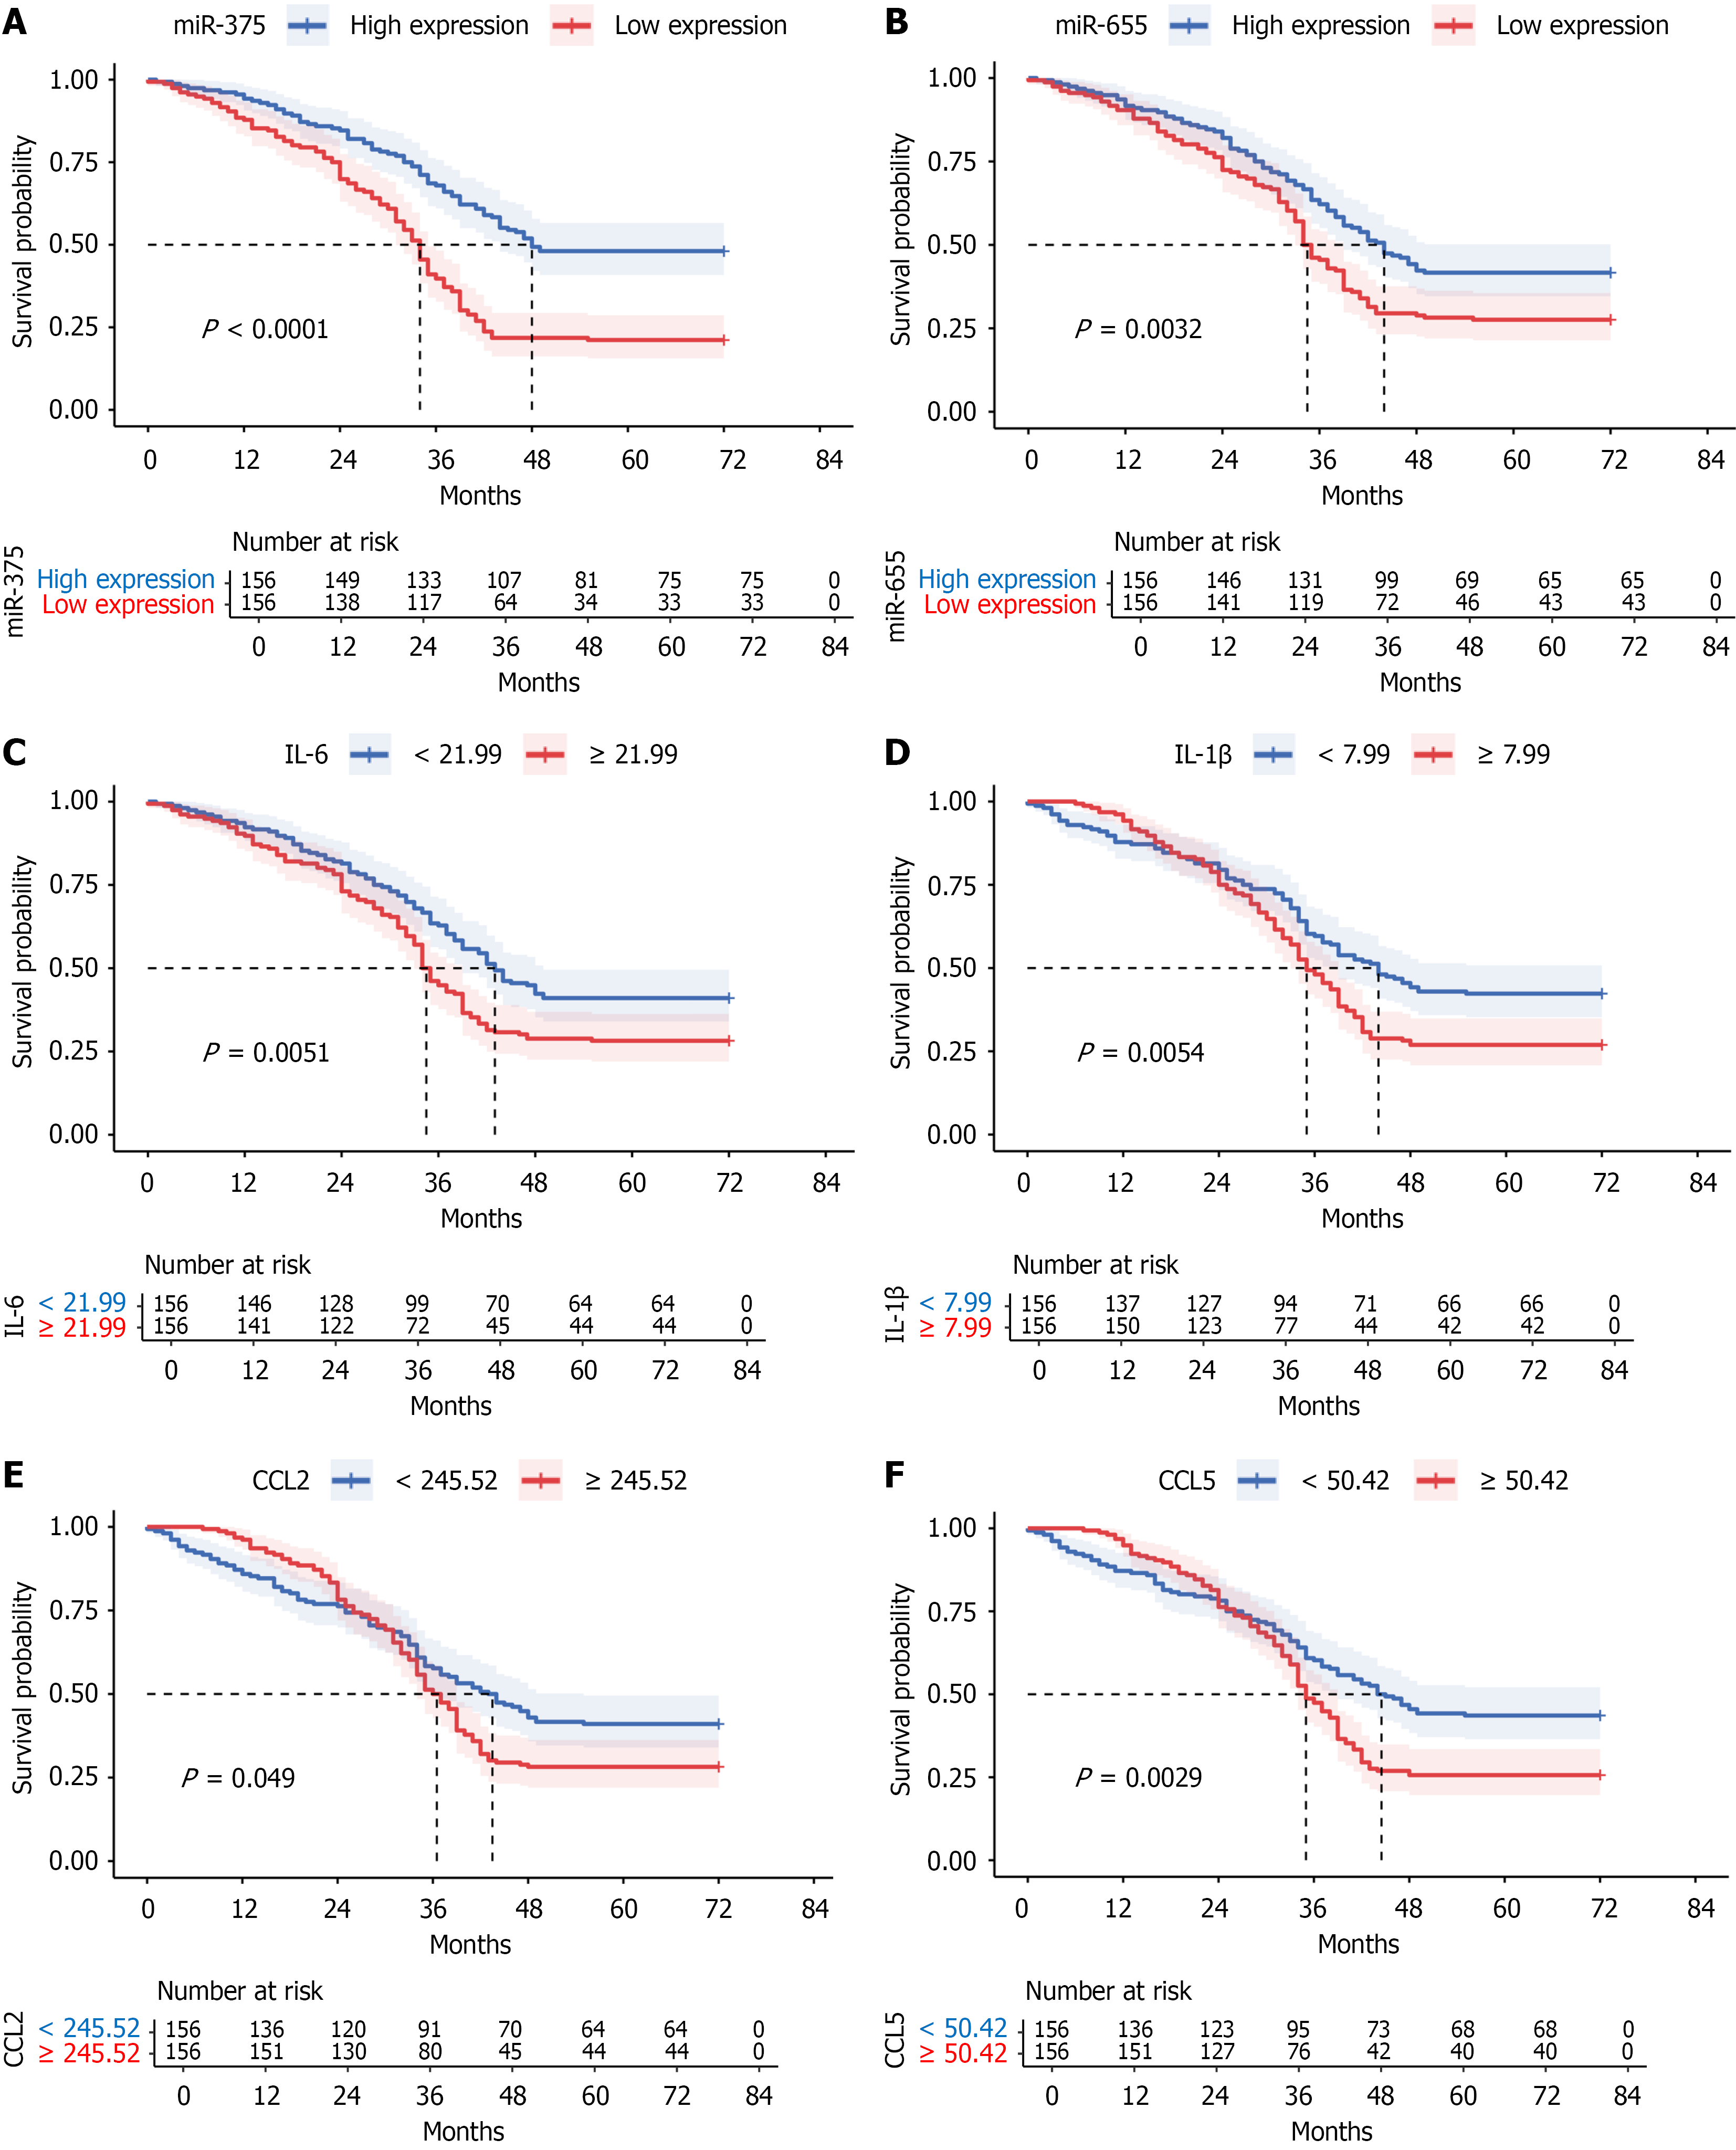
Figure 4 Kaplan-Meier analysis of overall survival according to two microRNAs and inflammatory factors.
A and B: Kaplan-Meier curves depict overall survival probabilities for patients stratified by miR-375 (A), and miR-655 (B); C-F: Kaplan-Meier curves depict overall survival probabilities for interleukin-6 levels using a cutoff of 21.99 (C), interleukin-1β levels using a cutoff of 7.99 (D), CC-chemokine ligand 2 using a cutoff of 245.52 (E), CC-chemokine ligand 5 using a cutoff of 50.42 (F). IL: Interleukin; CCL: CC-chemokine ligand.
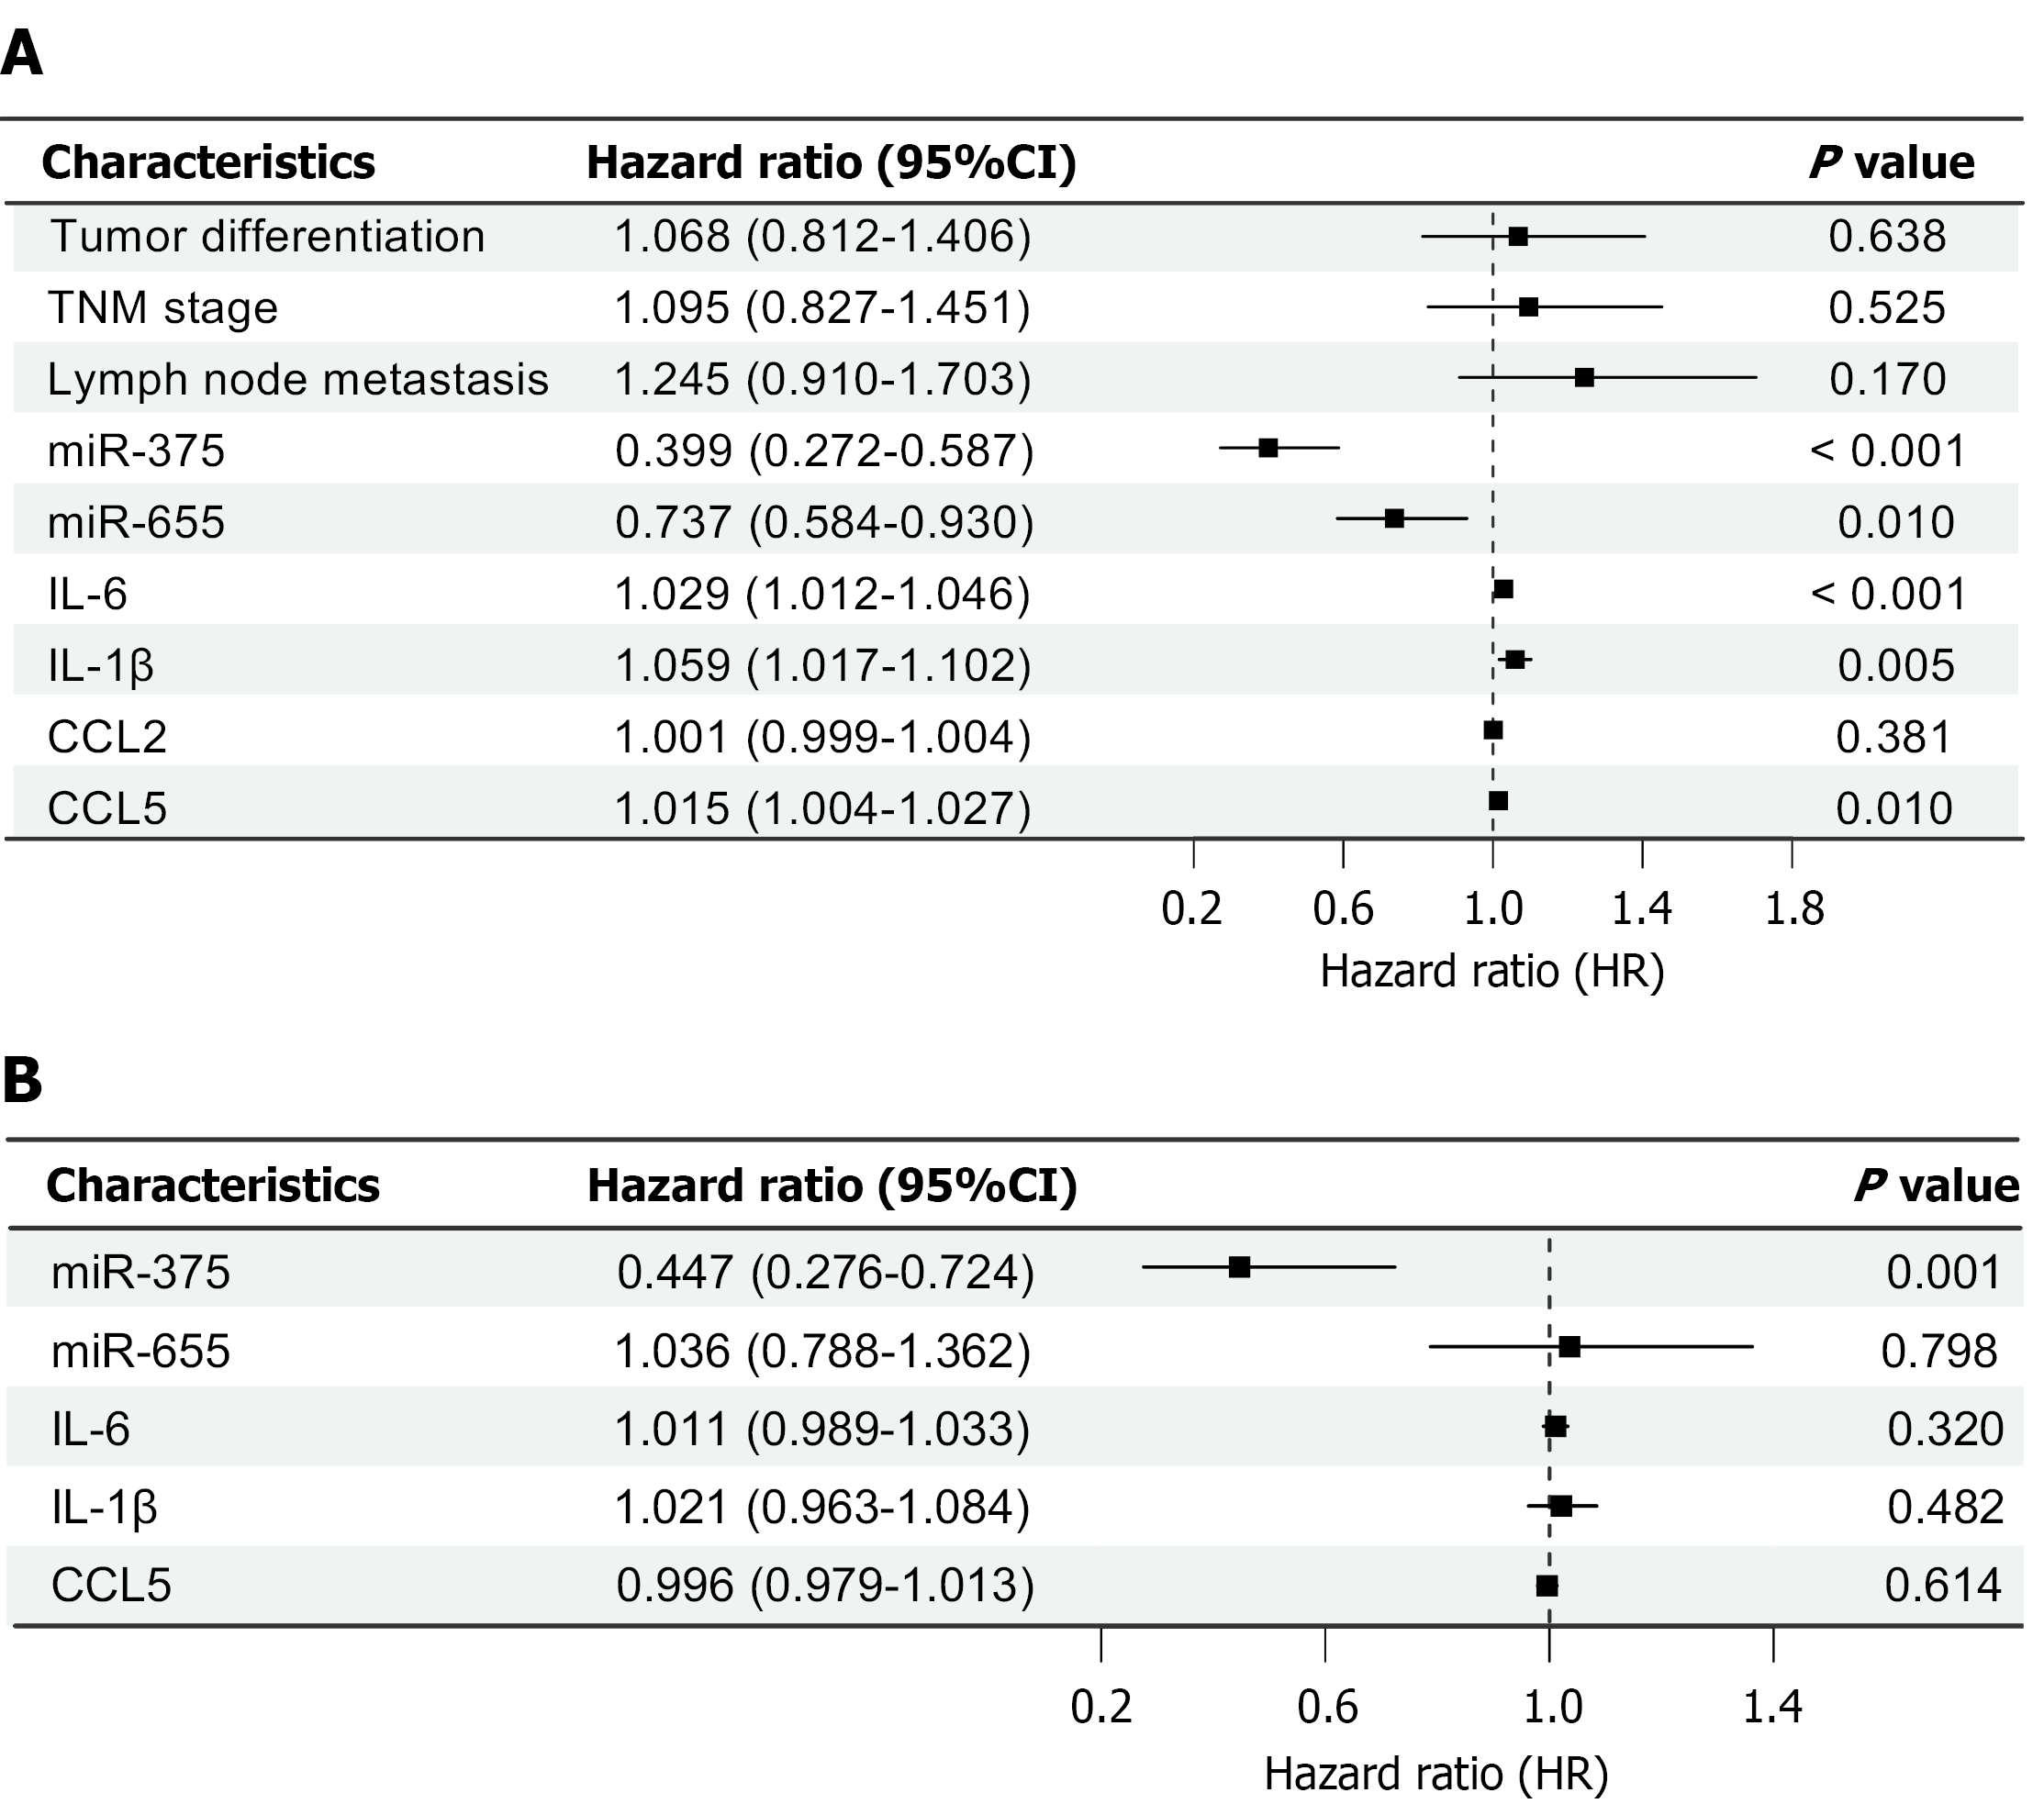
Figure 5 Univariate and multivariate Cox regression analysis for overall survival.
A: Forest plot of univariate Cox regression analysis for overall survival; B: Forest plot of multivariate Cox regression analysis for overall survival. TNM: Tumor node metastasis; CI: Confidence interval; IL: Interleukin; CCL: CC-chemokine ligand.
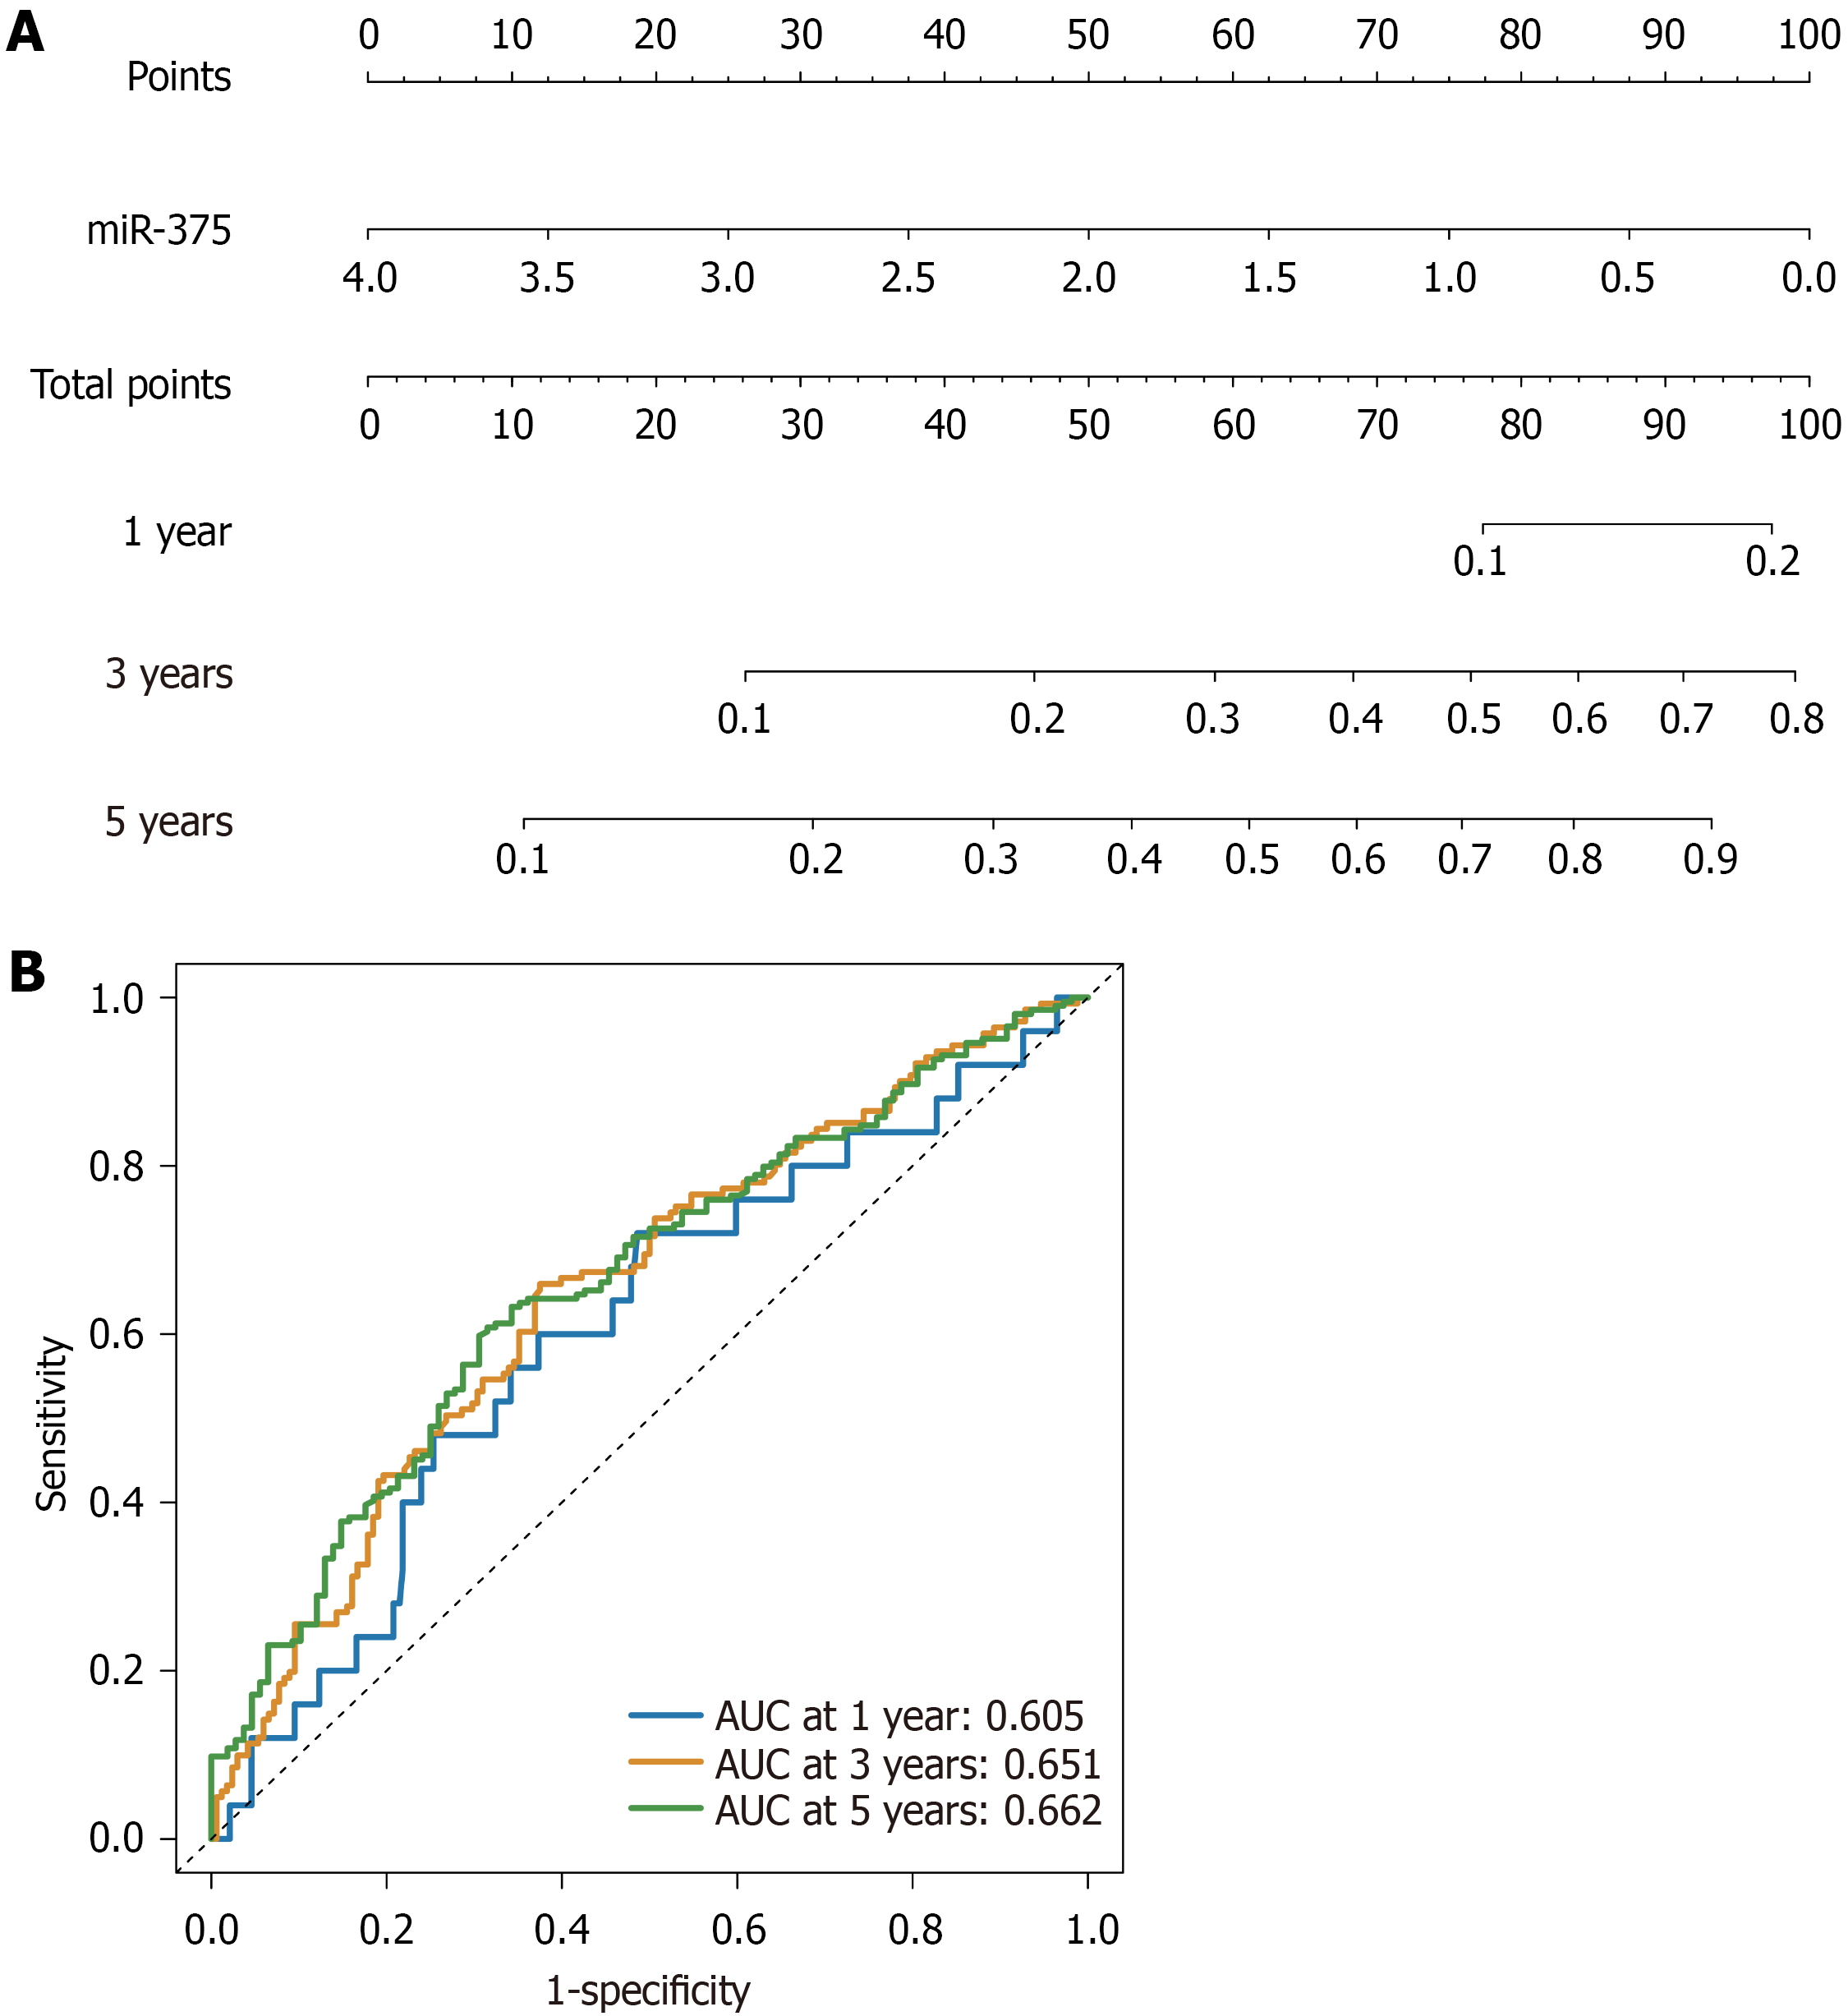
Figure 6 Multivariate Cox regression model for overall survival.
A: Nomogram of multivariate Cox regression analysis for progression-free survival; B: Receiver operating characteristic analysis of multivariate Cox regression analysis for progression-free survival with different time. AUC: Area under the curve.
- Citation: Wang JL, Niu YX, Li HX, Cui FC, Chen X. Clinical significance of mesenchymal stem cells exosomal microRNAs in predicting prognosis and inflammatory response of esophageal cancer. World J Stem Cells 2026; 18(7): 119714
- URL: https://www.wjgnet.com/1948-0210/full/v18/i7/119714.htm
- DOI: https://dx.doi.org/10.4252/wjsc.119714