
















Copyright: ©Author(s) 2026.
World J Stem Cells. Jul 26, 2026; 18(7): 119260
Published online Jul 26, 2026. doi: 10.4252/wjsc.119260
Published online Jul 26, 2026. doi: 10.4252/wjsc.119260
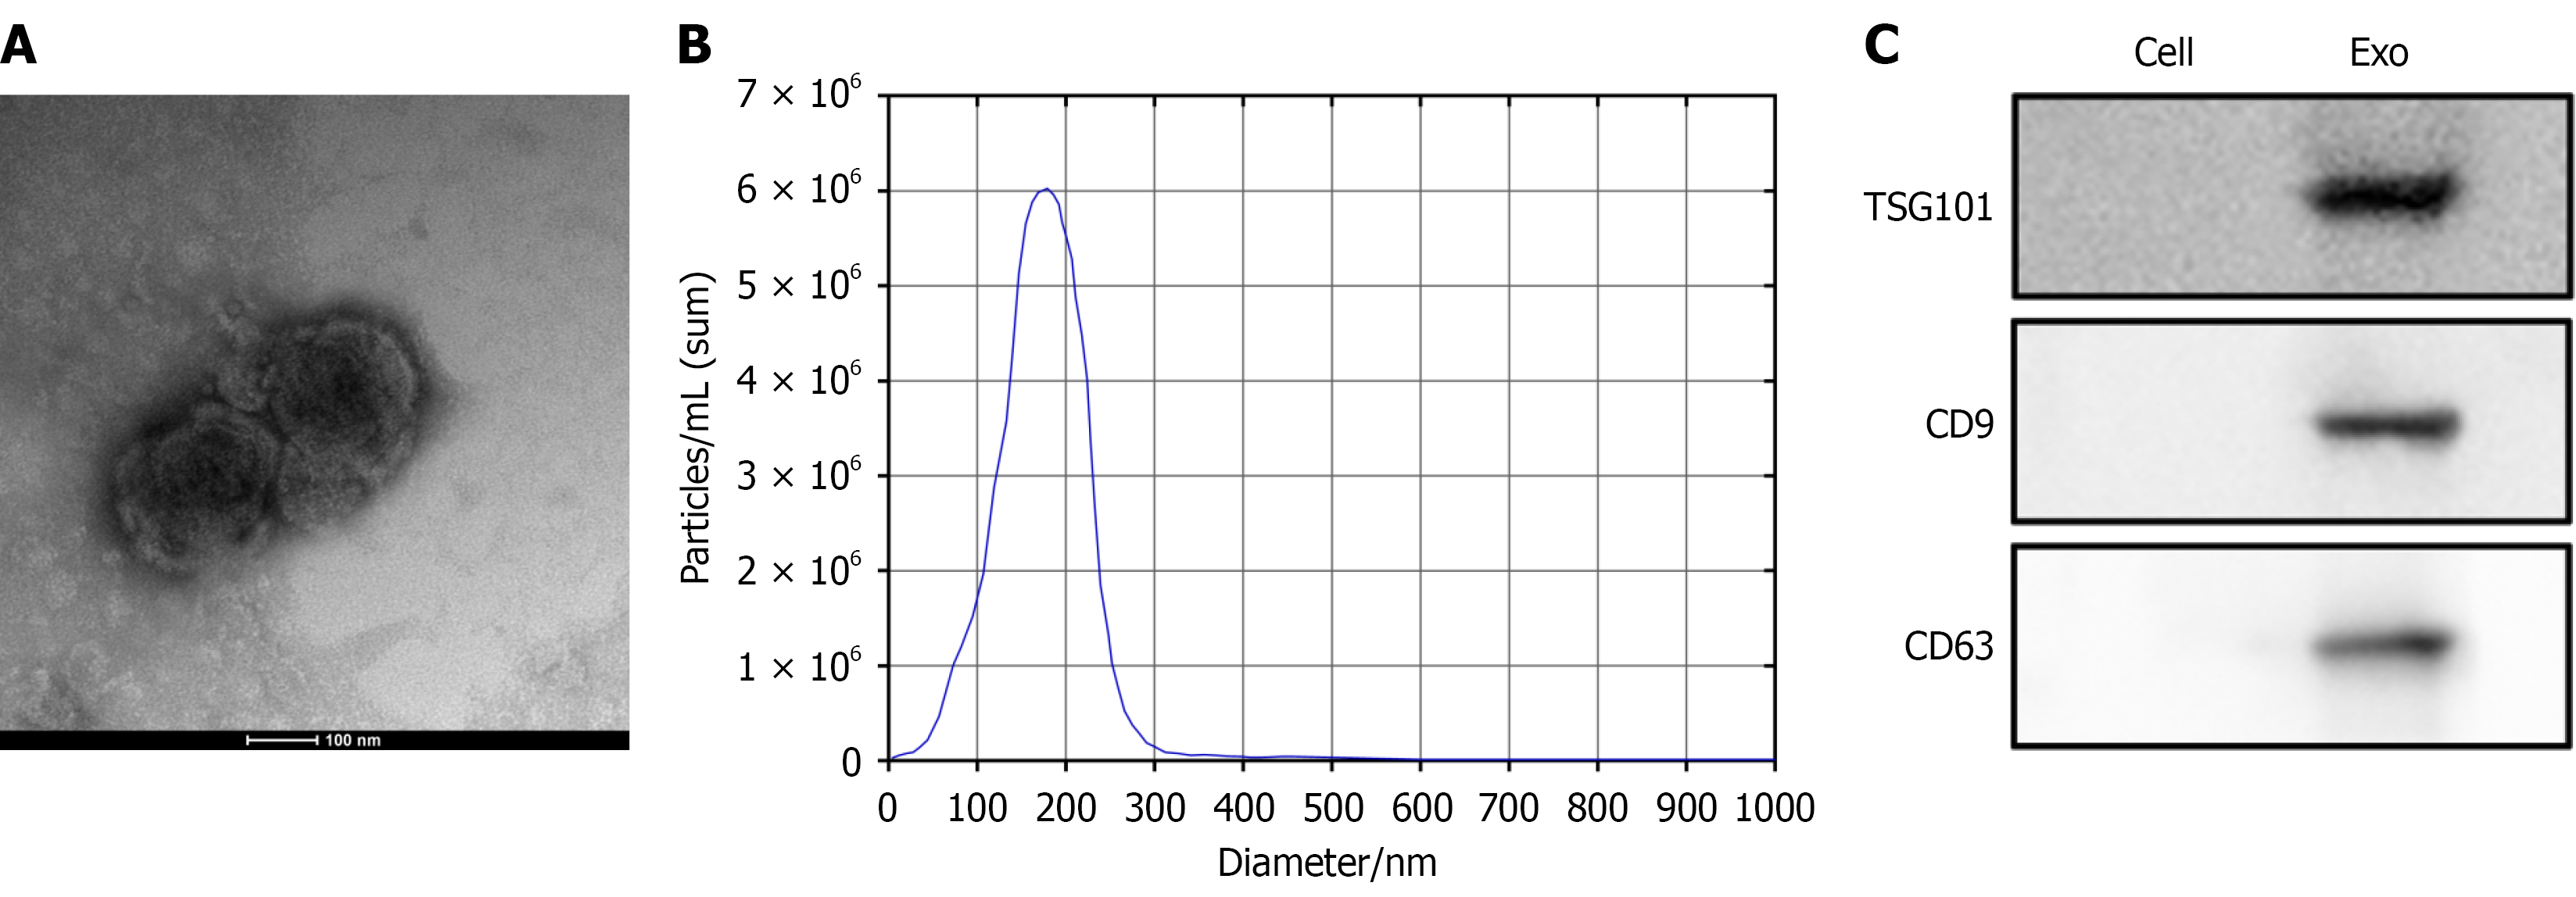
Figure 1 Characterization of mesenchymal stem cell-derived exosomes.
A: Morphology of exosomes under transmission electron microscopy; B: Nanoparticle tracking analysis of exosomes revealed that exosomes size ranges (50-200 nm); C: Western blot analysis of exosomal proteins including tumor susceptibility gene 101, CD9, and CD63. Exo: Exosome; TSG101: Tumor susceptibility gene 101.
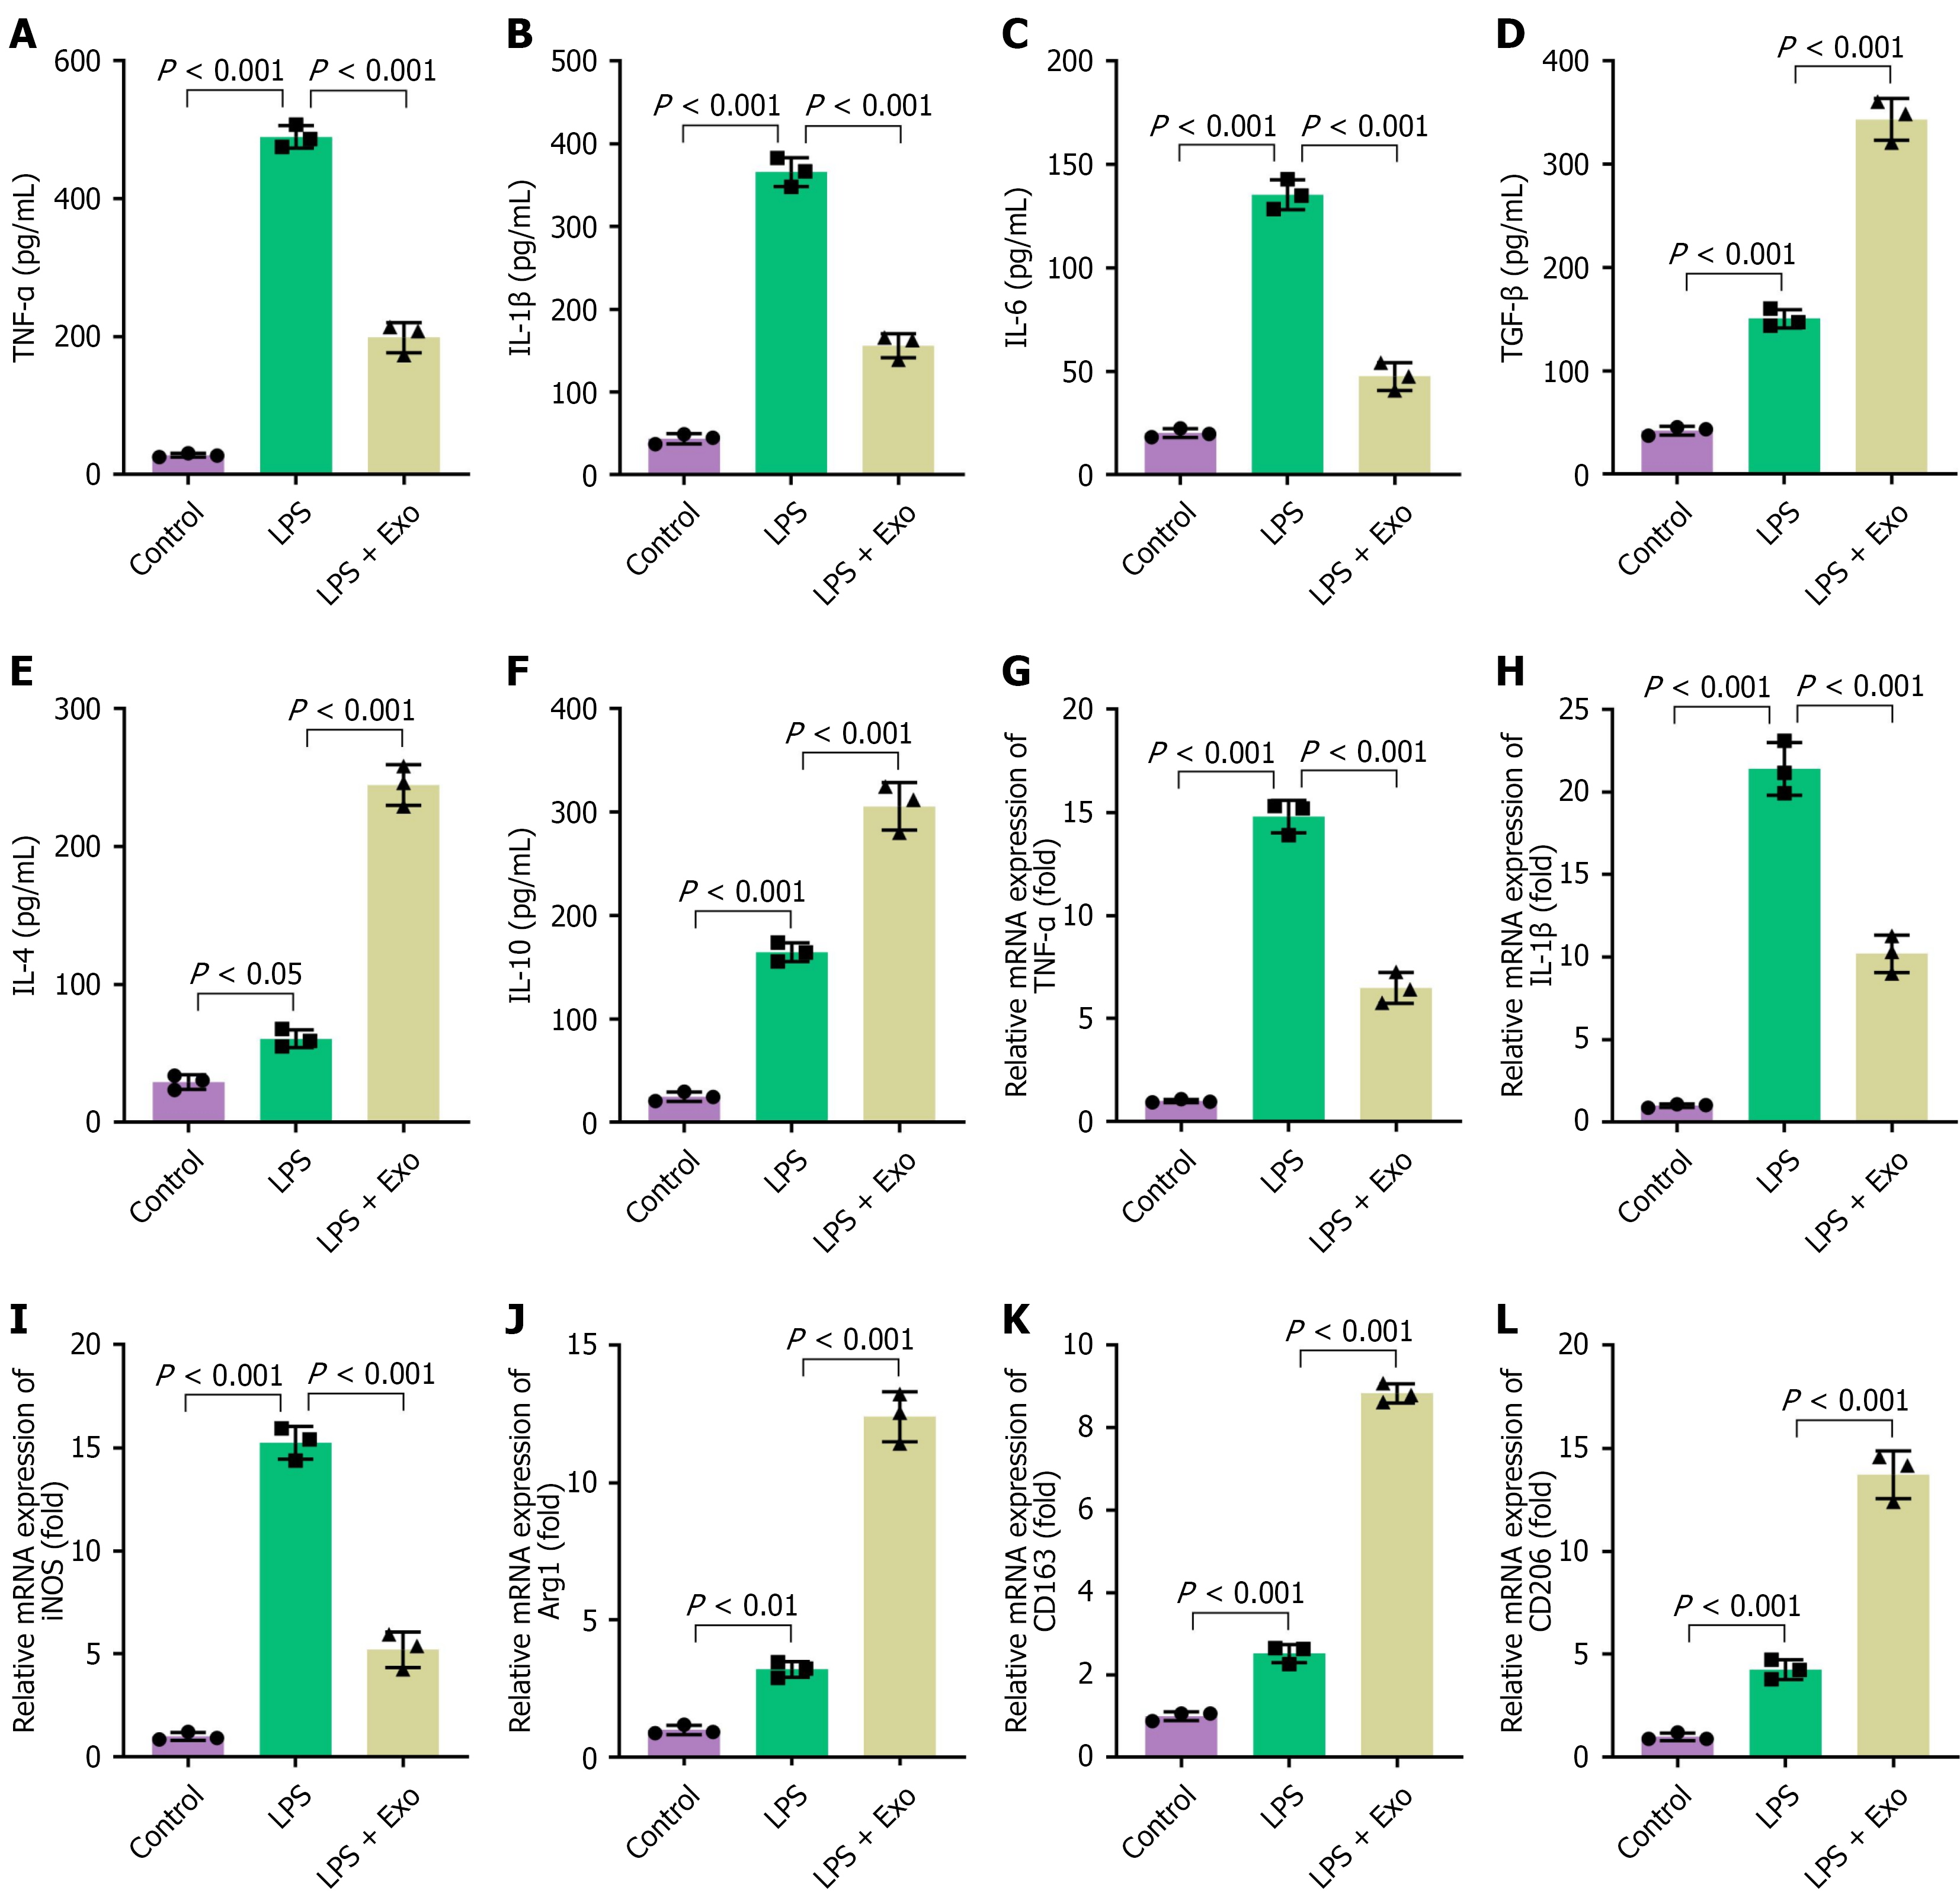
Figure 2 Exosomes modulate microglial polarization by attenuating the pro-inflammatory M1 phenotype and enhancing the anti-inflammatory M2 phenotype in vitro.
Primary microglia were stimulated with lipopolysaccharide for 24 hours and then treated with or without exosomes. A-F: The concentrations of cytokines in the culture supernatants were measured by enzyme-linked immunosorbent assay; pro-inflammatory cytokines tumor necrosis factor-alpha (A), interleukin (IL)-1β (B), and IL-6 (C); anti-inflammatory cytokines transforming growth factor-beta (D), IL-4 (E), and IL-10 (F); G-L: The mRNA expression levels of microglial polarization markers were analyzed by reverse transcription and quantitative polymerase chain reaction. M1 phenotype-related genes tumor necrosis factor-alpha (G), IL-1β (H), and inducible nitric oxide synthase (I); M2 phenotype-related genes arginase1 (J), CD163 (K), and CD206 (L). Data are presented as mean ± SD. LPS: Lipopolysaccharide; Exo: Exosome; TNF-α: Tumor necrosis factor-alpha; IL: Interleukin; TGF-β: Transforming growth factor-beta; iNOS: Inducible nitric oxide synthase; Arg1: Arginase1.
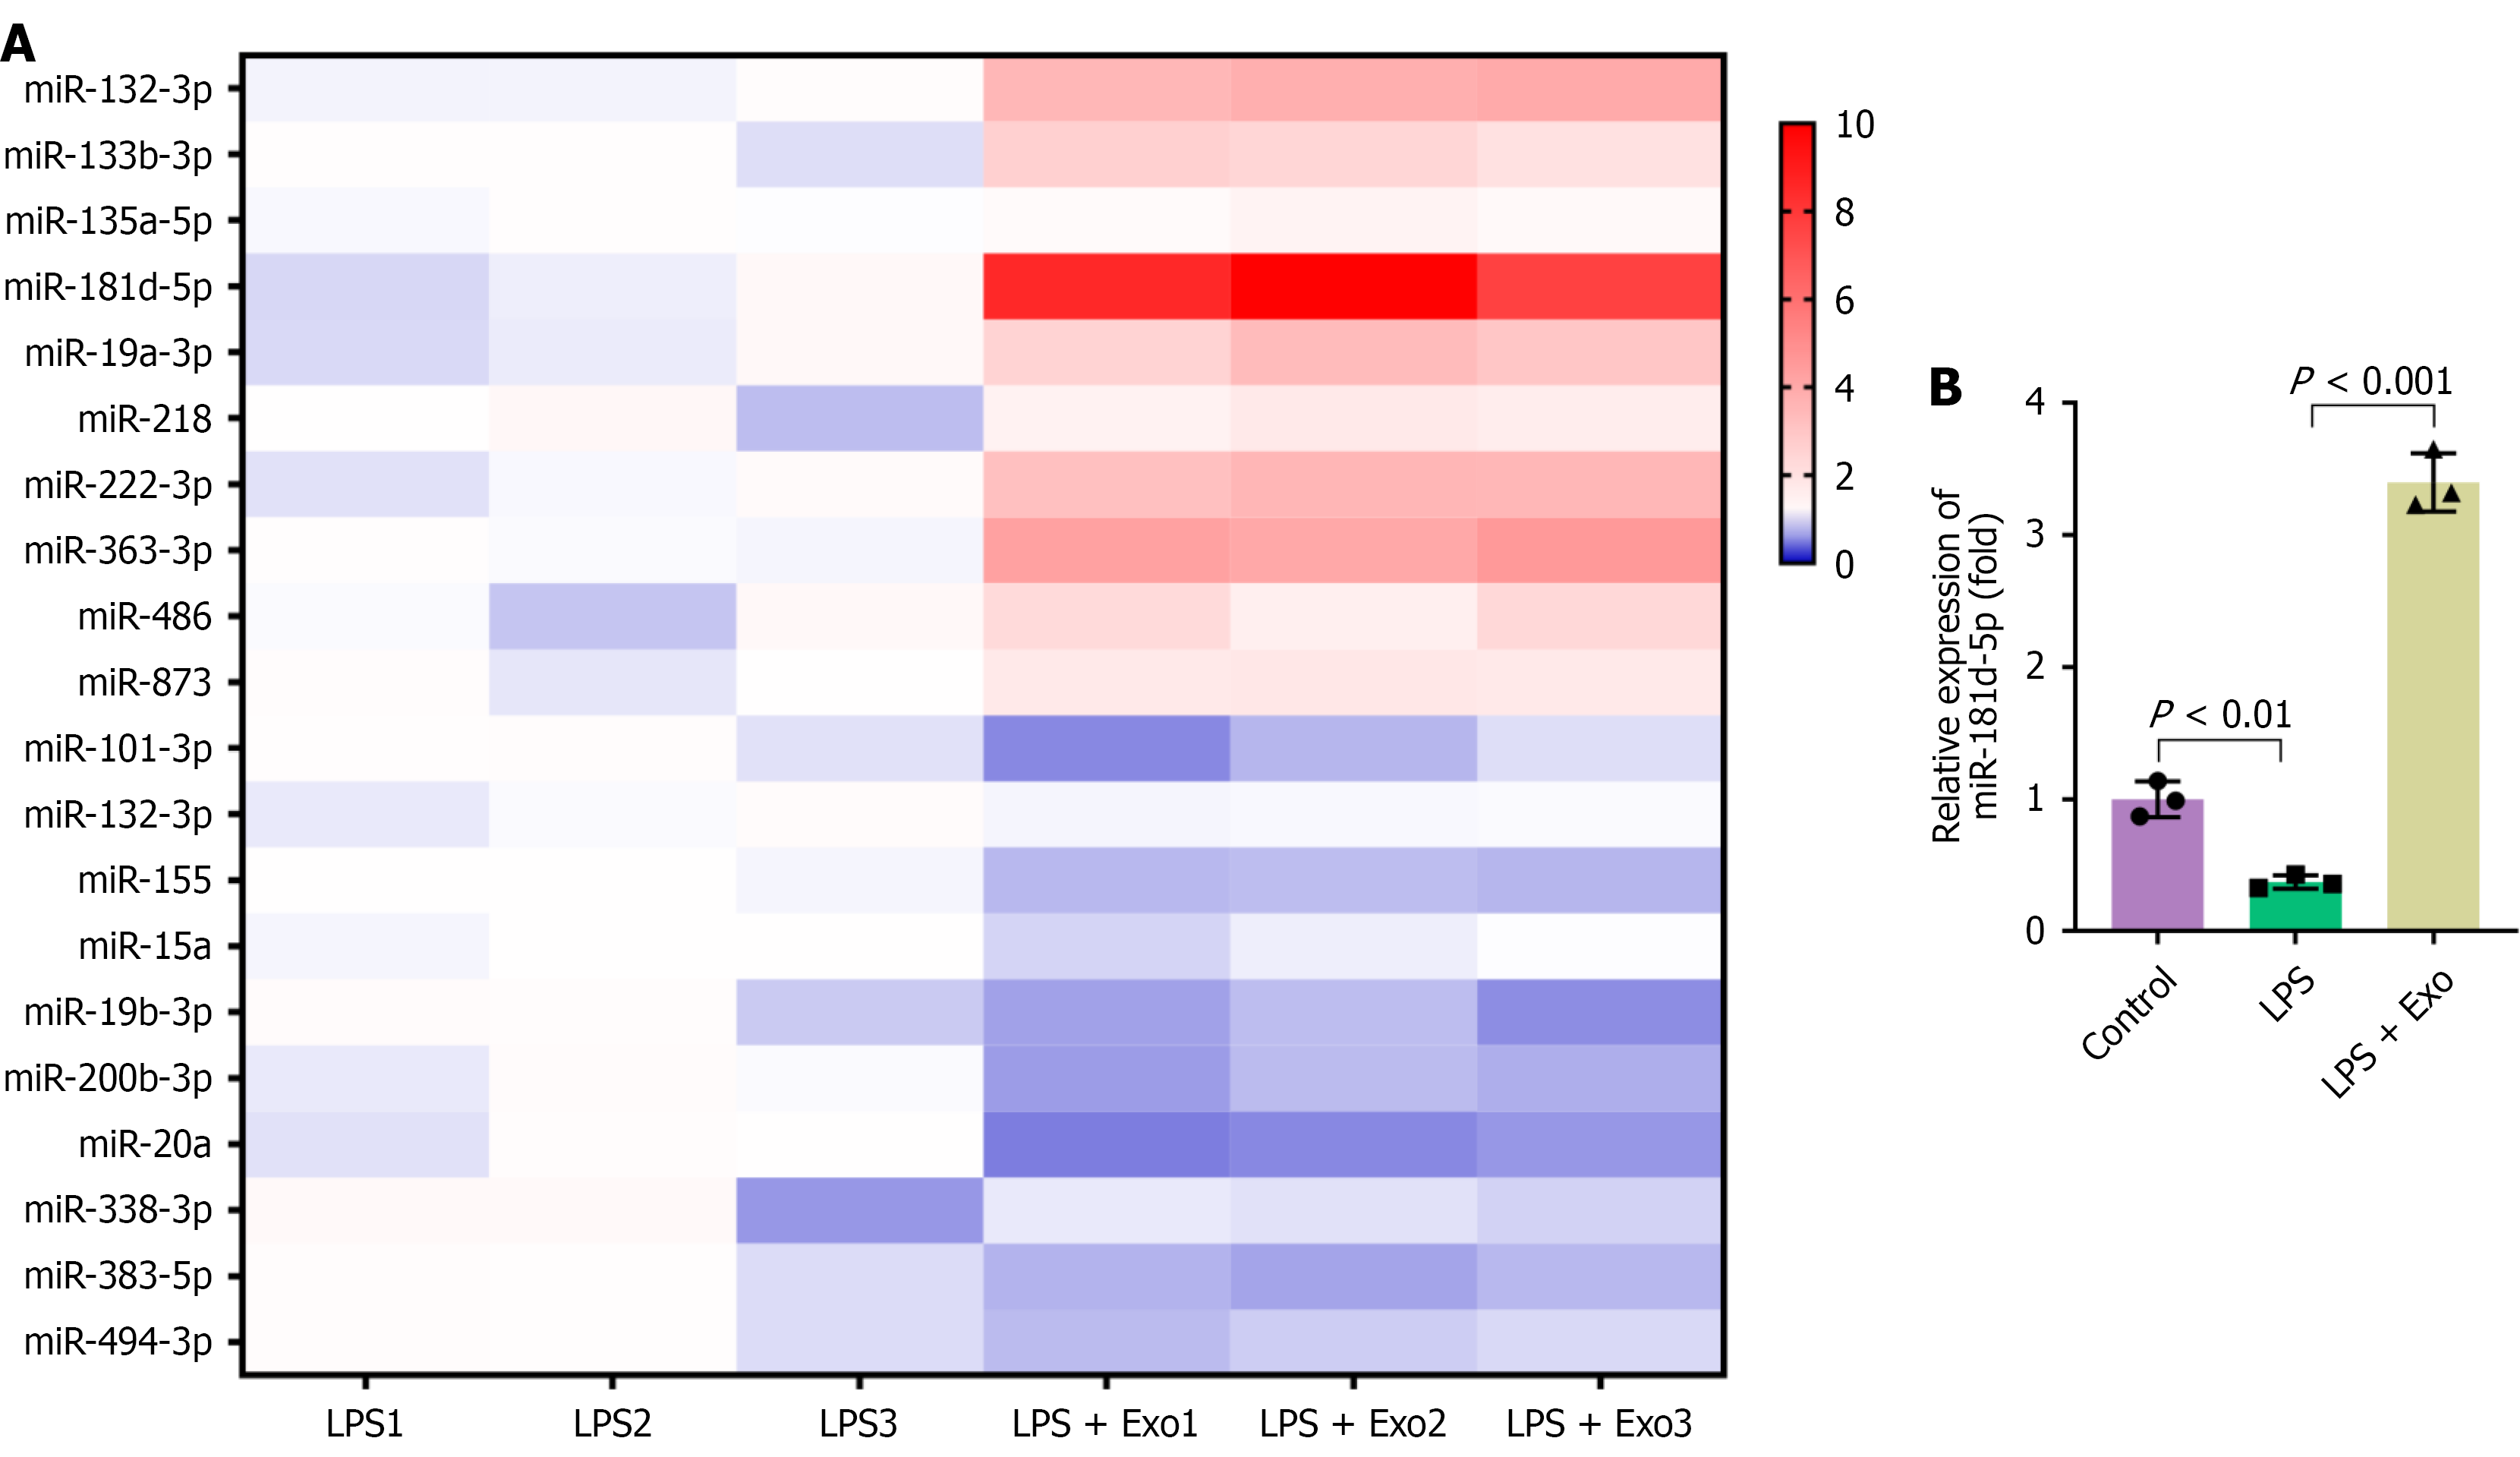
Figure 3 Identification of miR-181d-5p as a key regulator in exosome-mediated effects.
A: MicroRNA expression profiles in primary microglia from different treatment groups were analyzed by polymerase chain reaction array and presented as a heatmap; B: The expression level of miR-181d-5p in microglia under different treatments was determined by reverse transcription and quantitative polymerase chain reaction. Data are presented as mean ± SD. LPS: Lipopolysaccharide; Exo: Exosome.
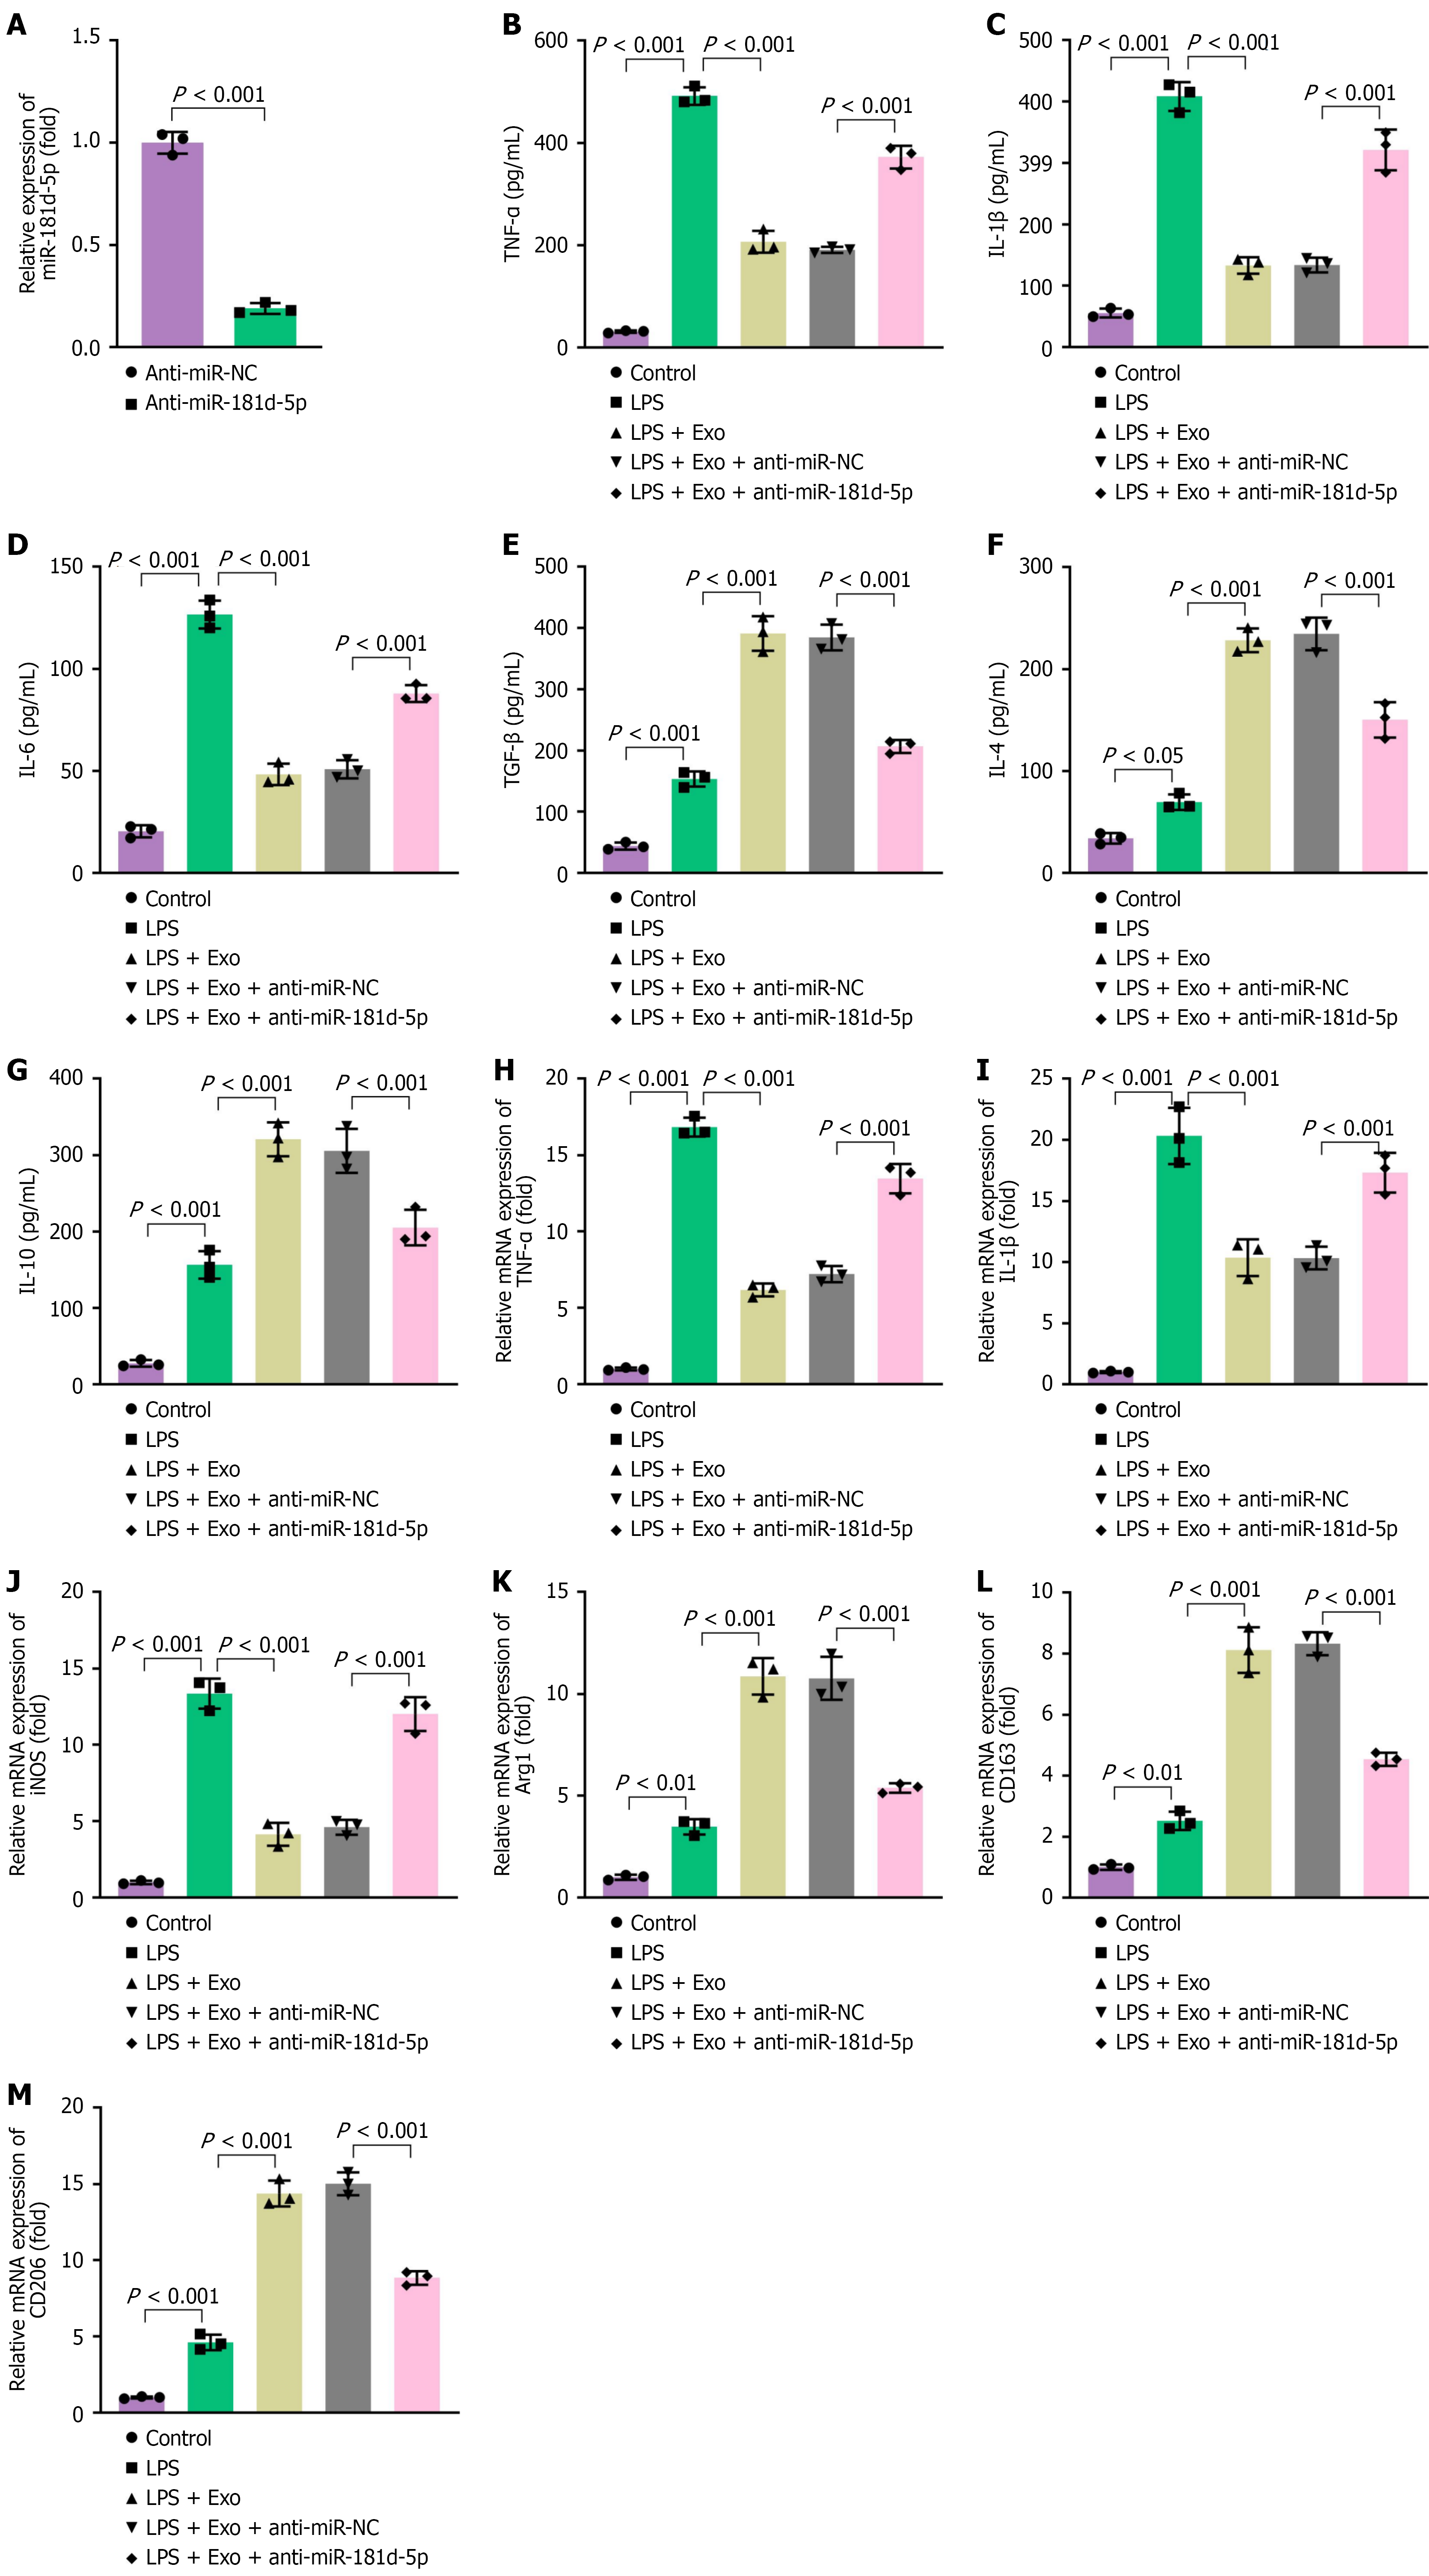
Figure 4 The knockdown of miR-181d-5p reverses the modulatory effects of exosomes.
A: The expression level of miR-181d-5p in microglia after miR-181d-5p knockdown was measured by reverse transcription and quantitative polymerase chain reaction; B-G: The concentrations of cytokines in the culture supernatants were measured by enzyme-linked immunosorbent assay; pro-inflammatory cytokines tumor necrosis factor-alpha (B), interleukin (IL)-1β (C), and IL-6 (D); anti-inflammatory cytokines transforming growth factor-beta (E), IL-4 (F), and IL-10 (G); H-M: The mRNA expression levels of microglial polarization markers were analyzed by reverse transcription and quantitative polymerase chain reaction; M1 phenotype-related genes tumor necrosis factor-alpha (H), IL-1β (I), and inducible nitric oxide synthase (J); M2 phenotype-related genes arginase1 (K), CD163 (L), and CD206 (M). Data are presented as mean ± SD. LPS: Lipopolysaccharide; Exo: Exosome; TNF-α: Tumor necrosis factor-alpha; IL: Interleukin; TGF-β: Transforming growth factor-beta; iNOS: Inducible nitric oxide synthase; Arg1: Arginase1.
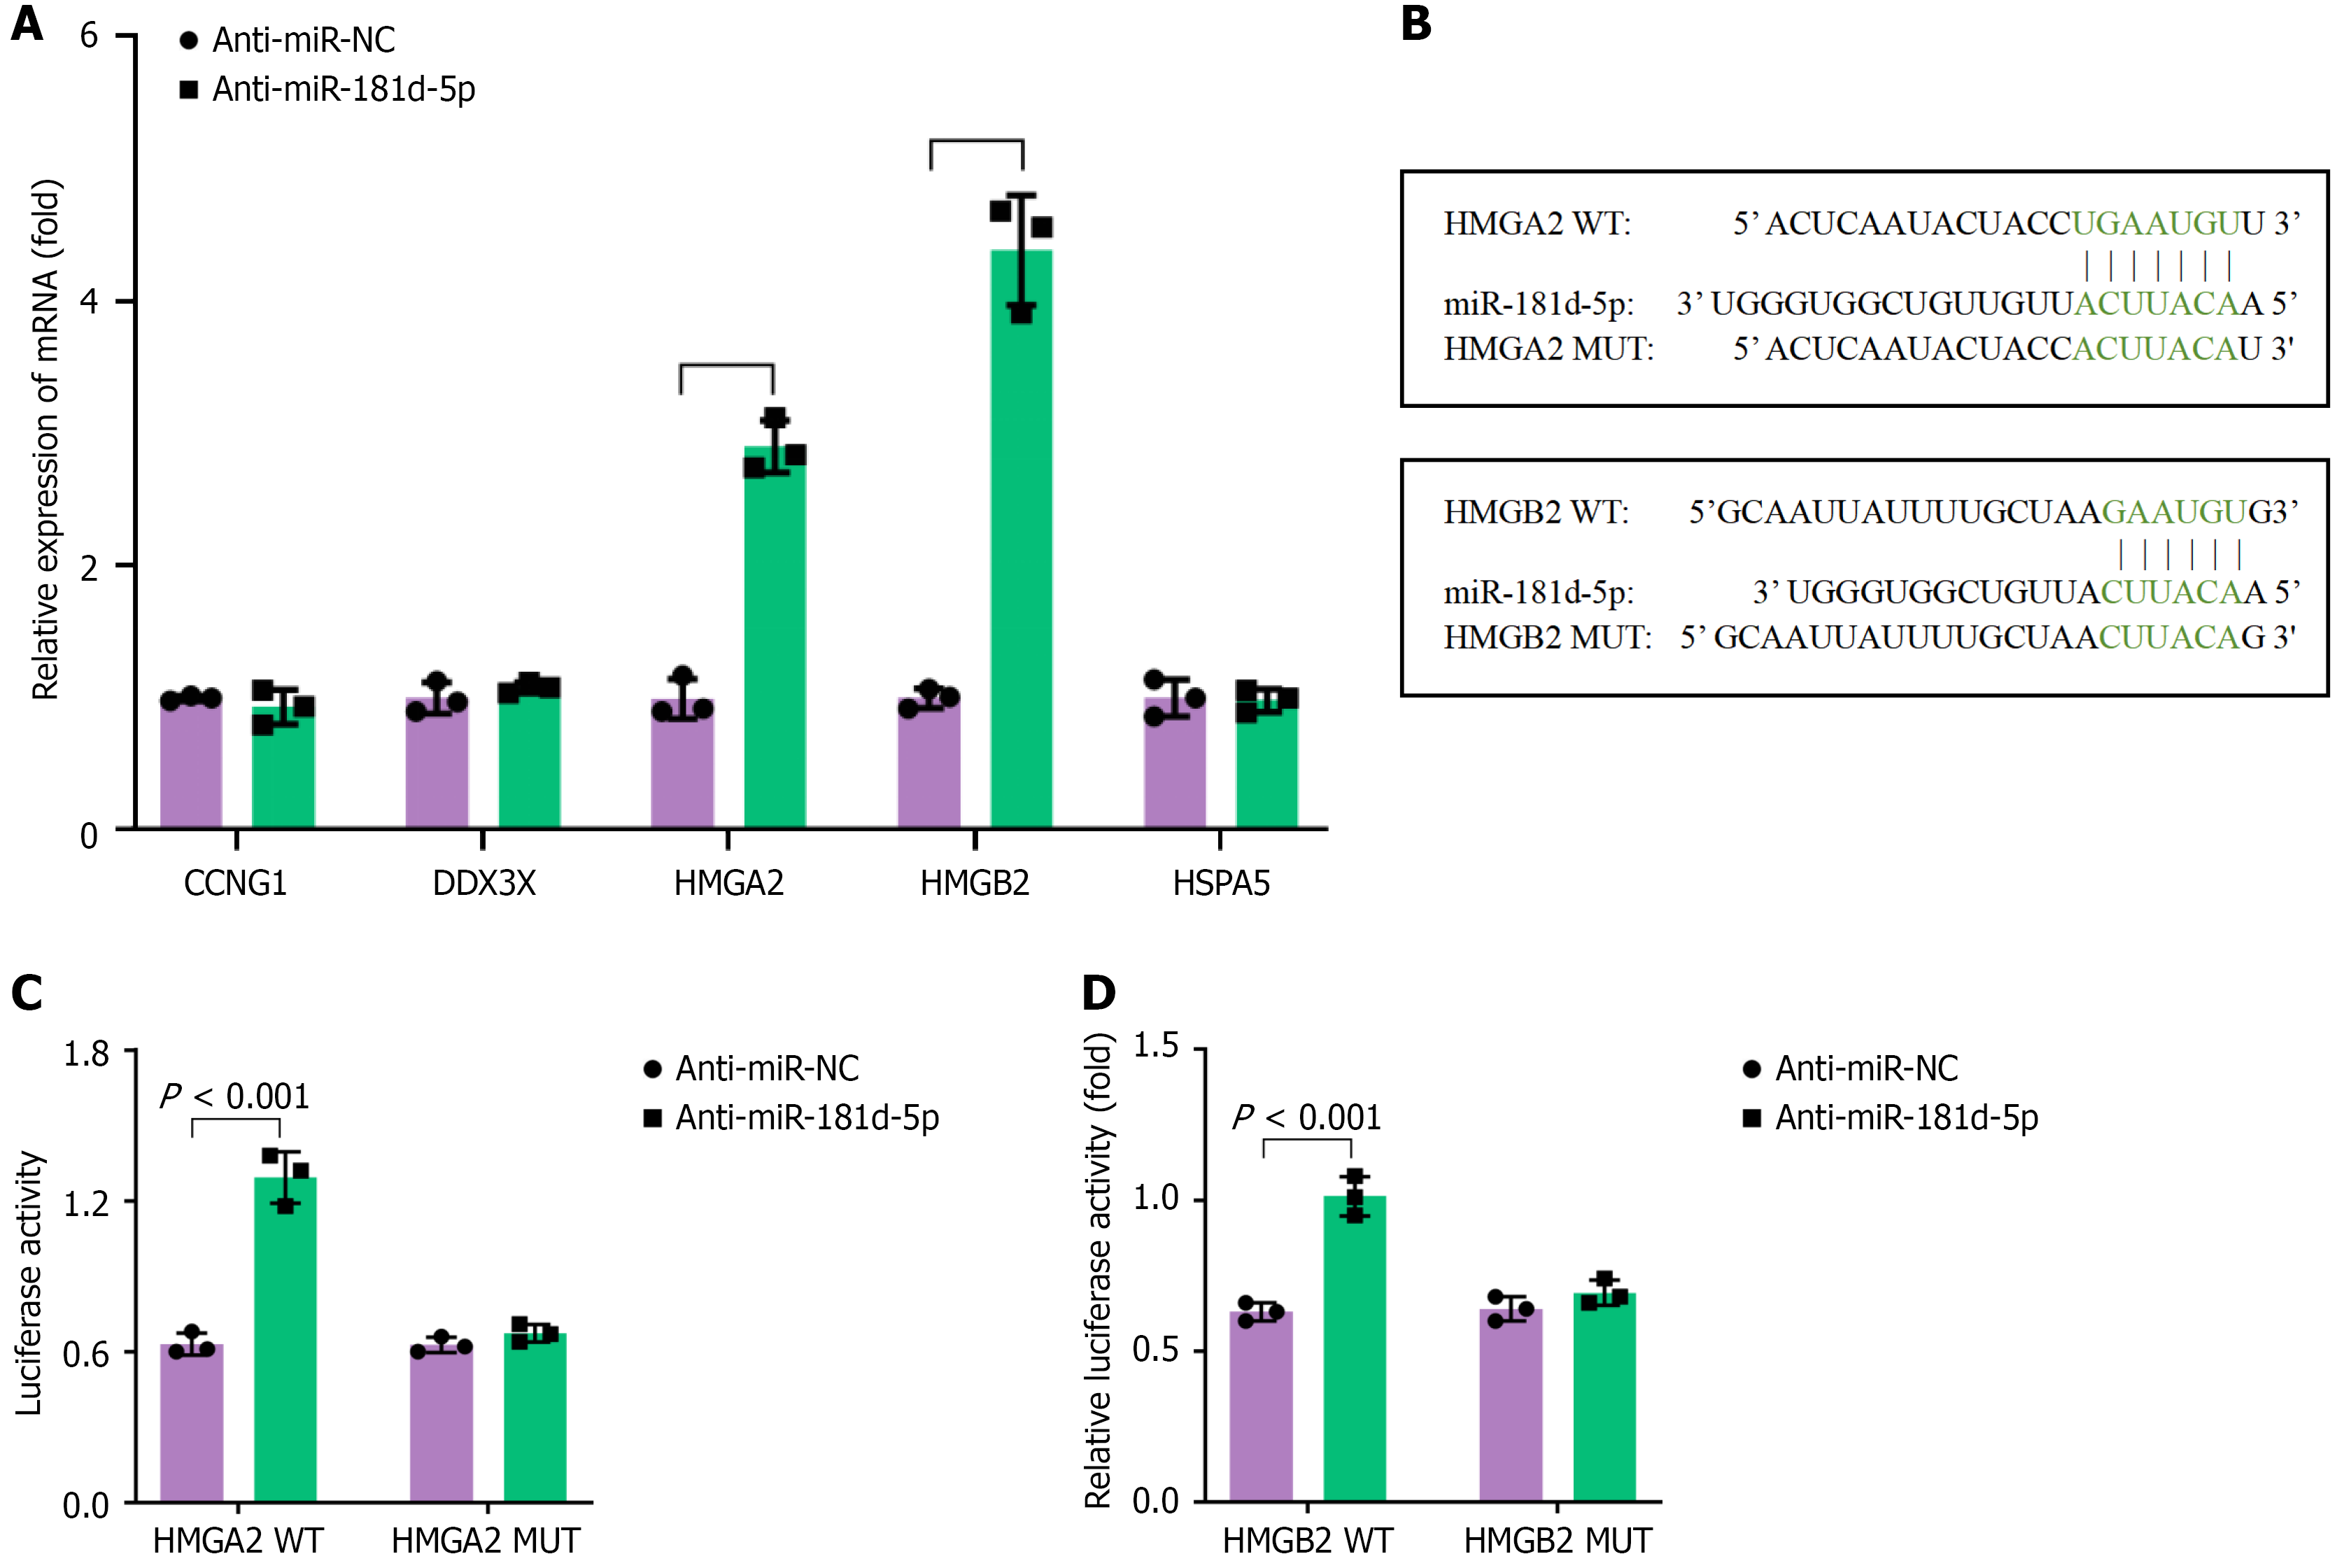
Figure 5 miR-181d-5p directly targets HMGA2 and HMGB2.
A: The mRNA expression levels of candidate target genes (cyclin G1, DEAD-Box Helicase 3 X-linked, HMGA2, HMGB2, heat shock protein family A member 5) in microglia after miR-181d-5p knockdown (anti-miR-181d-5p) were measured by reverse transcription and quantitative polymerase chain reaction; B: The predicted binding sites of miR-181d-5p within the wild-type 3’ untranslated regions (UTRs) of HMGA2 and HMGB2, and the designed mutant 3’UTR sequences are shown; C: Luciferase reporter assay was performed to verify the direct binding of miR-181d-5p to the HMGA2 3’UTR; D: Luciferase reporter assay was performed to verify the direct binding of miR-181d-5p to the HMGB2 3’UTR. Data are presented as mean ± SD. CCNG1: Cyclin G1; DDX3X: DEAD-Box Helicase 3 X-linked; HSPA5: Heat shock protein family A member 5; WT: Wild-type; MUT: Mutant.
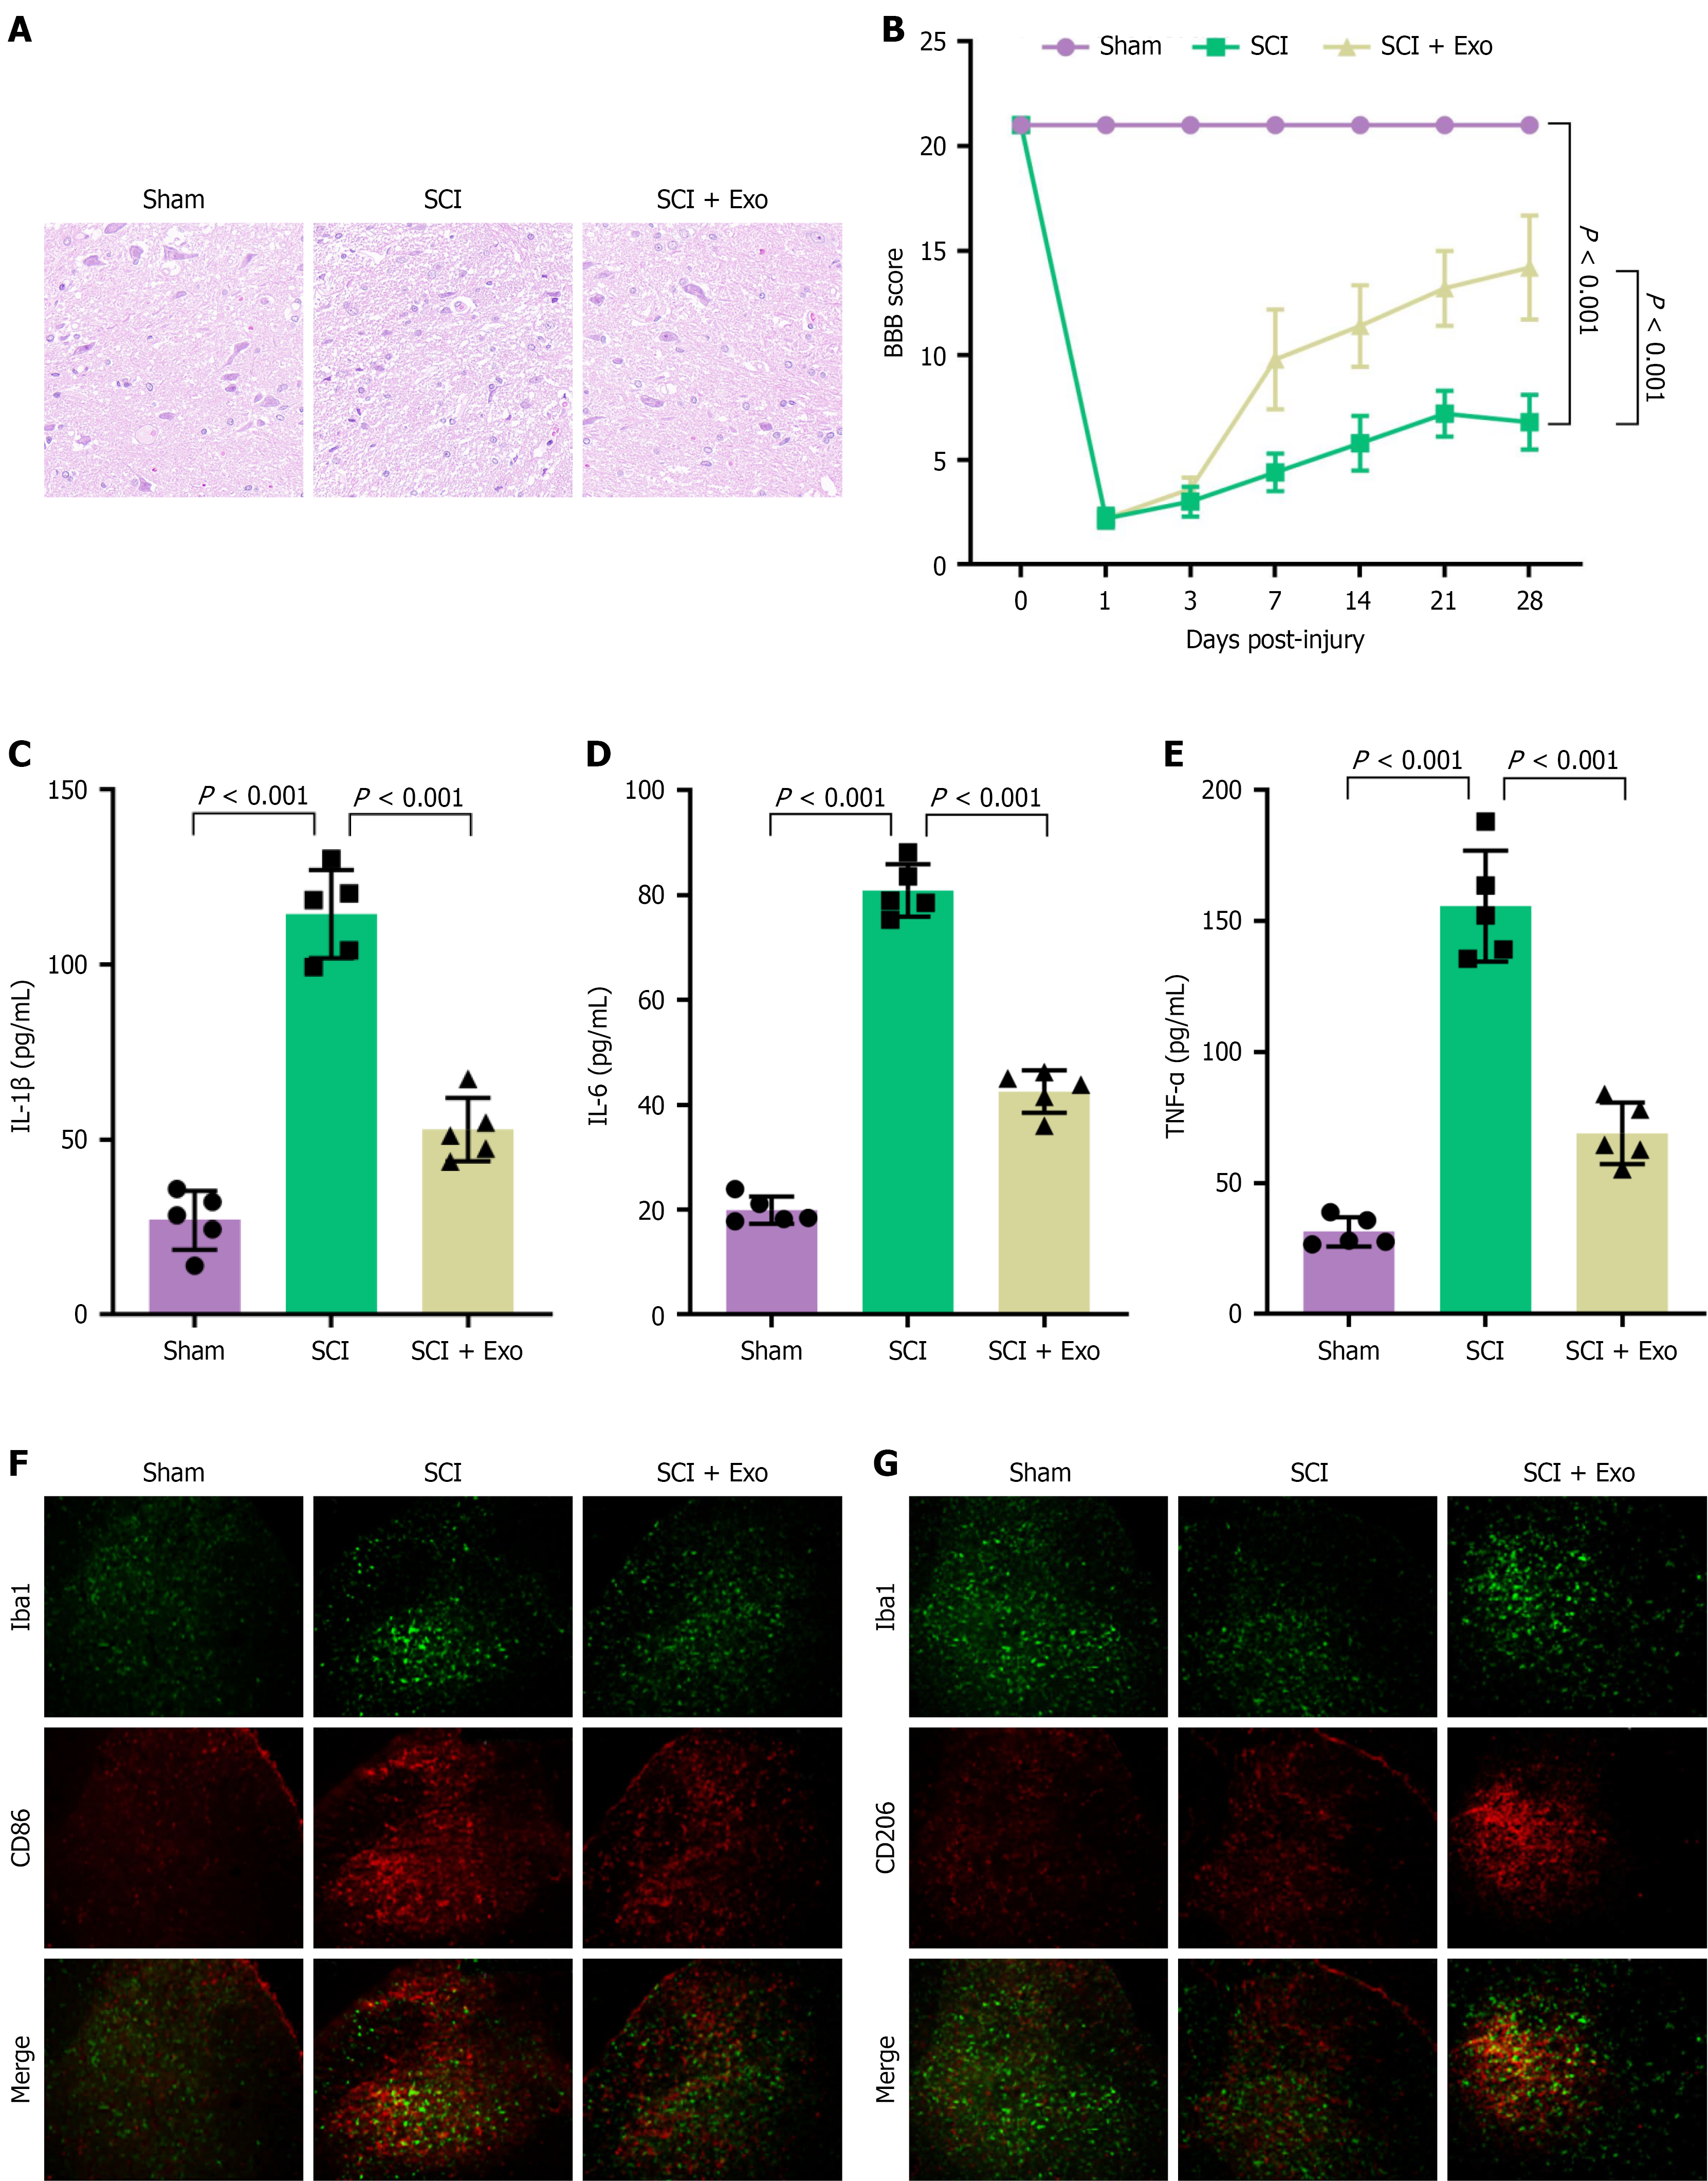
Figure 6 Exosomes promote tissue repair and functional recovery in rats with spinal cord injury.
A: Representative images of spinal cord tissue sections from different groups, assessed by hematoxylin and eosin staining, scale bar = 100 μm; B: Hindlimb motor function recovery of rats evaluated by the Basso, Beattie, Bresnahan locomotor rating scale at indicated time points after surgery; C-E: The expression levels of inflammatory cytokines (tumor necrosis factor-alpha, interleukin-1β, interleukin-6) in spinal cord tissues measured by enzyme-linked immunosorbent assay on day 28 post-surgery; F and G: Representative immunofluorescence staining of spinal cord sections from sham, spinal cord injury, and spinal cord injury + exosome groups: Iba-1 (green) and CD86 (red, M1 marker) (F); Iba-1 (green) and CD206 (red, M2 marker) (G). Merged images show co-localization. Data are presented as mean ± SD. SCI: Spinal cord injury; Exo: Exosome; BBB: Basso, Beattie, Bresnahan; TNF-α: Tumor necrosis factor-alpha; IL: Interleukin.
- Citation: Wang W, Wang B, Yin H. Exosomal miR-181d-5p promotes spinal cord injury repair by driving microglial polarization from M1 to M2 phenotype. World J Stem Cells 2026; 18(7): 119260
- URL: https://www.wjgnet.com/1948-0210/full/v18/i7/119260.htm
- DOI: https://dx.doi.org/10.4252/wjsc.119260