Copyright
©The Author(s) 2025.
World J Stem Cells. Oct 26, 2025; 17(10): 110445
Published online Oct 26, 2025. doi: 10.4252/wjsc.v17.i10.110445
Published online Oct 26, 2025. doi: 10.4252/wjsc.v17.i10.110445
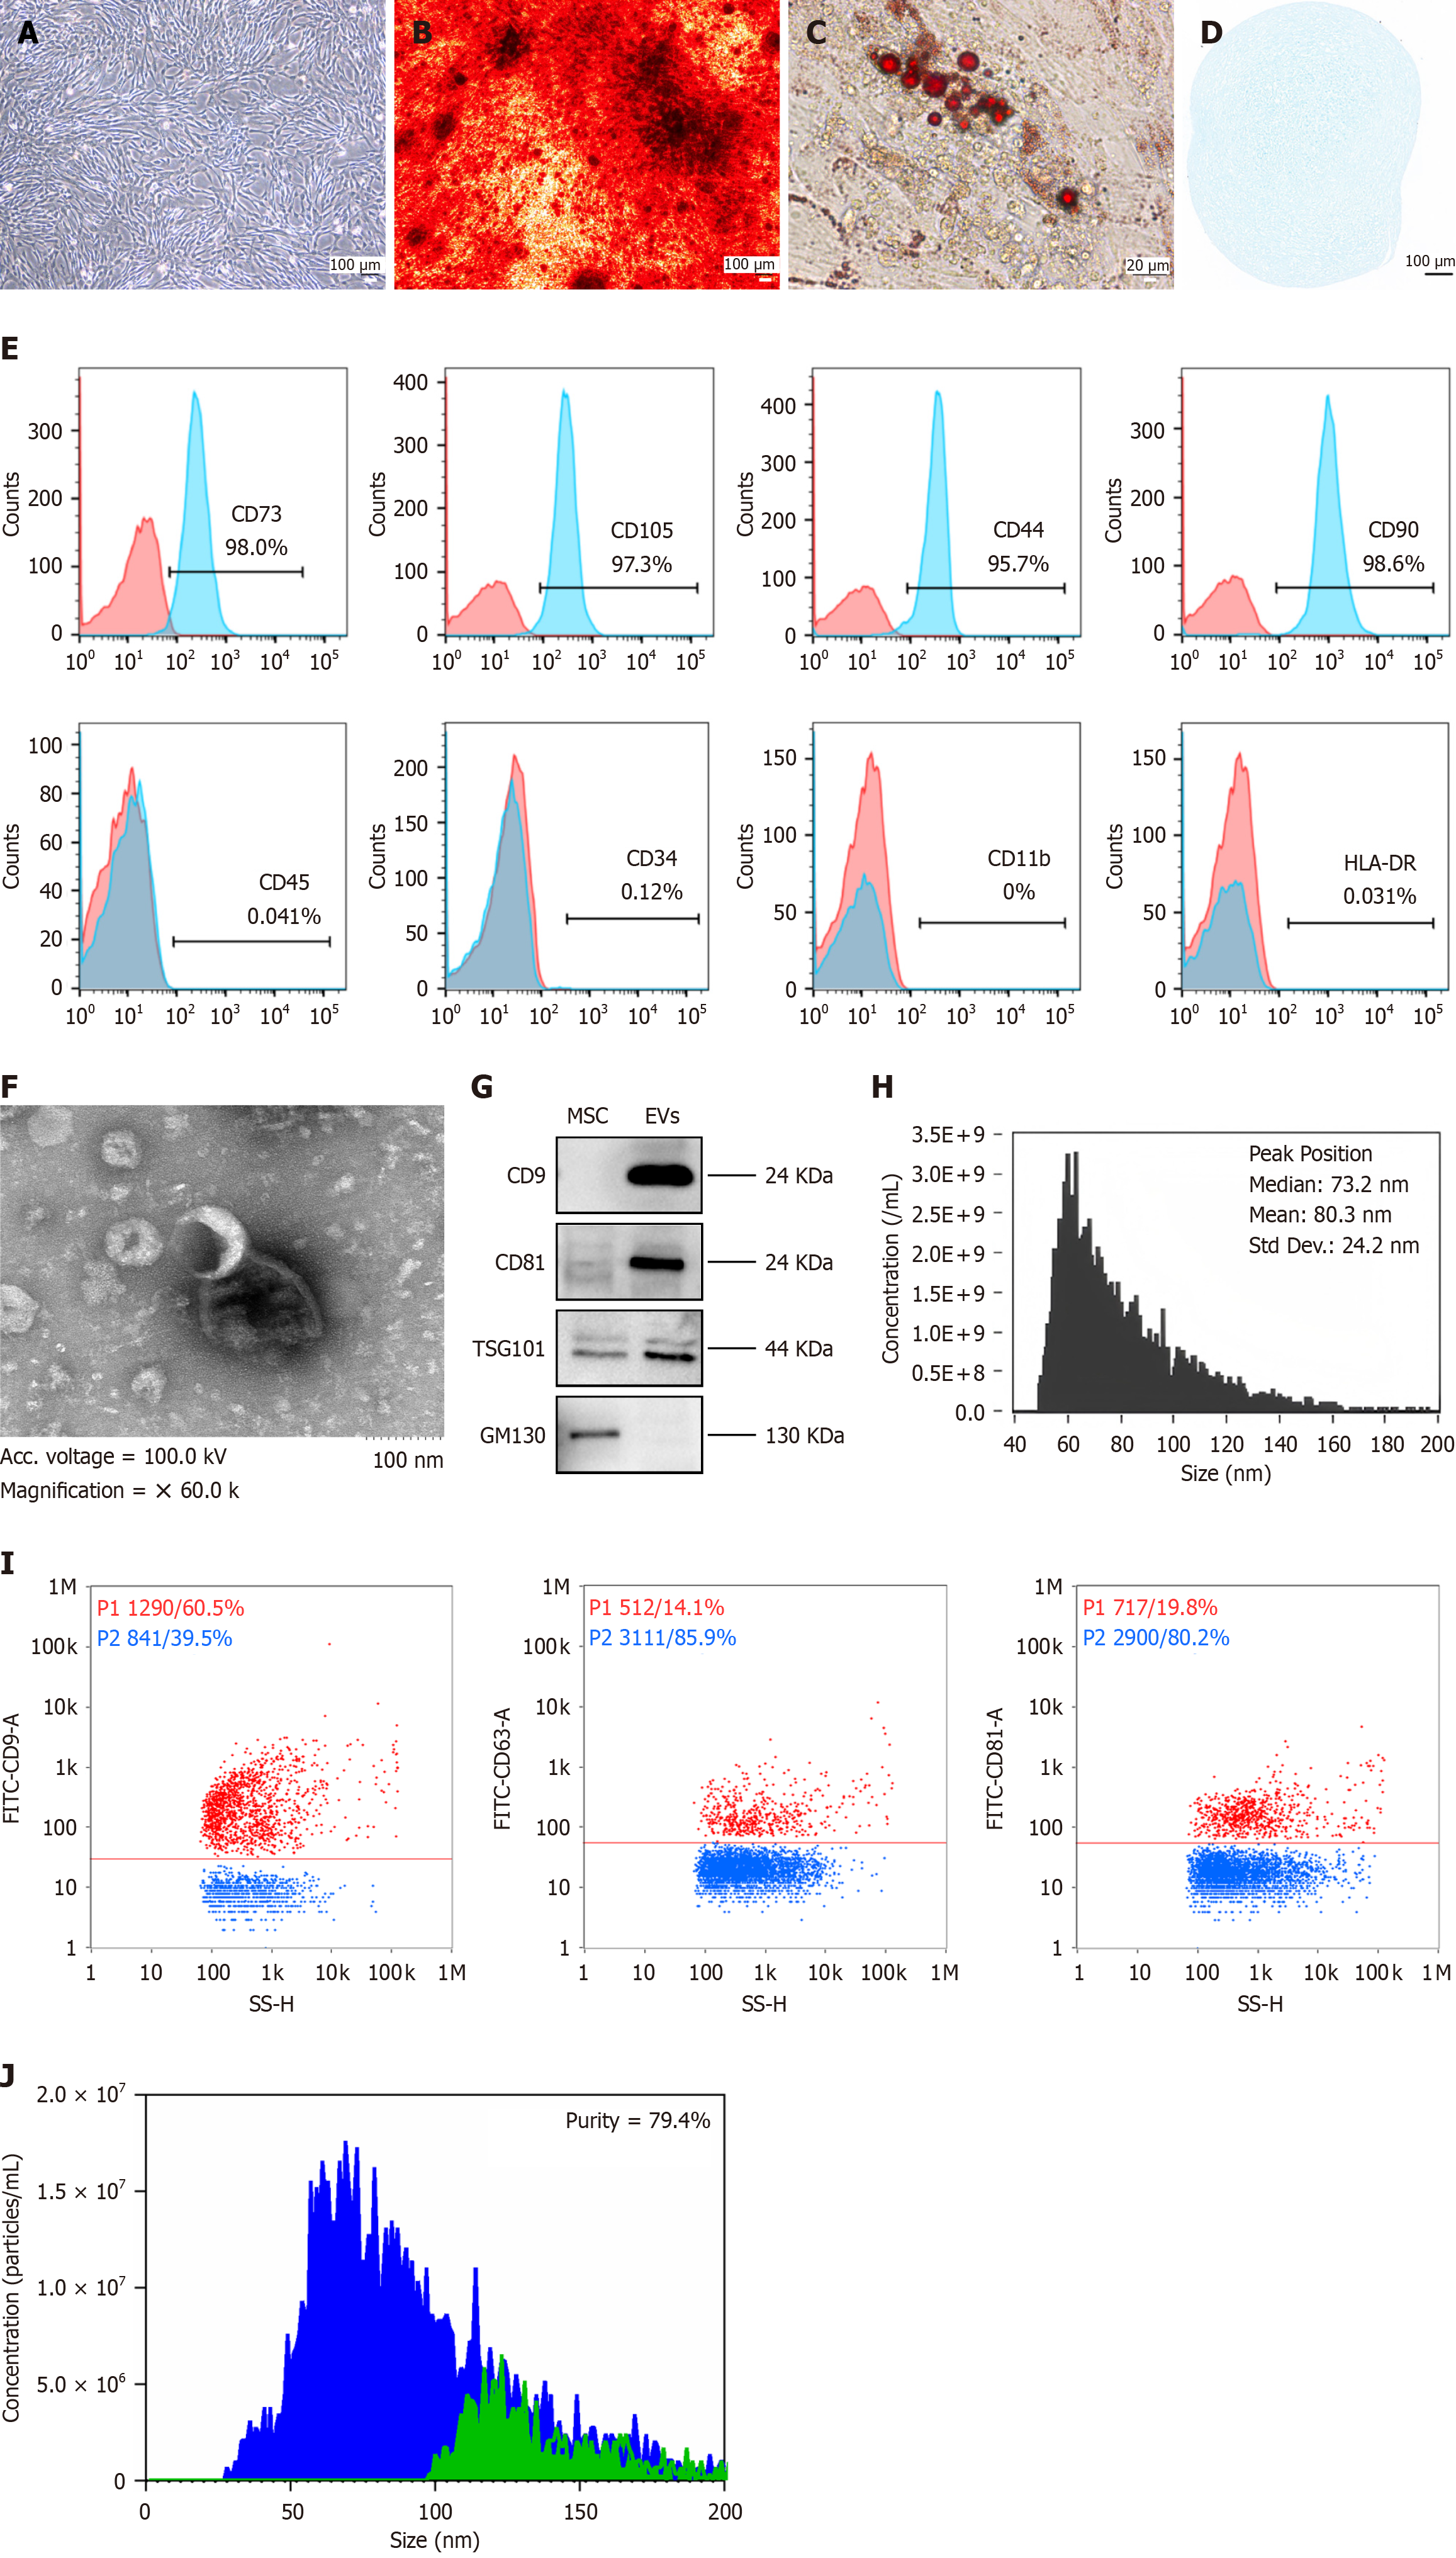
Figure 1 The characteristics of umbilical cord-derived mesenchymal stromal cells and derived extracellular vesicles derived from mesenchymal stromal cells.
A: Morphological examination of umbilical cord-derived mesenchymal stromal cells (UC-MSCs) (scale bar indicates 100 μm); B-D: Multilineage differentiation of UC-MSCs. B: Osteogenic differentiation characterized by calcium phosphate deposits, visualized by Alizarin Red staining (scale bar indicates 100 μm); C: Adipogenic differentiation confirmed by the accumulation of lipid vacuoles, highlighted by Oil Red O staining (scale bar indicates 20 μm); D: Chondrogenic differentiation indicated by the synthesis of proteoglycans stained with Alcian Blue (scale bar indicates 100 μm); E: Surface marker expression profile of UC-MSCs. These cells were positive for the mesenchymal markers CD73 (98.0%), CD105 (97.3%), CD44 (95.7%), and CD90 (98.6%) but negative for CD45 (0.041%), CD34 (0.12%), CD11b (0.0%), and HLA-DR (0.031%); F: The ultrastructure of extracellular vesicles (EVs) derived from mesenchymal stromal cells (MSC-EVs) was examined by transmission electron microscopy (the scale bar indicates 100 nm); G: Immunoblotting was performed for the biomarkers of UC-MSCs and MSC-EVs. Full-length blots are presented in Supplementary Figure 4; H: The histogram illustrates the particle size distribution of MSC-EVs. To evaluate the concentration and dimensional spread of the particles, the suspension containing EVs was diluted at a 1:1000 ratio with phosphate buffered saline; I: The CD9, CD63, and CD81 proteins expressed on the surface of MSC-EVs were detected by nano flow cytometry. For immunofluorescence staining, fluorescein isothiocyanate-labeled antibodies against CD9, CD63, or CD81 were added to the EV suspension. All antibodies were purchased from BD Biosciences; J: Comparative particle quantification of MSC-EVs was performed before and after treatment with Triton X-100. To assess purity, a 5 μL aliquot of 10% Triton X-100 (purchased from Sigma-Aldrich, Japan) was mixed with a 45 μL suspension of EVs. The nano flow cytometry platform was used to analyze the characteristic side scatter burst profiles of the EVs. Purity = (pre-disruption particle count - post-disruption particle count)/pre-disruption particle count × 100%, higher values indicate greater purity. MSCs: Mesenchymal stromal cells; EVs: Extracellular vesicles; TSG101: Tumor susceptibility gene 101.
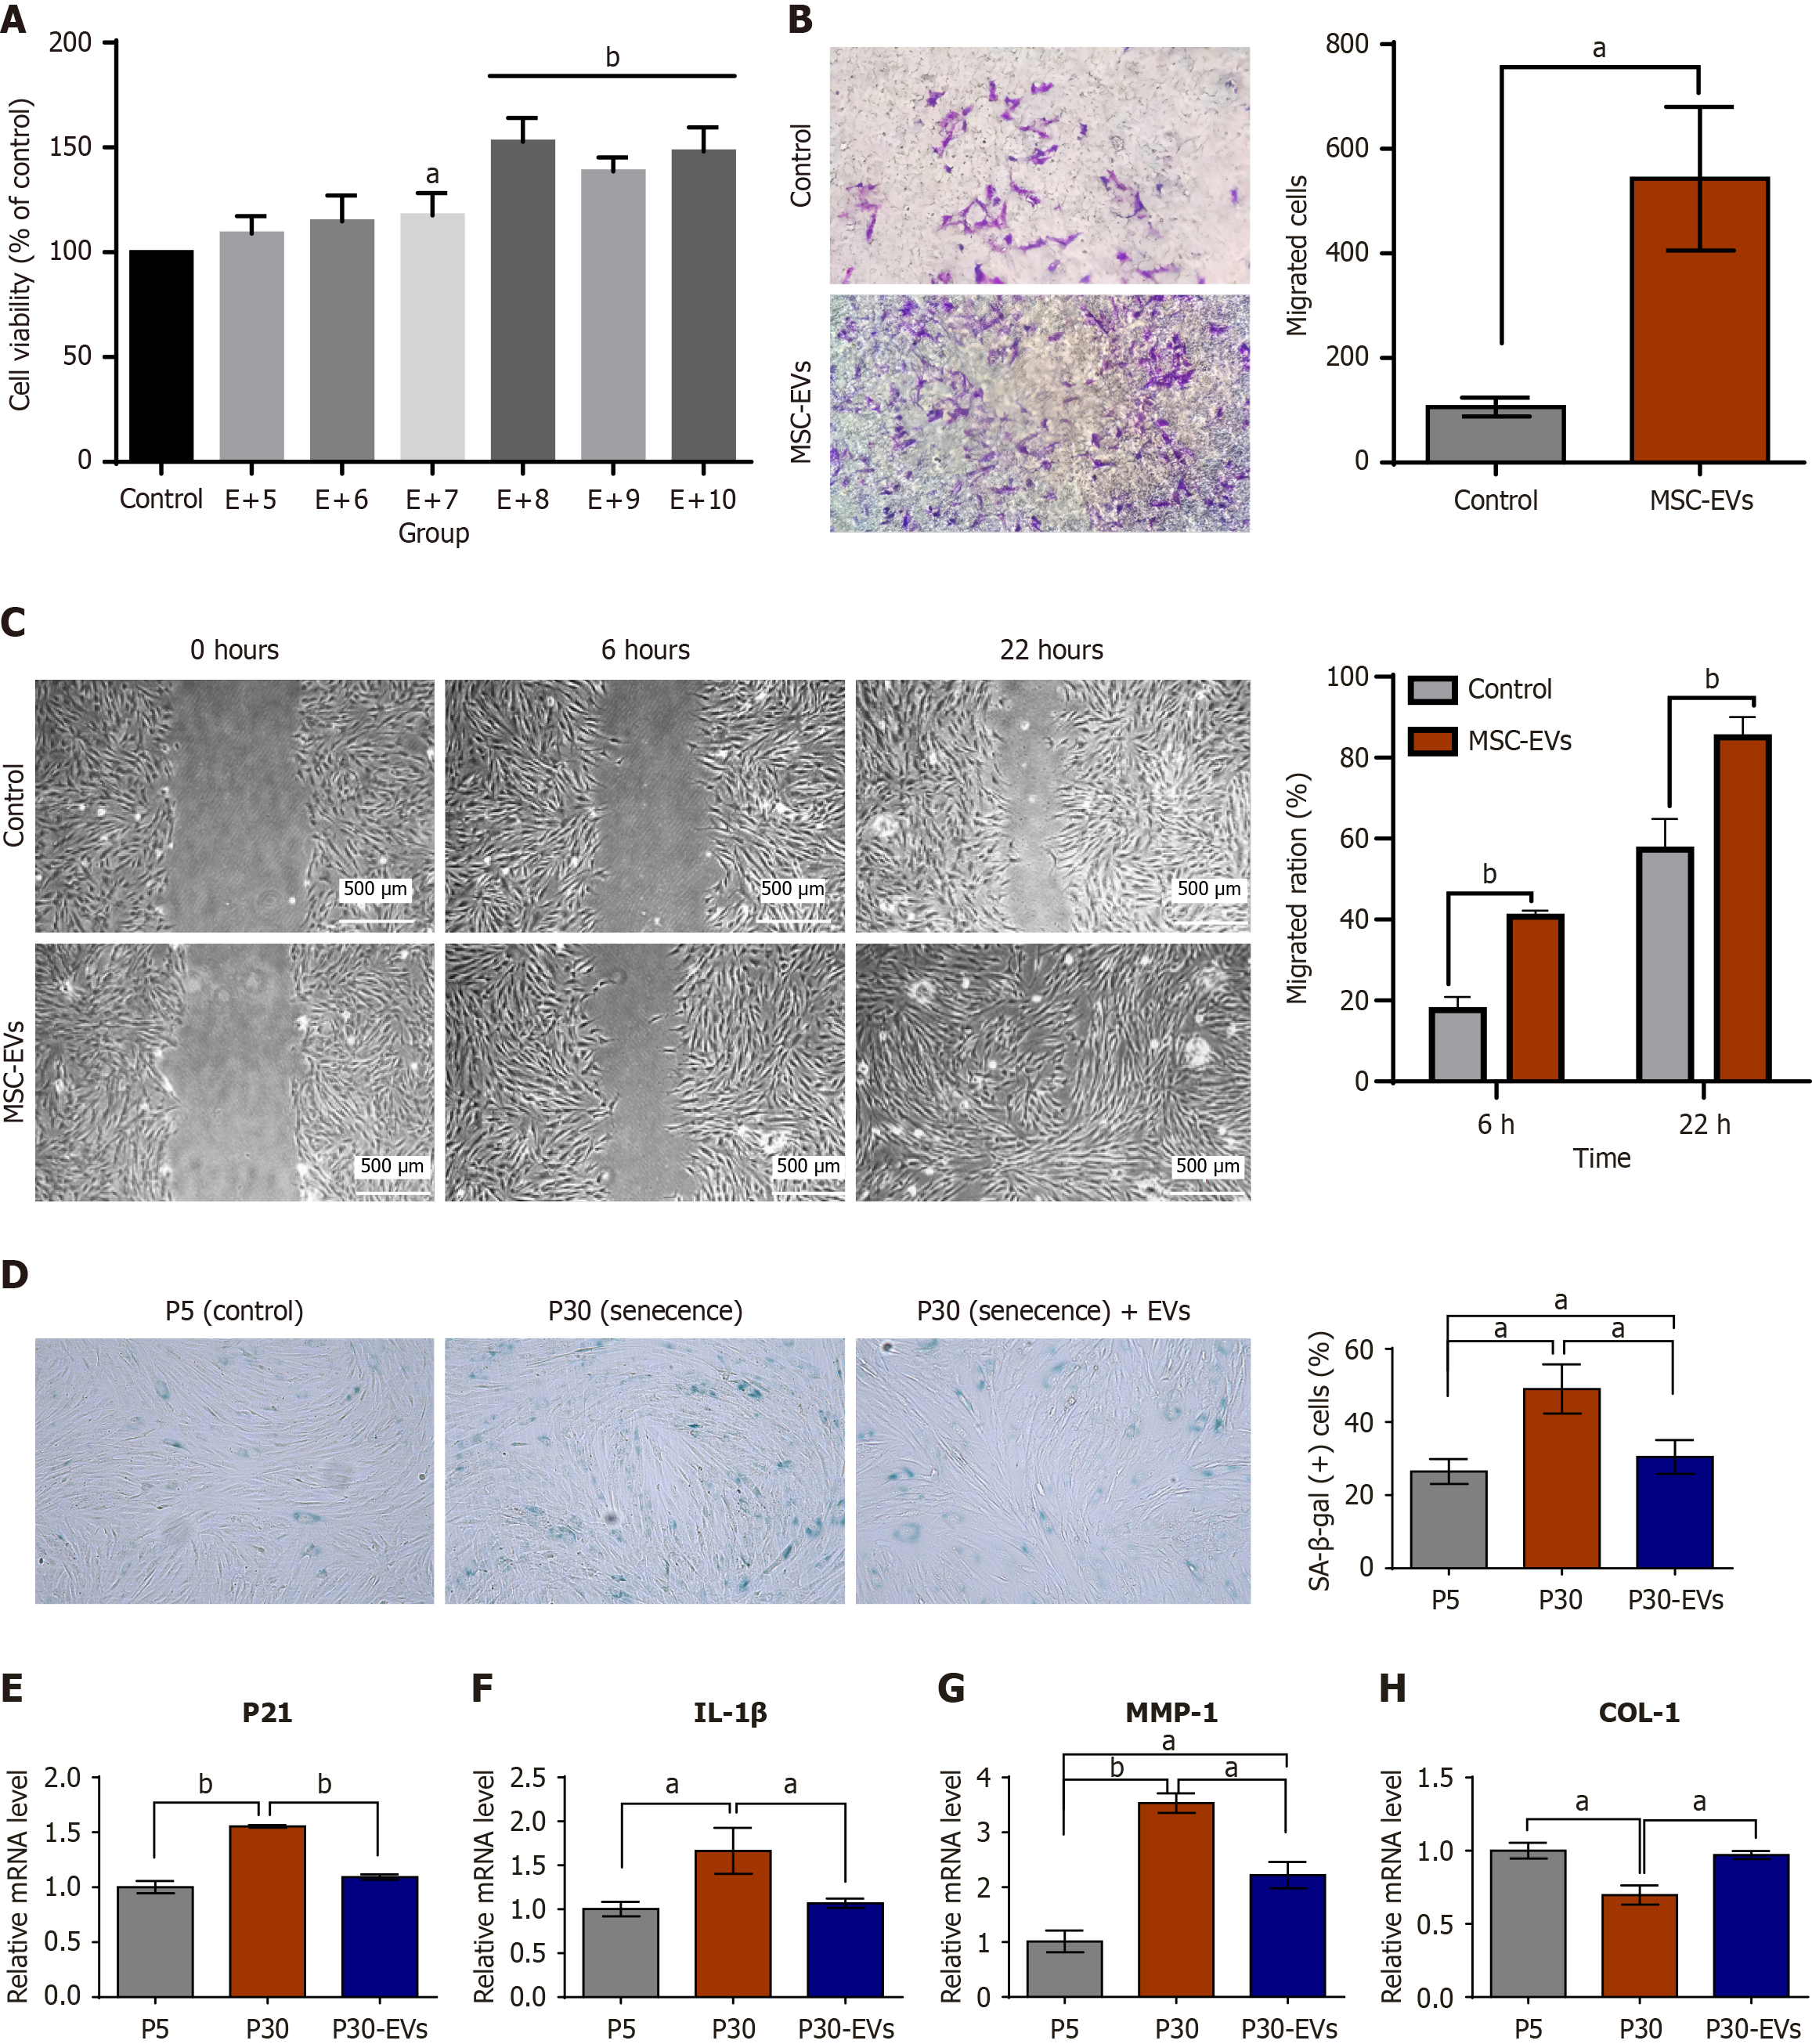
Figure 2 Extracellular vesicle derived from mesenchymal stromal cell treatment rejuvenated human dermal fibroblasts.
A: The results of the Cell Counting Kit-8 assay demonstrated the proliferation of human dermal fibroblasts (HDFs) after treatment with extracellular vesicles derived from mesenchymal stromal cells (MSC-EVs) for 72 hours; B: Transwell migration assays (left) and subsequent quantitative analysis were performed using ImageJ software (right) for HDFs treated with MSC-EVs; C: Scratch assays provided qualitative (left) and quantitative (right) evidence for an increase in the migration of HDFs after treatment with MSC-EVs. In vitro wound healing assays revealed that the migration of HDFs increased after treatment with MSC-EVs at 6 and 22 hours after administration. Specifically, at the 22-hour mark, the wound healing rate of the MSC-EV-treated cells (85.00%) was significantly greater than that of the phosphate buffered saline-treated control cells (57.33%); D: Representative images of senescence-associated β-galactosidase-stained samples and quantification of HDFs. Quantitative assessments revealed that the percentage of senescence-associated β-galactosidase-positive cells after treatment with MSC-EVs (30%) was considerably lower than that recorded in the untreated control group of the passage 30 cohort (49%); E-H: Real time quantitative polymerase chain reaction analyses of the expression of the senescence and inflammatory markers P21, interleukin-1β, the extracellular matrix remodeling enzyme matrix metallopeptidase 1, and collagen type I. The data represent the mean ± SD of three replicates. aP < 0.05, bP < 0.01. For the control condition, human dermal fibroblasts were incubated with a comparable volume of phosphate buffered saline instead of extracellular vesicles derived from mesenchymal stromal cells. The images were quantitatively analyzed using ImageJ software. MSC-EVs: Extracellular vesicles derived from mesenchymal stromal cells; SA-β-gal: Senescence-associated β-galactosidase; EVs: Extracellular vesicles; IL-1β: Interleukin-1β; MMP-1: Matrix metallopeptidase 1; COL-1: Collagen type I.
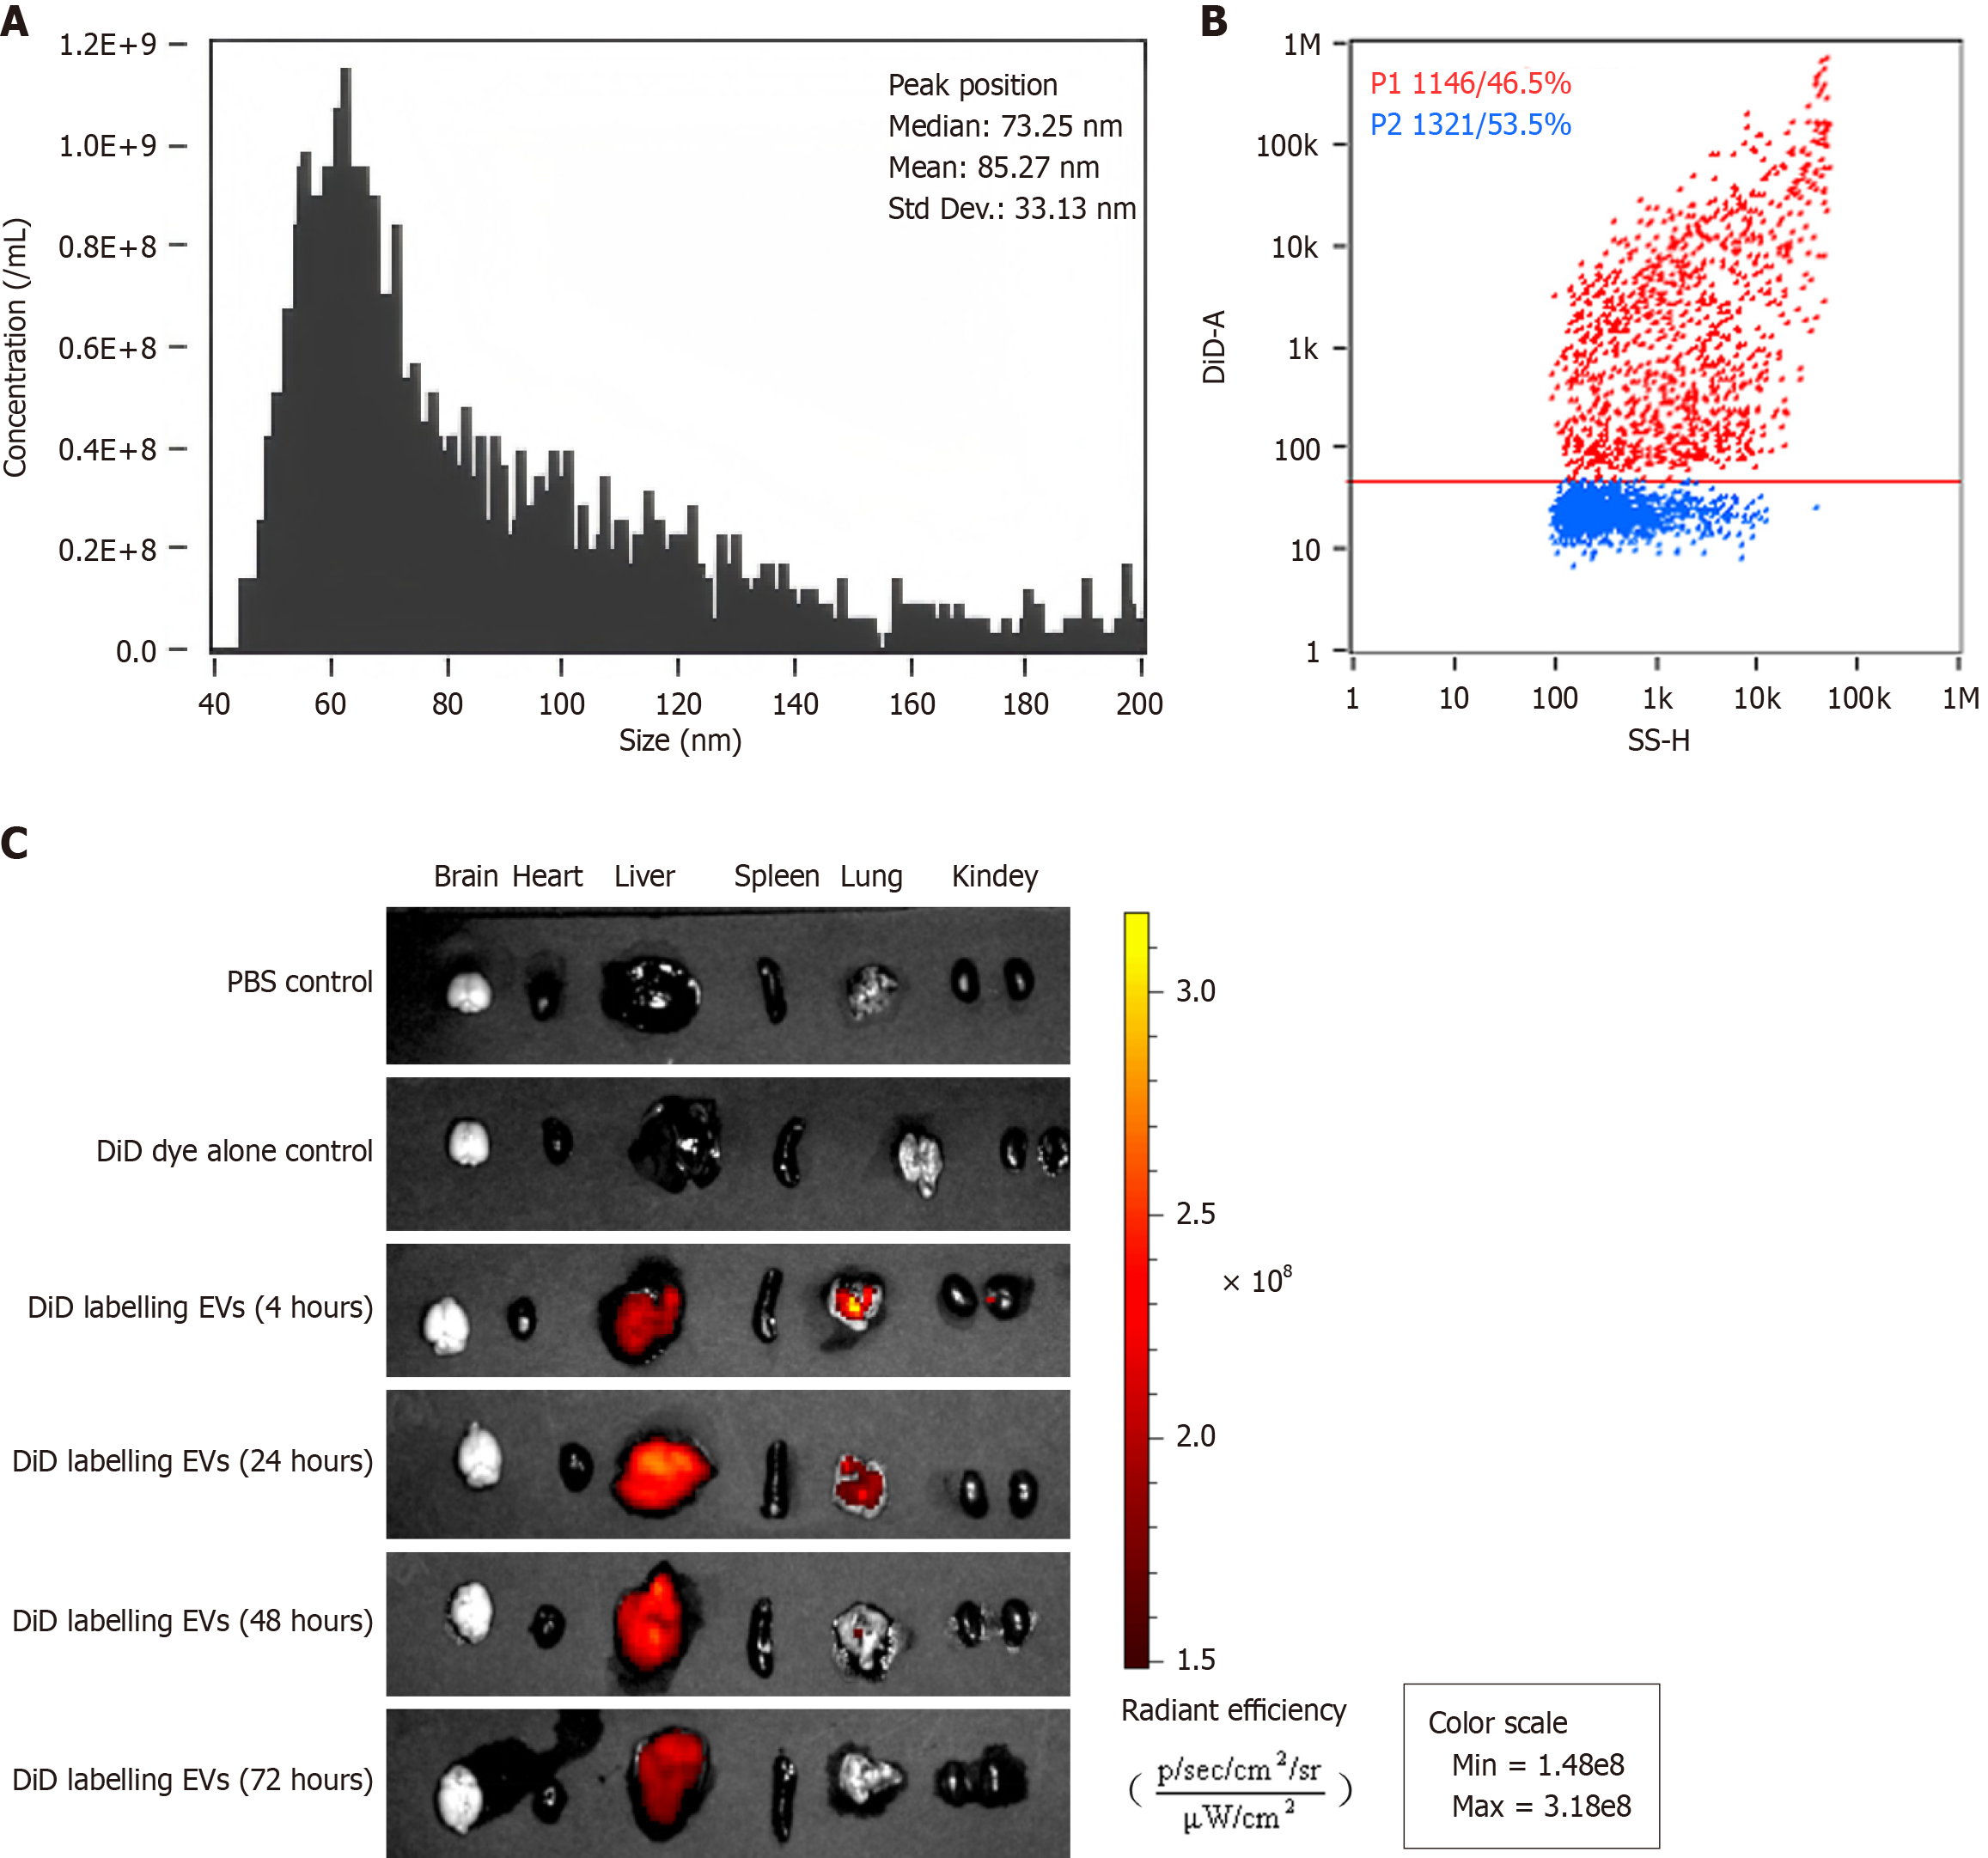
Figure 3 Biodistribution of administered extracellular vesicles derived from mesenchymal stromal cells in mice.
A: Nano flow cytometry analysis for determining the efficiency of labeling extracellular vesicles derived from mesenchymal stromal cells with DiD (DiD-labeled MSC-EVs); B: The particle size distribution of DiD-labeled MSC-EVs; C: The relative biodistribution of DiD-labeled MSC-EVs in nude mice. PBS: Phosphate buffered saline; EVs: Extracellular vesicles.
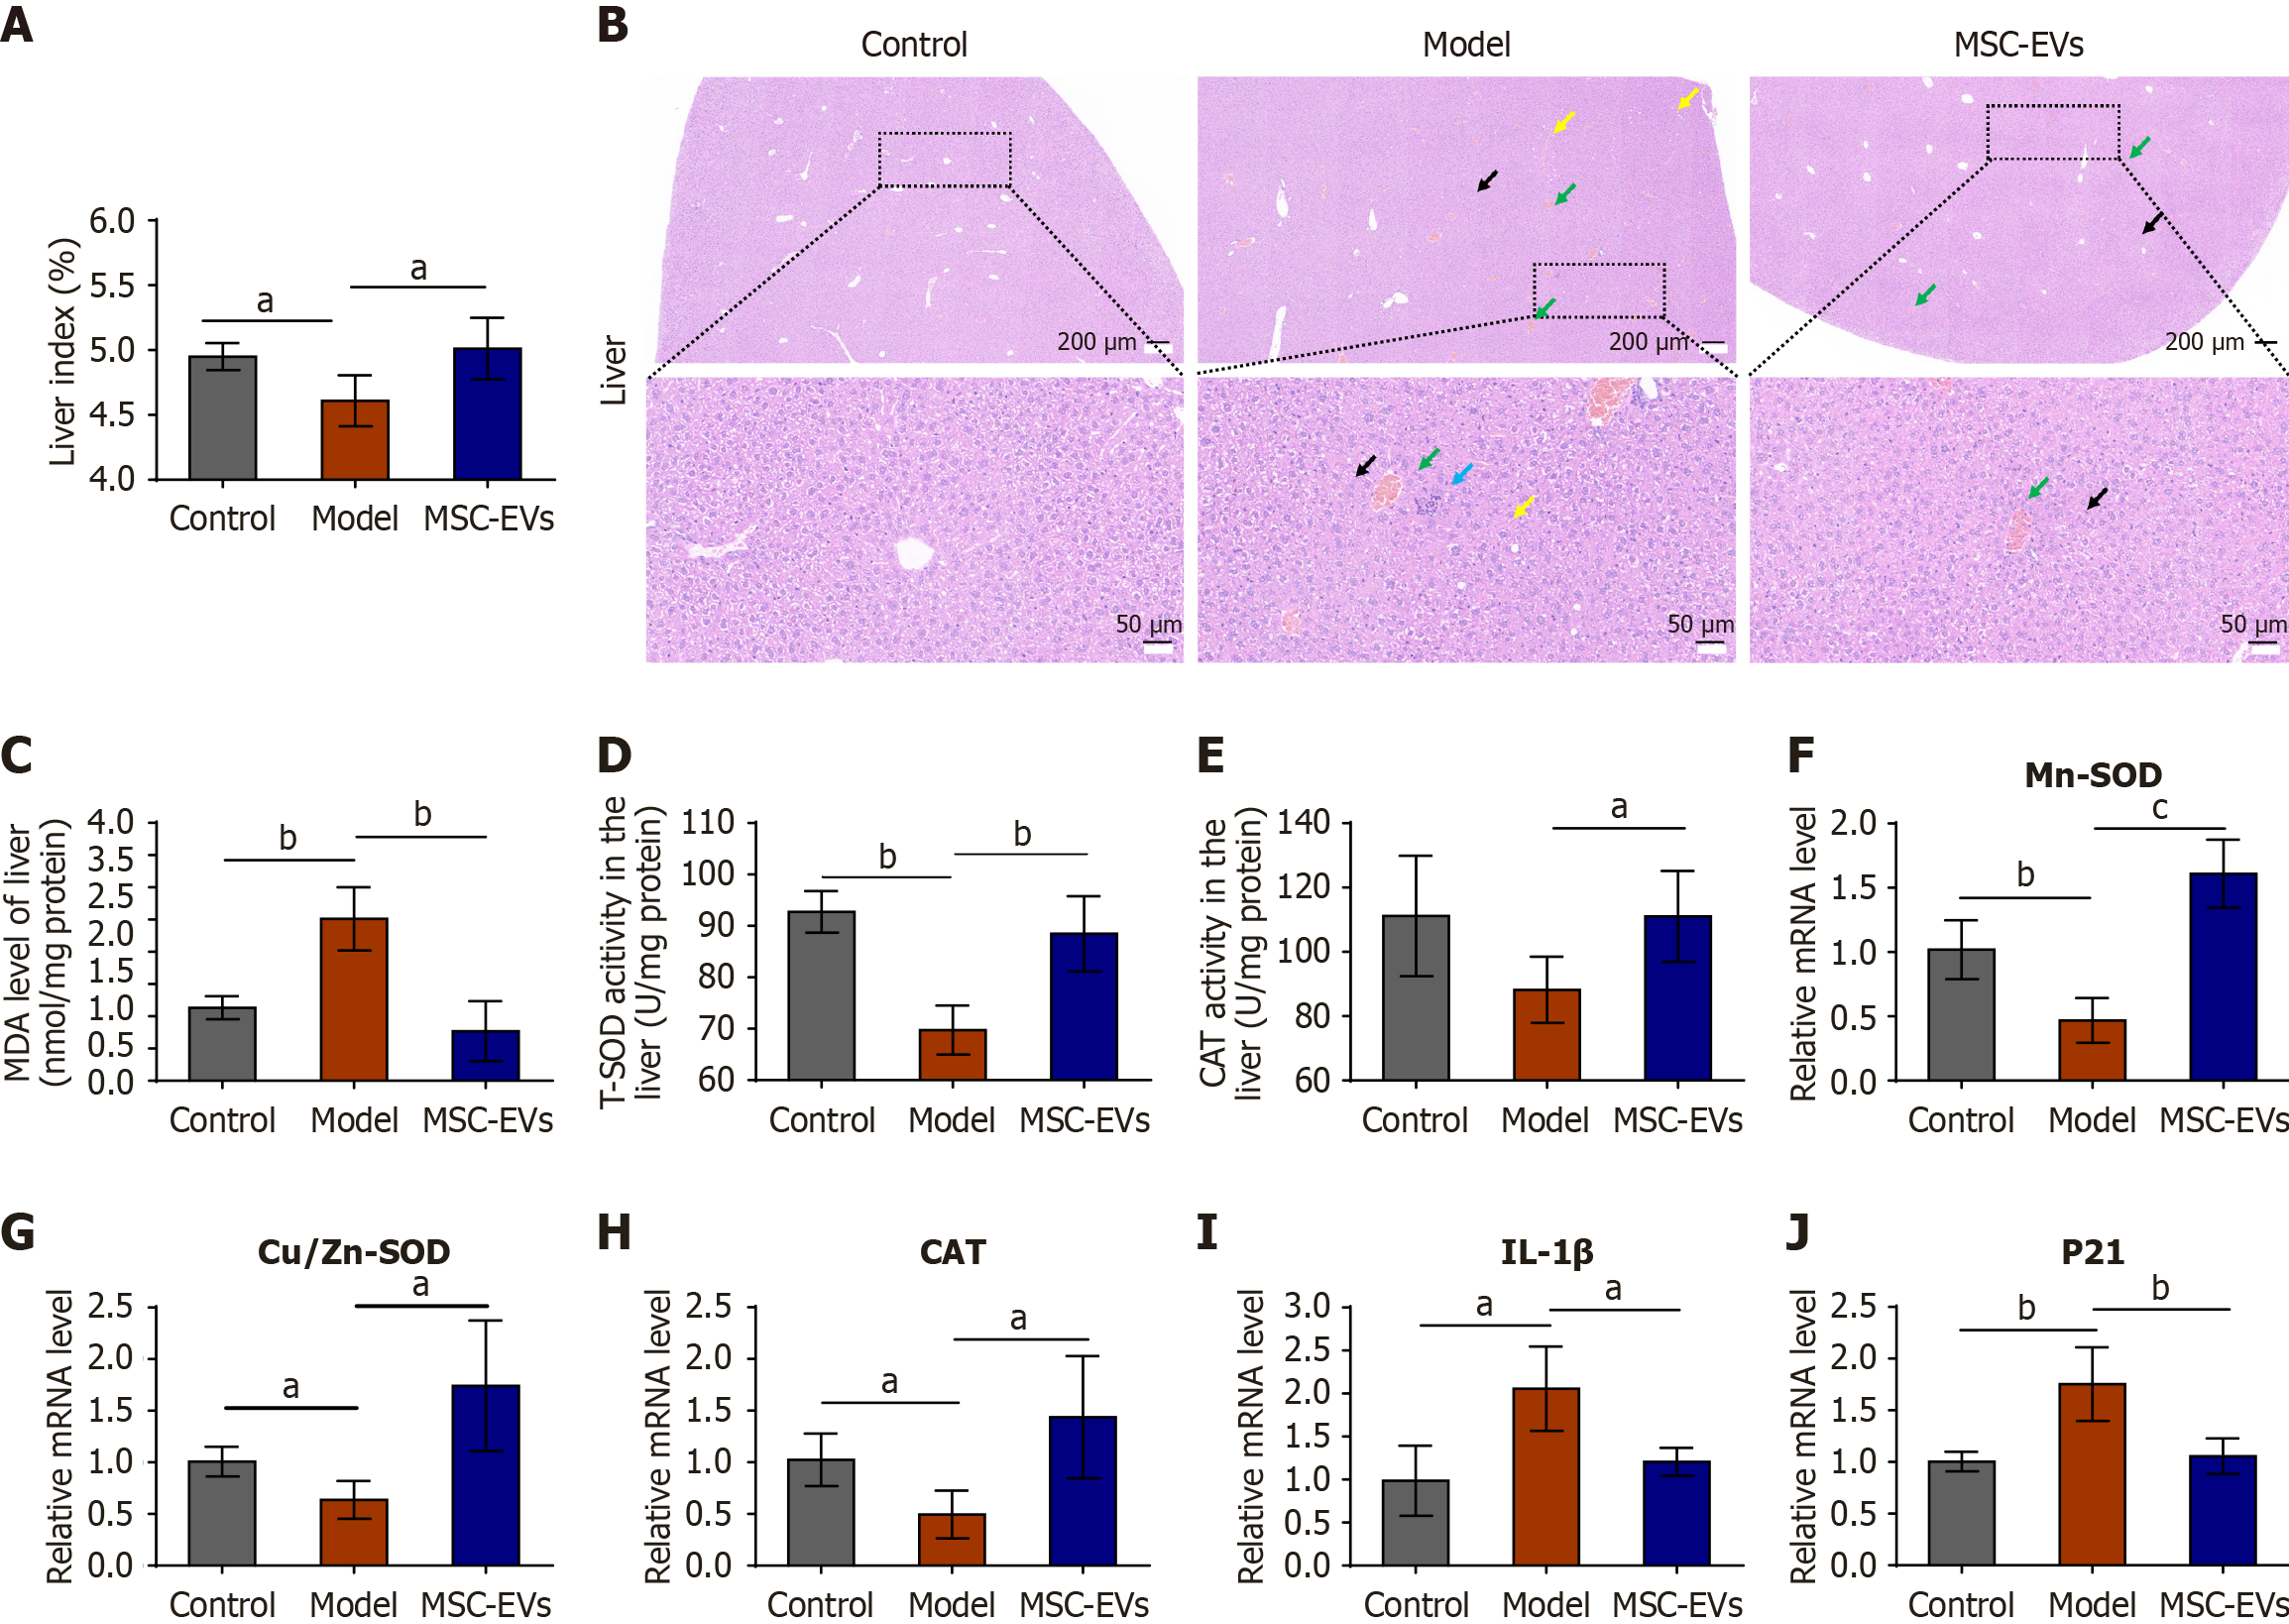
Figure 4 Intravenous administration of extracellular vesicles derived from mesenchymal stromal cells alleviated various age-related phenotypic changes in mice.
A: The liver indices of the mice; B: Representative images of hematoxylin and eosin-stained liver tissue in the control, model, and mice were treated with extracellular vesicles derived from mesenchymal stromal cells after induction with D-galactose groups (n = 3). Black arrow: Hydropic degeneration in hepatocytes; green arrow: Congestion in the central vein; yellow arrow: Cytoplasmic vacuoles of different sizes, indicating degeneration of hepatocyte vacuoles; blue arrow: Nuclear fragmentation with scant lymphocytic infiltration and focal necrosis. The scale bar of the hematoxylin and eosin scan = 200 μm; the scale bar of the enlarged image = 50 μm; C: Malondialdehyde levels in the liver; D: Total superoxide dismutase (SOD) levels in the liver; E: Catalase levels in the liver; F-H: Quantitative polymerase chain reaction was performed to determine the expression of the oxidation-related genes Mn-SOD (F), Cu/Zn-SOD (G), and catalase (H) in the three groups; I and J: Quantitative polymerase chain reaction was performed to determine the expression of the aging-related genes interleukin-1β (I) and P21 (J) in the three groups. Control: Untreated mice served as the normal baseline; model: D-galactose-induced aging mice; MSC-EVs: Mice were treated with extracellular vesicles derived from mesenchymal stromal cells after induction with D-galactose. aP < 0.05, bP < 0.01, cP < 0.001. EVs: Extracellular vesicles; MSC-EVs: Extracellular vesicles derived from mesenchymal stromal cells; MDA: Malondialdehyde; T-SOD: Total superoxide dismutase; CAT: Catalase; IL-1β: Interleukin-1β.
Figure 5 Integrated transcriptomic and metabolomic analysis.
A: A score plot of the principal component analysis representing metabolomic differences between the model group (in blue) and the mice were treated with extracellular vesicles derived from mesenchymal stromal cells (MSC-EVs) after induction with D-galactose group (in red). The cross-validation of the predicted model showed a PC1 value of 35.89% for the first component and a PC2 value of 18.34% for the second component for all patterns (positive and negative total ions); B: Metabolite categorization. Classification of the 4416 identified metabolites, providing an overview of the metabolic diversity affected by treatment with MSC-EVs; C: A clustered heatmap of differentially abundant metabolites was constructed to illustrate the patterns of metabolite expression across samples, showing how these patterns are altered after treatment with MSC-EVs; D: A score plot of principal component analysis representing transcriptomic differences between the model group (in blue) and the MSC-EV-treated group (in red); E: Hierarchical clustering analysis of all differentially expressed genes. The heatmap with dendrograms represents the patterns of gene expression and clustering of genes with similar expression profiles; F: A bar chart of the top 30 Kyoto Encyclopedia of Genes and Genomes (KEGG) pathways significantly enriched for differentially expressed genes and metabolites, ranked according to the level of enrichment; G: A KEGG pathway analysis (kgml) map. A visual representation of the pathways, where different shapes and colors denote distinct types. Red circles represent KEGG pathways, blue squares represent metabolites, and yellow triangles represent genes. MSC-EVs: Extracellular vesicles derived from mesenchymal stromal cells; PCA: Principal component analysis.
- Citation: Yang SS, Chen SY, Zhuang WY, Han J, Liu Y, Deng L, Guo HZ, Ma HR, Tan Y. Efficacy of extracellular vesicles derived from mesenchymal stromal cells in regulating senescence: In vitro and in vivo insights. World J Stem Cells 2025; 17(10): 110445
- URL: https://www.wjgnet.com/1948-0210/full/v17/i10/110445.htm
- DOI: https://dx.doi.org/10.4252/wjsc.v17.i10.110445


