Copyright
©The Author(s) 2025.
World J Stem Cells. Oct 26, 2025; 17(10): 109284
Published online Oct 26, 2025. doi: 10.4252/wjsc.v17.i10.109284
Published online Oct 26, 2025. doi: 10.4252/wjsc.v17.i10.109284
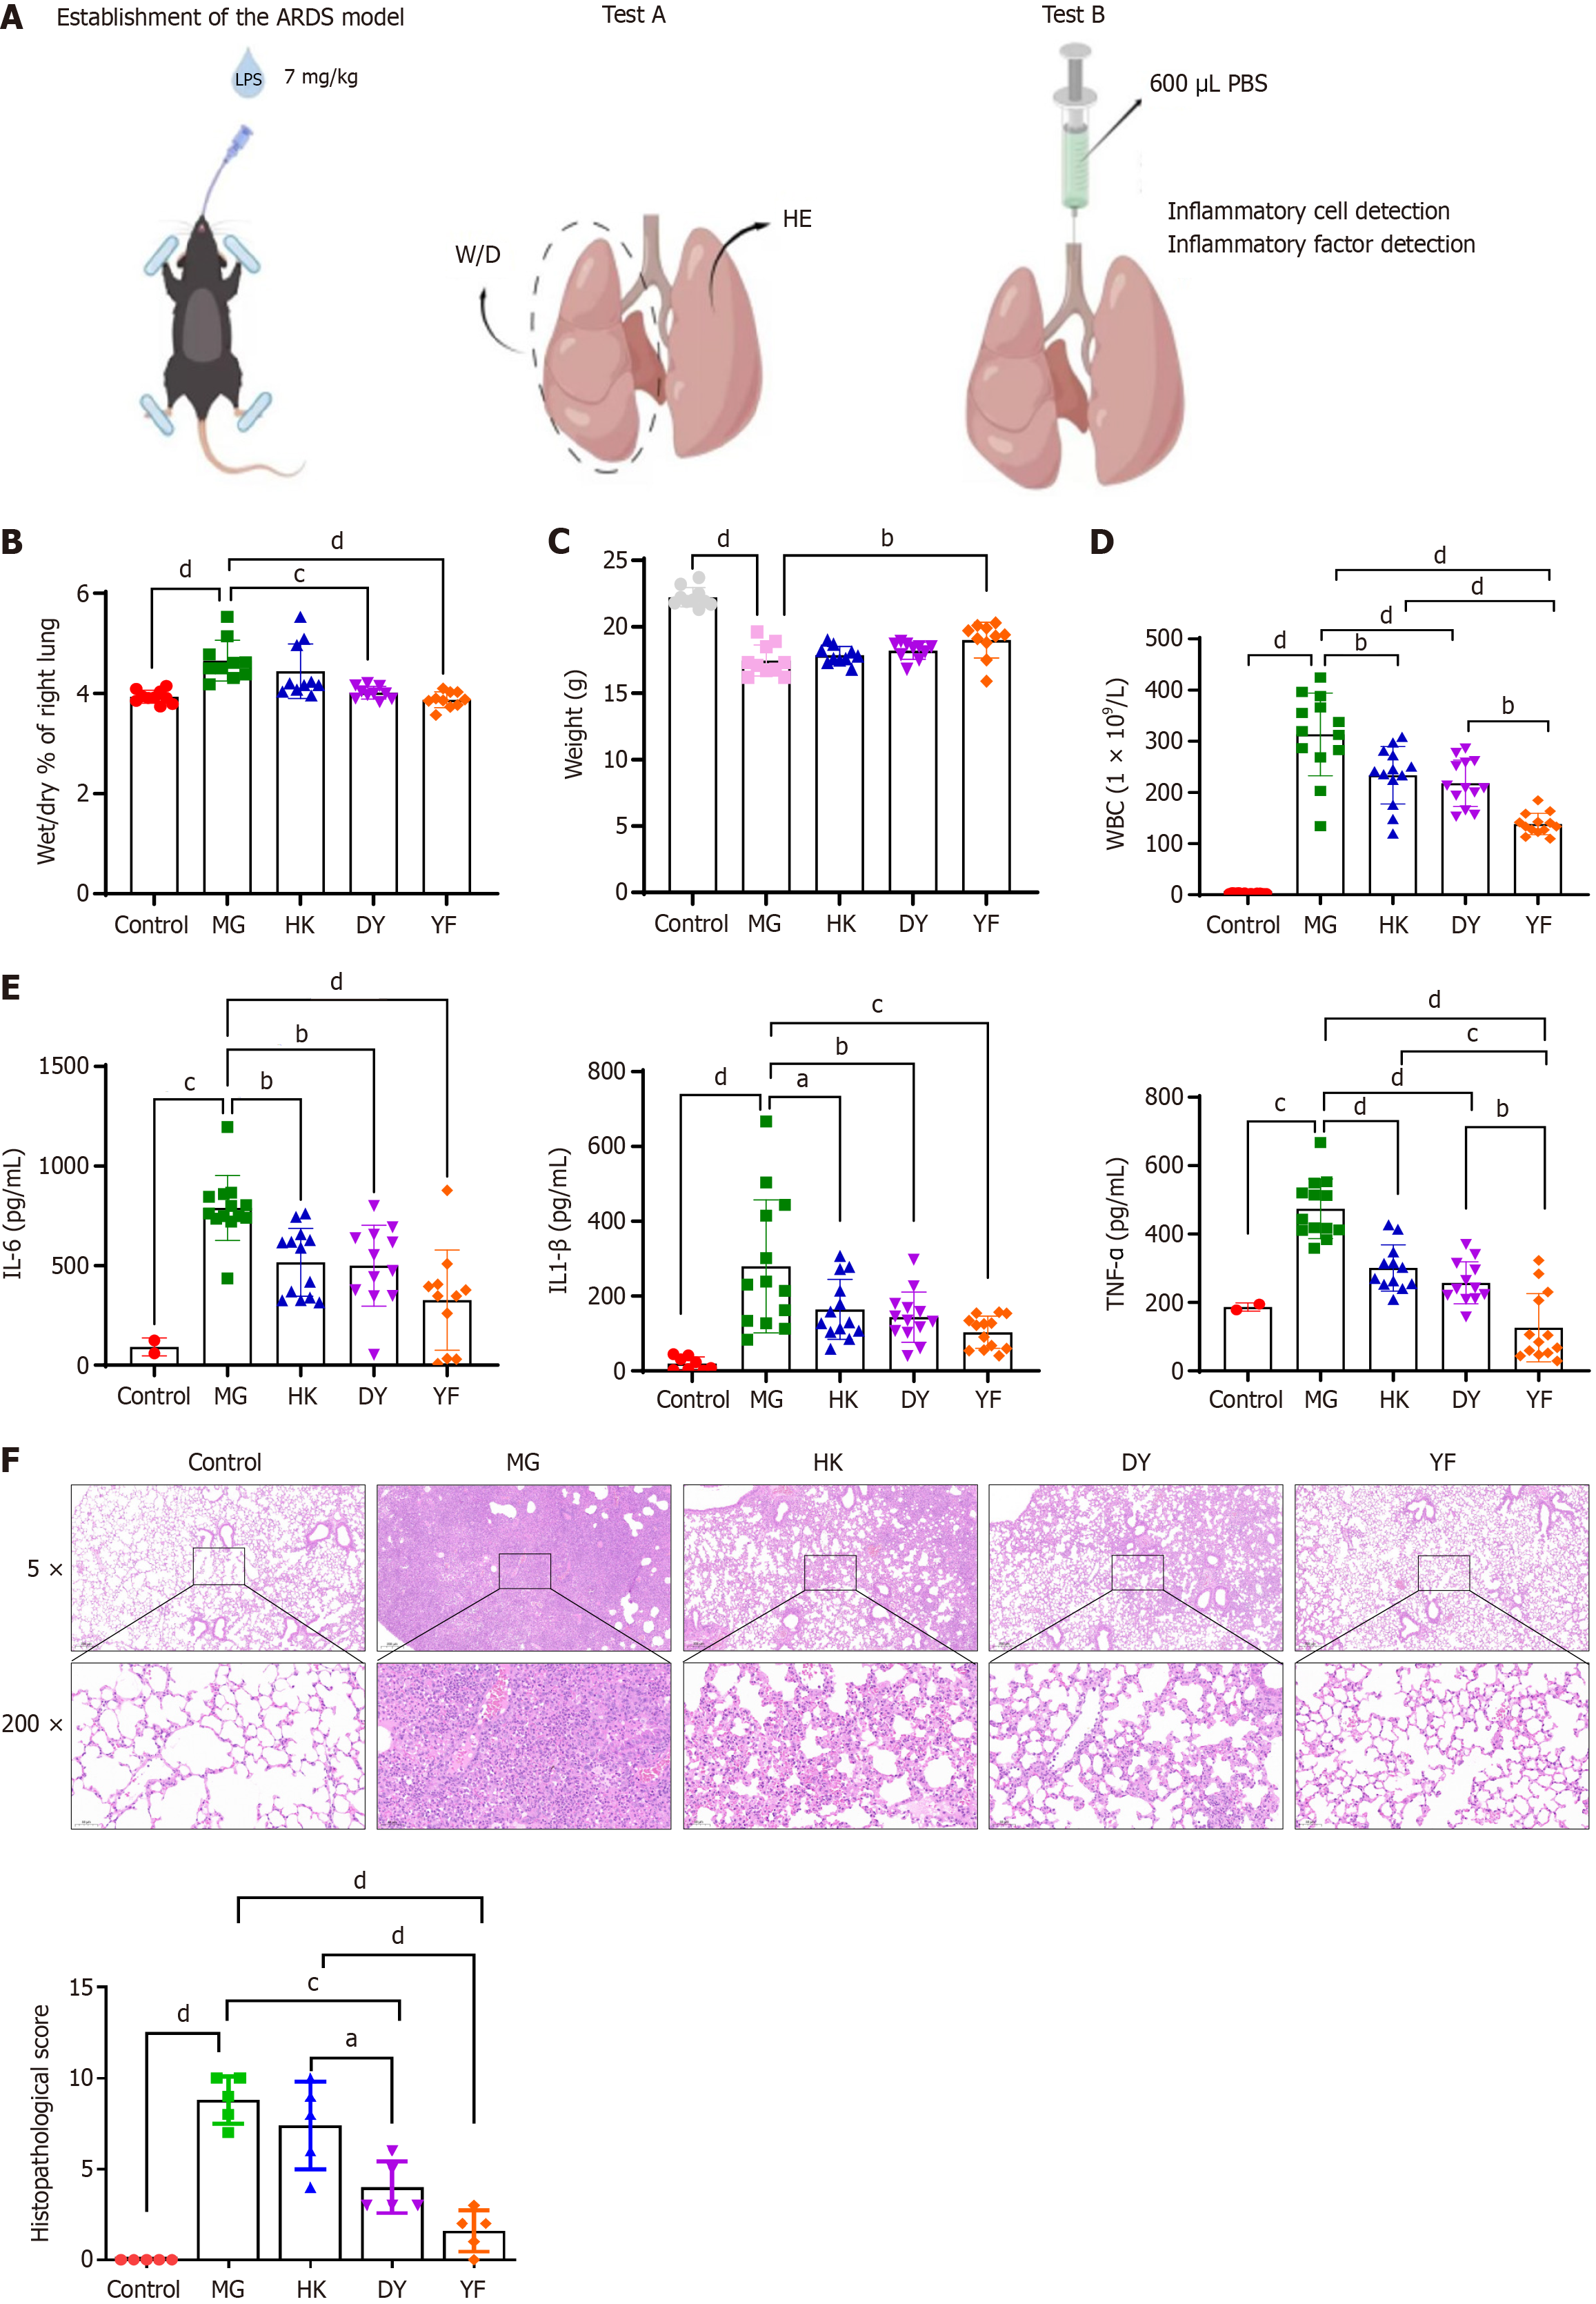
Figure 1 Effects of mesenchymal stromal cells in various media on acute respiratory distress syndrome.
A: Diagram illustrating the acute respiratory distress syndrome study design; B and C: Comparison of the wet-dry ratio (B) and body weight (C) of lung tissue from different groups; D and E: Cytokine levels in bronchoalveolar lavage fluid were measured at the experimental endpoint; F: Pathological changes and lung injury scores of the lung tissue in each group. The data are presented as means ± SD. Statistical analysis between groups was performed via two-sided Student’s t test, and within groups, ANOVA was used for normally distributed data. n = 10, aP < 0.05, bP < 0.01, cP < 0.001, dP < 0.0001. ARDS: Acute respiratory distress syndrome; W/D: Wet-dry ratio; HE: Hematoxylin and eosin; PBS: Phosphate buffered saline; MG: Model control (vehicle administered via caudal vein injection after establishing the acute respiratory distress syndrome model; DY: Mesenchymal stromal cells cultured in medium from Dakewe Biotech Co., administered via caudal vein injection after establishing the acute respiratory distress syndrome model; YF: Mesenchymal stromal cells cultured in medium from Shandong Qilu Cell Therapy Engineering Technology Co. Ltd., administered via caudal vein injection under the acute respiratory distress syndrome model; HK: Mesenchymal stromal cells cultured in medium from Cytoniche, administered via caudal vein injection in the acute respiratory distress syndrome model; WBC: White blood cell; IL: Interleukin; TNF: Tumor necrosis factor.
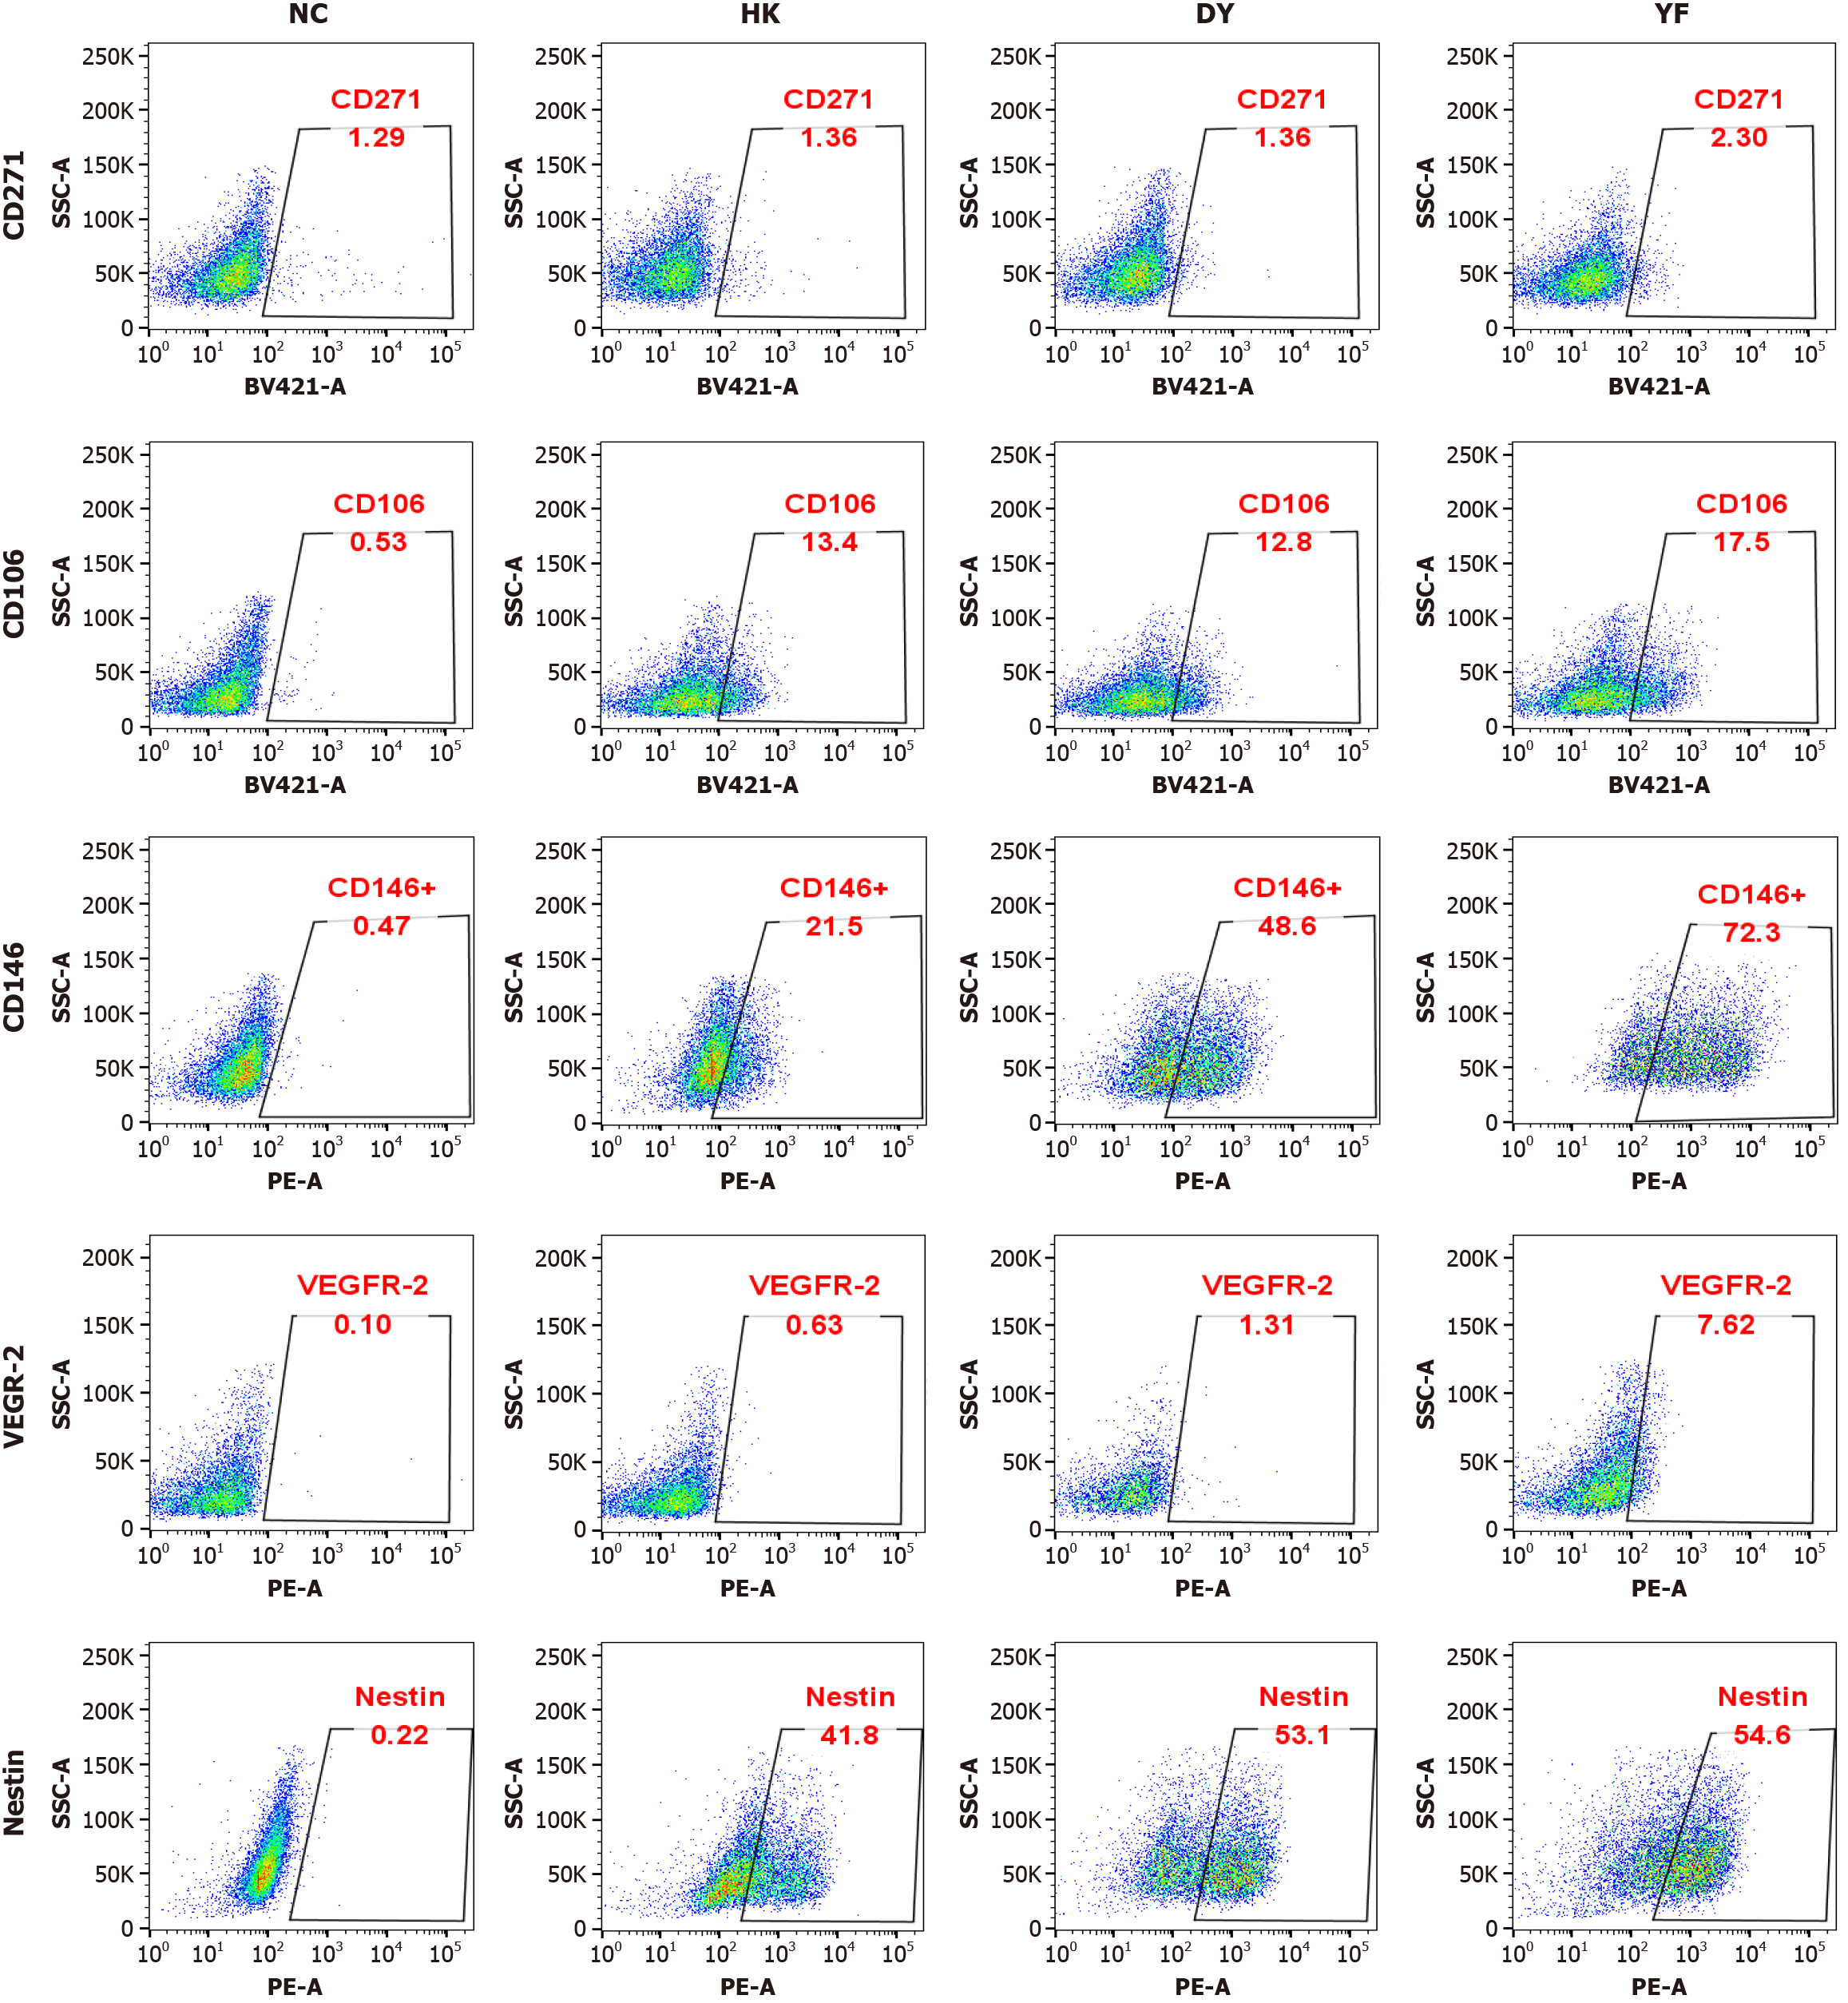
Figure 2 CD146 protein expression in mesenchymal stromal cells cultured in medium from Shandong Qilu Cell Therapy Engineering Technology Co.
Ltd., administered via caudal vein injection under the acute respiratory distress syndrome model. Variations in the expression of different proteins across various culture systems. Representative flow cytometry patterns from the different groups are shown. The expression of CD146 was significantly greater in the mesenchymal stromal cells cultured in medium from Shandong Qilu Cell Therapy Engineering Technology Co. Ltd., administered via caudal vein injection under the acute respiratory distress syndrome model system, whereas the CD271, CD106, vascular endothelial growth factor-2, and Nestin expression levels were not significantly different. NC: Negative control; DY: Mesenchymal stromal cells cultured in medium from Dakewe Biotech Co., administered via caudal vein injection after establishing the acute respiratory distress syndrome model; YF: Mesenchymal stromal cells cultured in medium from Shandong Qilu Cell Therapy Engineering Technology Co. Ltd., administered via caudal vein injection under the acute respiratory distress syndrome model; HK: Mesenchymal stromal cells cultured in medium from Cytoniche, administered via caudal vein injection in the acute respiratory distress syndrome model.
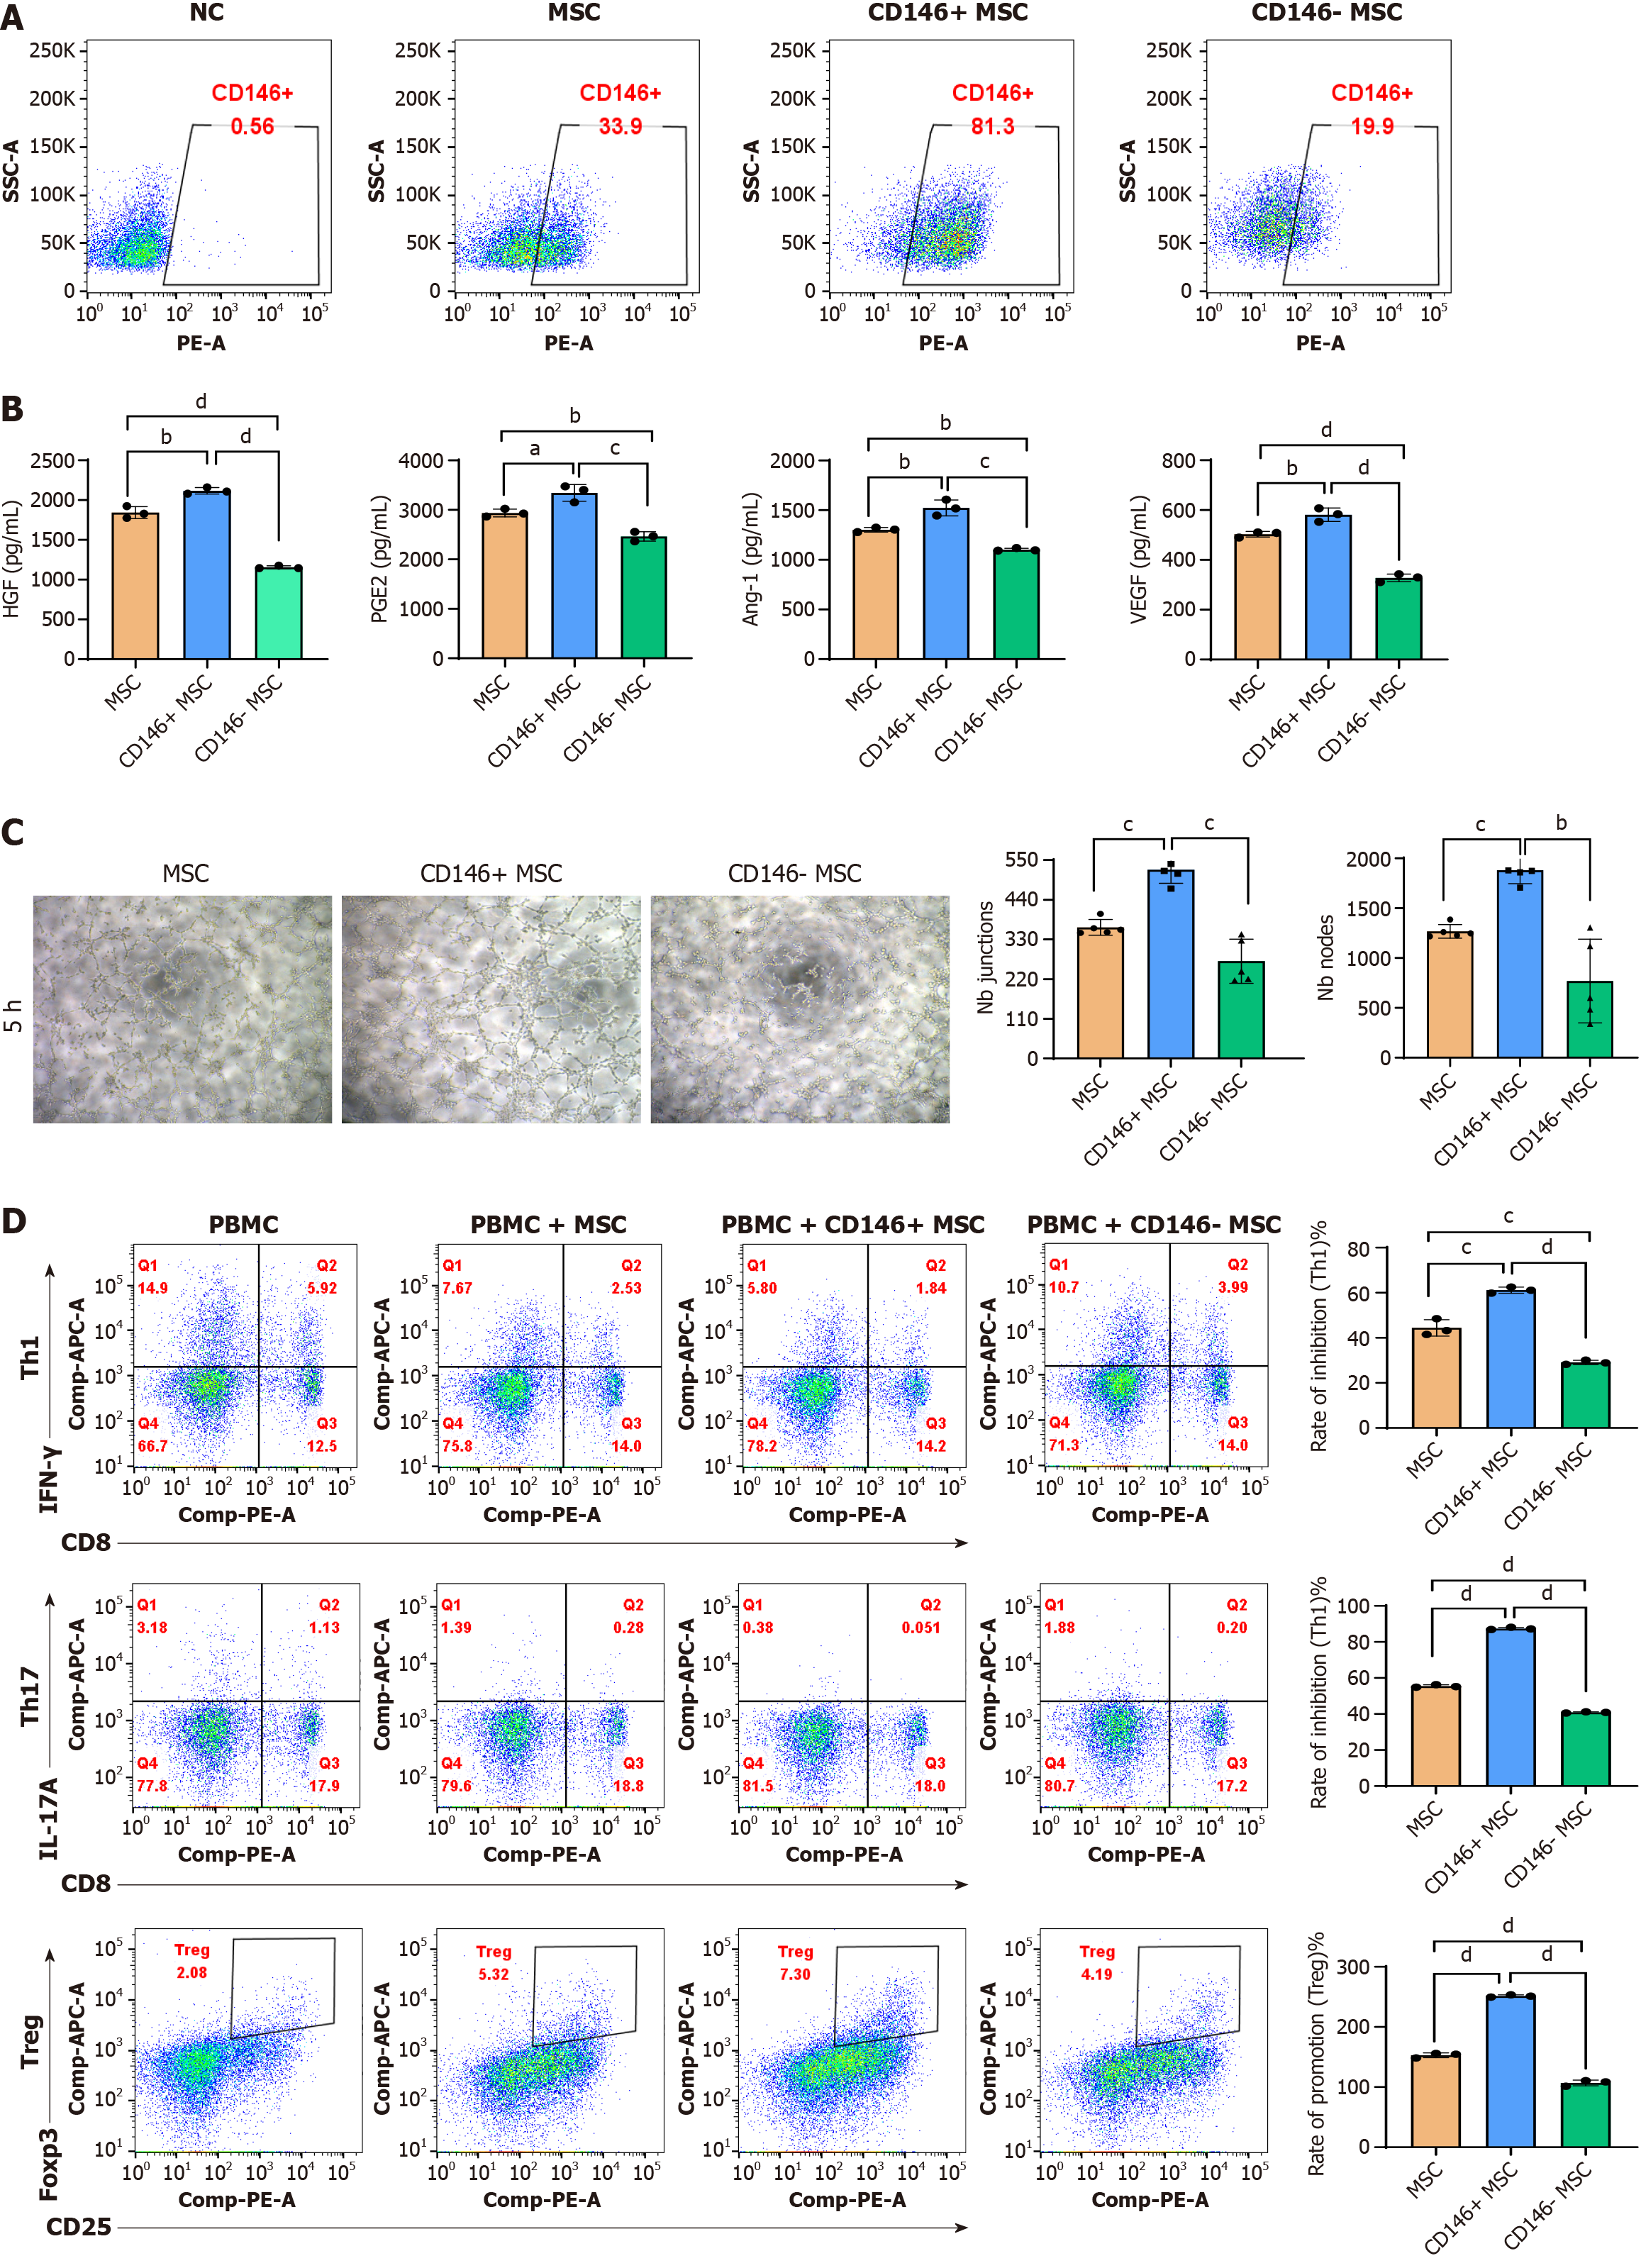
Figure 3 Biological characteristics of the CD146+/- mesenchymal stromal cell subpopulation.
A: CD146+ mesenchymal stromal cells (MSCs) and CD146- MSCs were isolated via magnetic bead sorting, and the proportion of CD146+ and CD146- MSCs increased from 32.1% to 68.7%; B: Enzyme-linked immunosorbent assay analysis of hepatocyte growth factor, prostaglandin E2, angiopoietin-1, and vascular endothelial growth factor levels in MSCs; C: Human umbilical vein endothelial cells were cultured alone or with either CD146+ MSCs or CD146- MSCs. Cord formation was evaluated at 5 hours post-seeding. Junctions and nodes were quantified at 5 hours and compared with those in the human umbilical vein endothelial cell-only group; D: In vitro immunomodulation by CD146+ MSCs and CD146- MSCs. T helper type 1/T helper type 17/regulatory T cells were cocultured with CD146+ MSCs and CD146- MSCs for 18 hours/3 days. T-cell analysis was performed via flow cytometry. The data are presented as the means ± SD and were analyzed via two-sided Student’s t tests. n = 3, aP < 0.05, bP < 0.01, cP < 0.001, dP < 0.0001. NC: Negative control; MSC: Mesenchymal stromal cell; HGF: Hepatocyte growth factor; PGE2: Prostaglandin E2; Ang-1: Angiopoietin-1; VEGF: Vascular endothelial growth factor; Th1: T helper type 1; Th17: T helper type 17; Treg: Regulatory T; IFN: Interferon; IL: Interleukin.
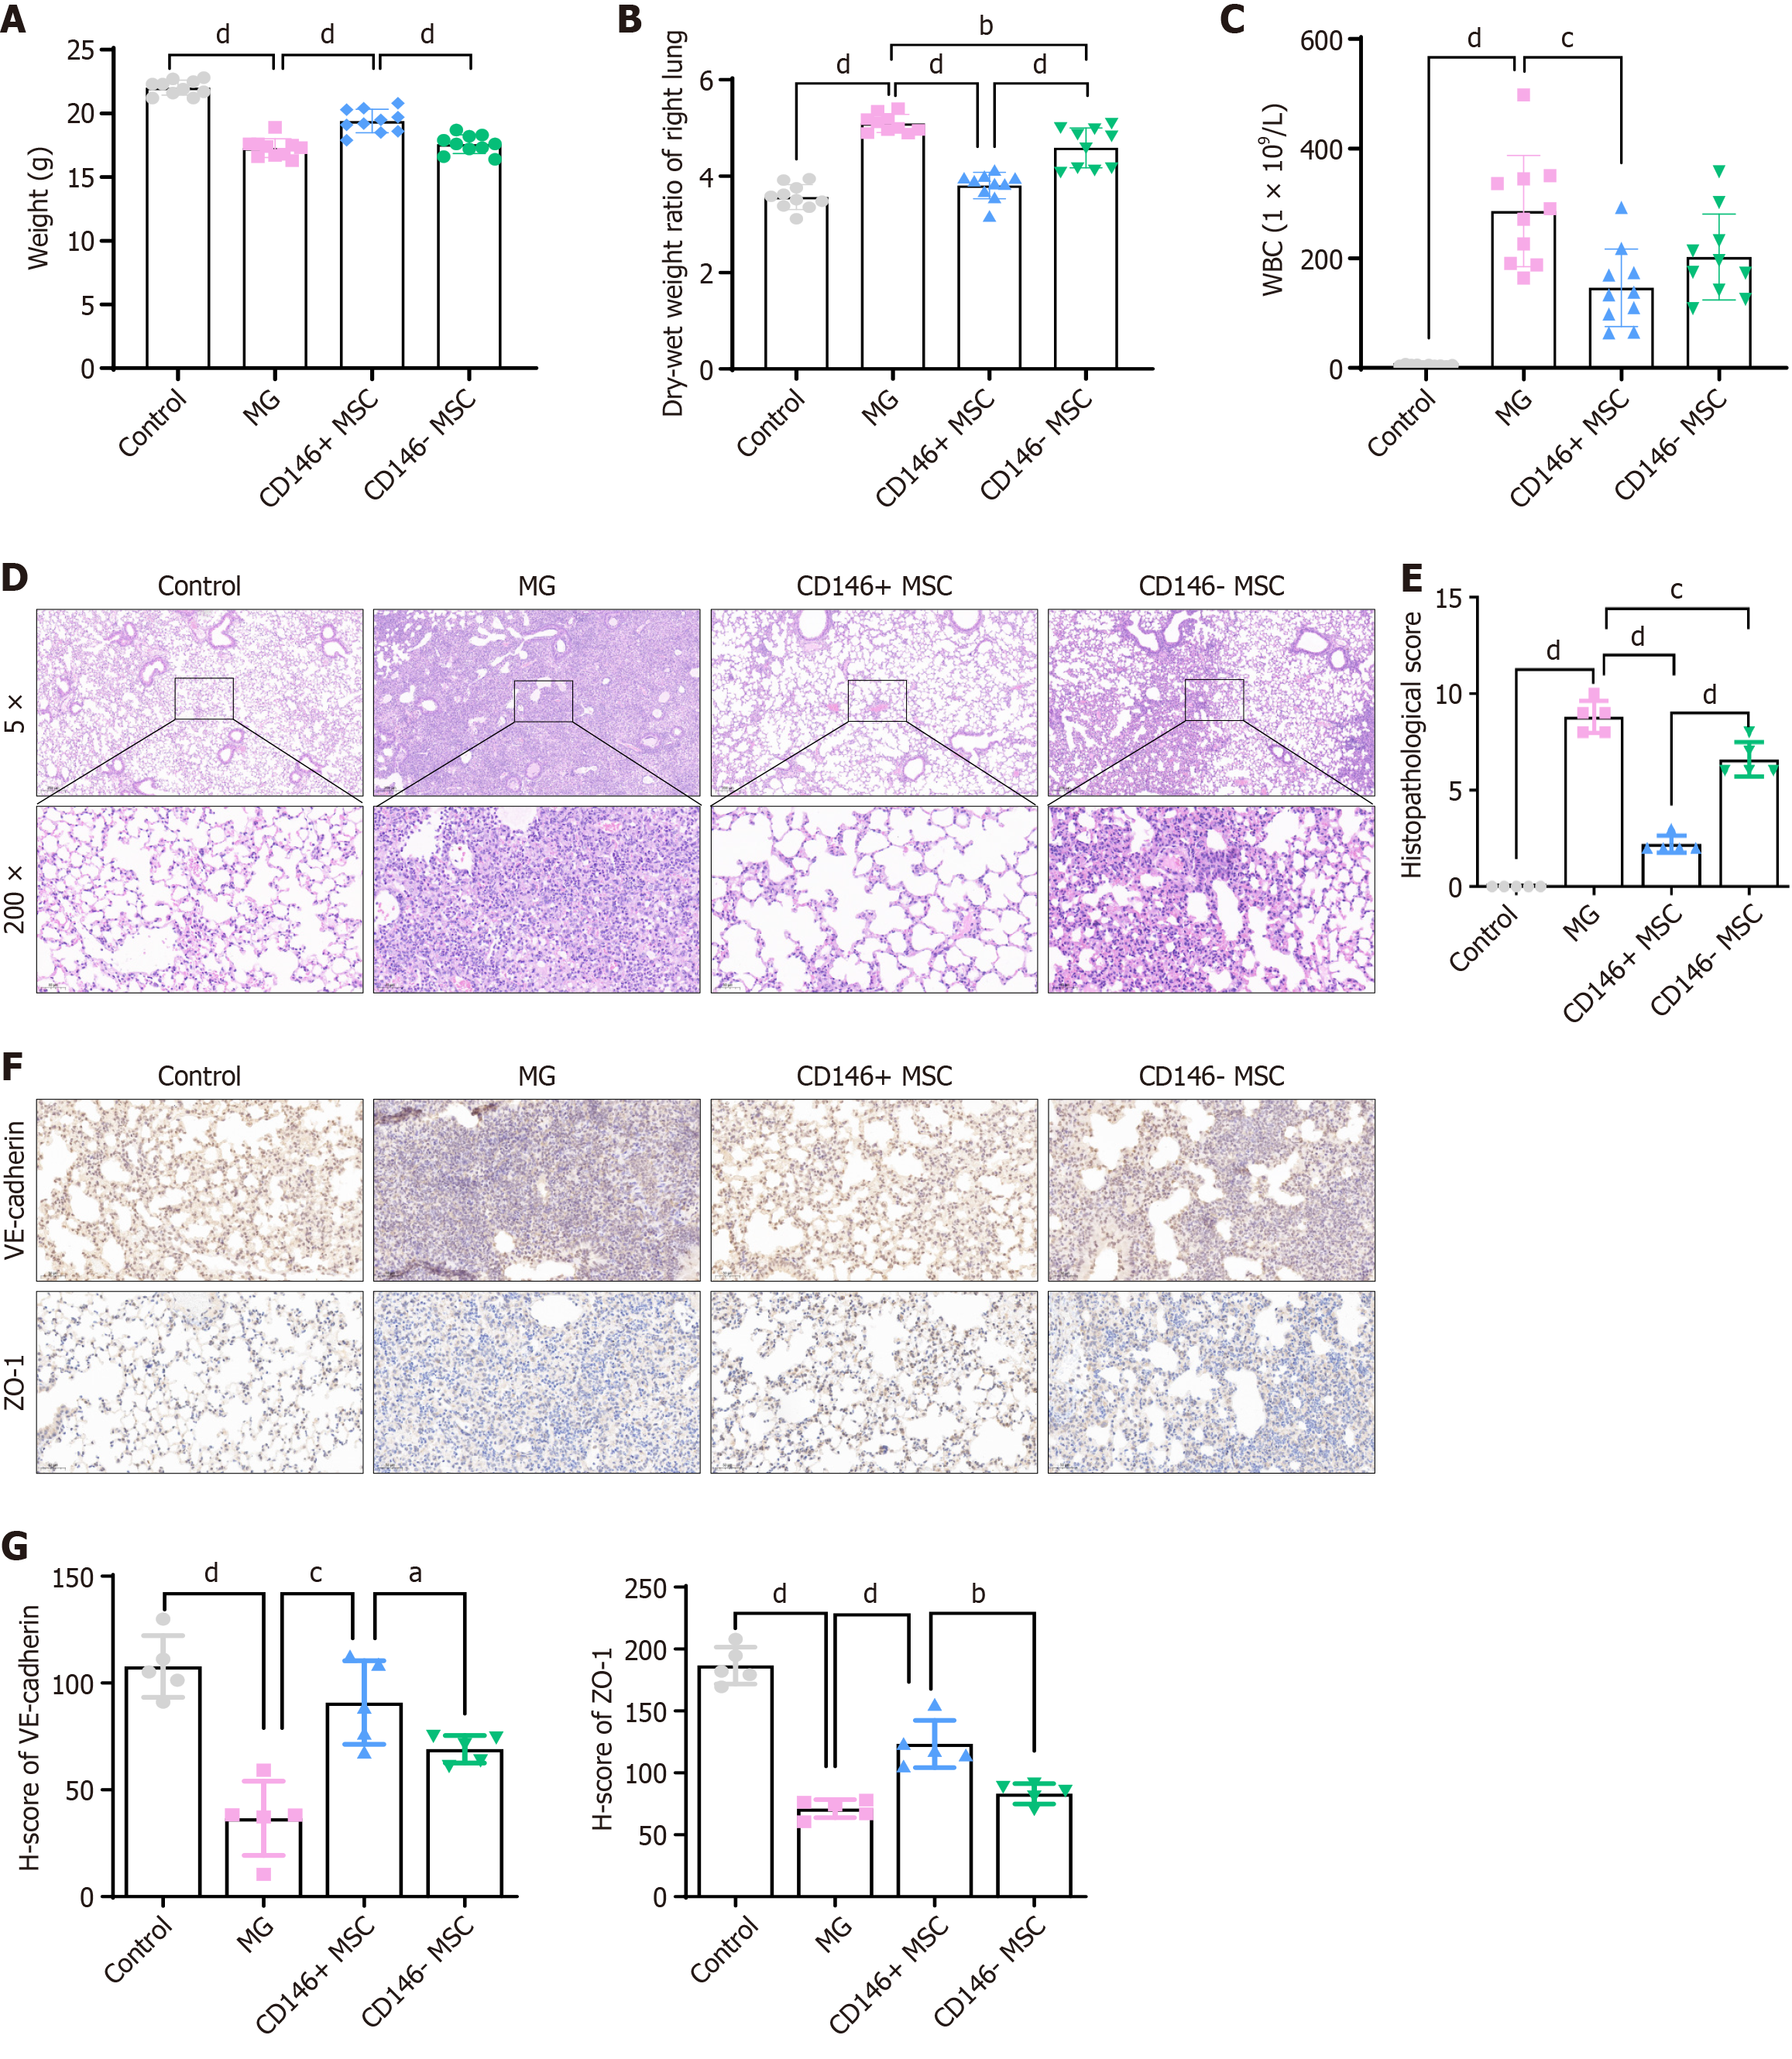
Figure 4 Therapeutic effects on acute respiratory distress syndrome after injection of CD146+ mesenchymal stromal cells and caffeic acid phenethyl ester pretreated CD146+ mesenchymal stromal cells.
A and B: Comparison of body weight (A) and wet-dry ratio (B) of lung tissue across groups (n = 10 per group); C: White blood cell counts in bronchoalveolar lavage fluid were measured at the experimental endpoint (n = 10 per group); D and E: Representative images of pathological changes and lung injury scores (E) in the lung tissue of each group (n = 5 per group); F: Representative immunohistochemical images of VE-cadherin and zonula occludens-1 staining in different groups; G: H-scores of VE-cadherin and zonula occludens-1 in mouse lung tissues. The data are presented as the means ± SD and were analyzed via two-sided Student’s t tests.aP < 0.05, bP < 0.01, cP < 0.001, dP < 0.0001. WBC: White blood cell; MG: Model control (vehicle administered via caudal vein injection after establishing the acute respiratory distress syndrome model; MSC: Mesenchymal stromal cell; ZO-1: Zonula occludens-1.
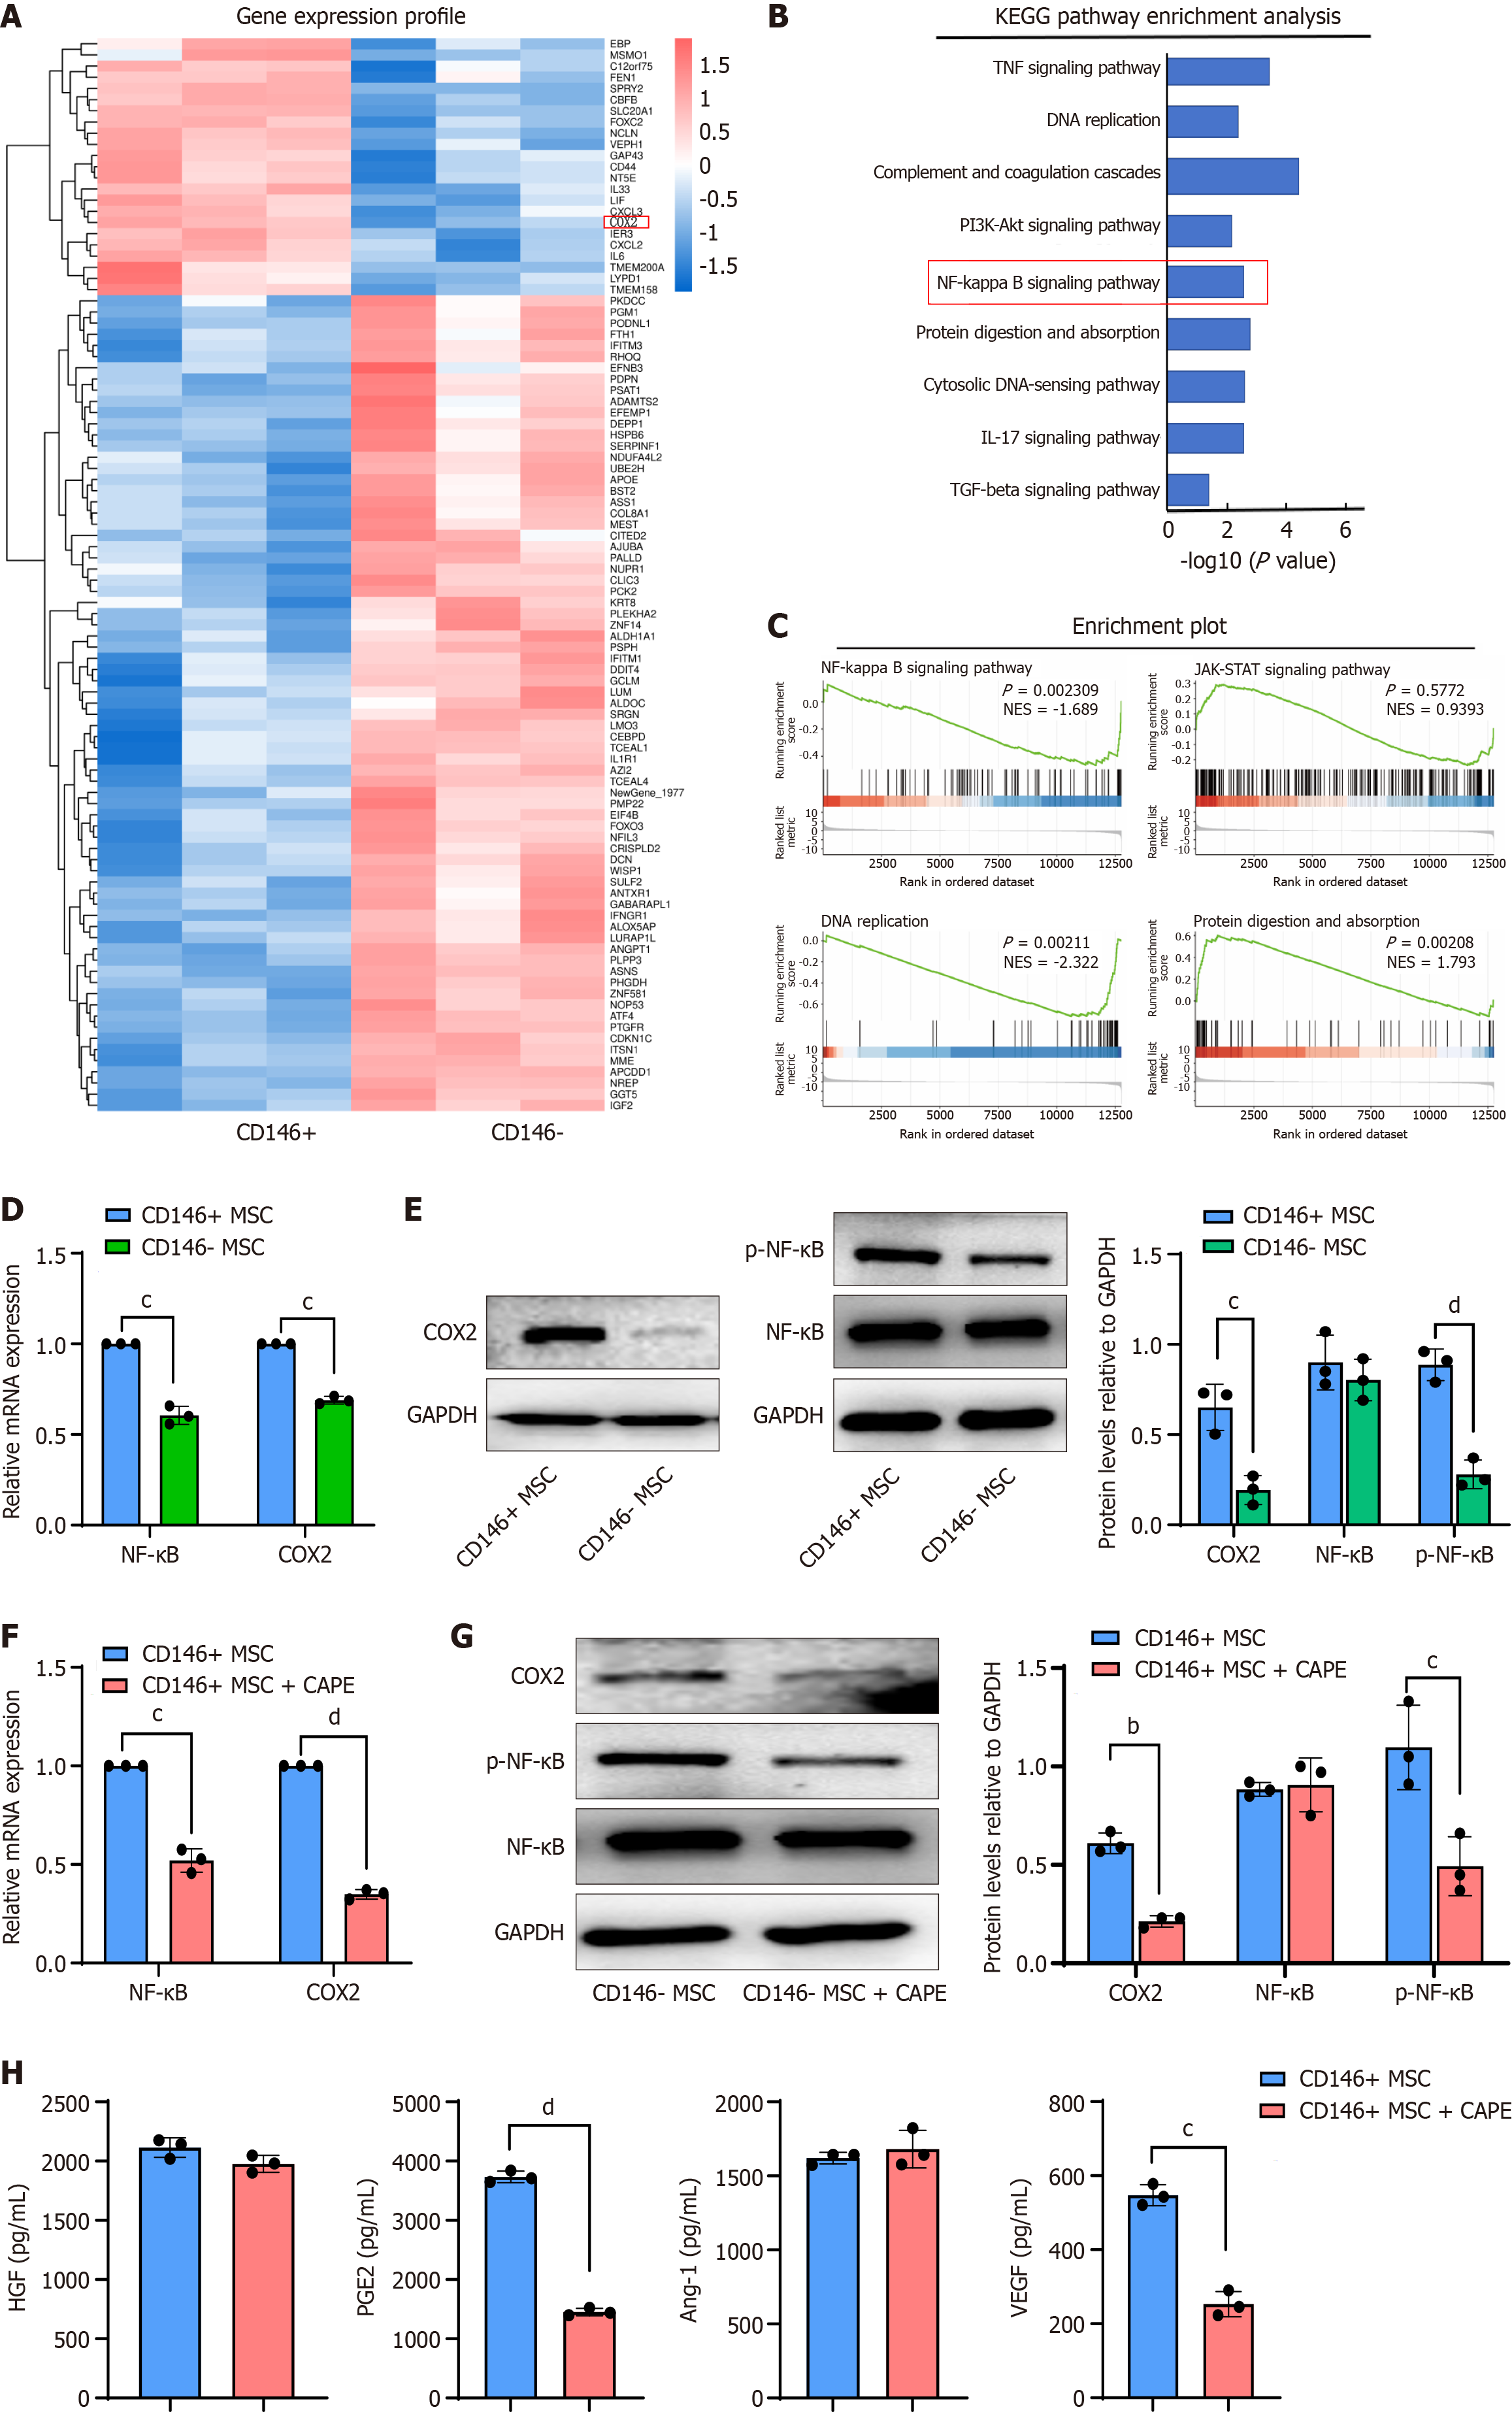
Figure 5 Transcriptomic analysis of mesenchymal stromal cells and validation.
A: Heatmap displaying genes differentially expressed between CD146+ mesenchymal stromal cells (MSCs) and CD146- MSCs; B: Kyoto Encyclopedia of Genes and Genomes enrichment analysis demonstrating that differentially expressed genes are enriched in distinct signaling pathways between CD146+ MSCs and CD146- MSCs; C: Gene set enrichment analysis was performed on the differentially expressed genes; D: Cyclooxygenase 2 (COX2) and nuclear factor kappa B (NF-κB) mRNA levels in CD146+ MSCs and CD146- MSCs were quantified by reverse transcription-quantitative polymerase chain reaction; E: Western blot analysis of COX2, NF-κB, and p-NF-κB protein levels; F: COX2 and NF-κB mRNA levels in CD146+ MSCs treated with caffeic acid phenethyl ester (CAPE) for 24 hours were detected by reverse transcription-quantitative polymerase chain reaction. The band density was compared to that of the control and normalized to that of GAPDH using densitometry; G: The protein levels of COX2, NF-κB, and p-NF-κB were detected by western blot in CD146+ MSCs treated with CAPE for 24 hours. Band density was compared to that of the control and normalized to that of GAPDH via densitometry; H: Enzyme-linked immunosorbent assay analysis of hepatocyte growth factor, prostaglandin E2, angiopoietin-1, and vascular endothelial growth factor expression in CD146+ MSCs after treatment with CAPE for 24 hours. Data are presented as the means ± SD and were analyzed by two-sided Student’s t tests. n = 3. aP < 0.05, bP < 0.01, cP < 0.001, dP < 0.0001. KEGG: Kyoto Encyclopedia of Genes and Genomes; TNF: Tumor necrosis factor; PI3K: Phosphoinositide 3-kinases; IL: Interleukin; TGF: Transforming growth factor; MSC: Mesenchymal stromal cell; NF-κB: Nuclear factor kappa B; COX2: Cyclooxygenase 2; CAPE: Caffeic acid phenethyl ester; HGF: Hepatocyte growth factor; PGE2: Prostaglandin E2; Ang-1: Angiopoietin-1; VEGF: Vascular endothelial growth factor.
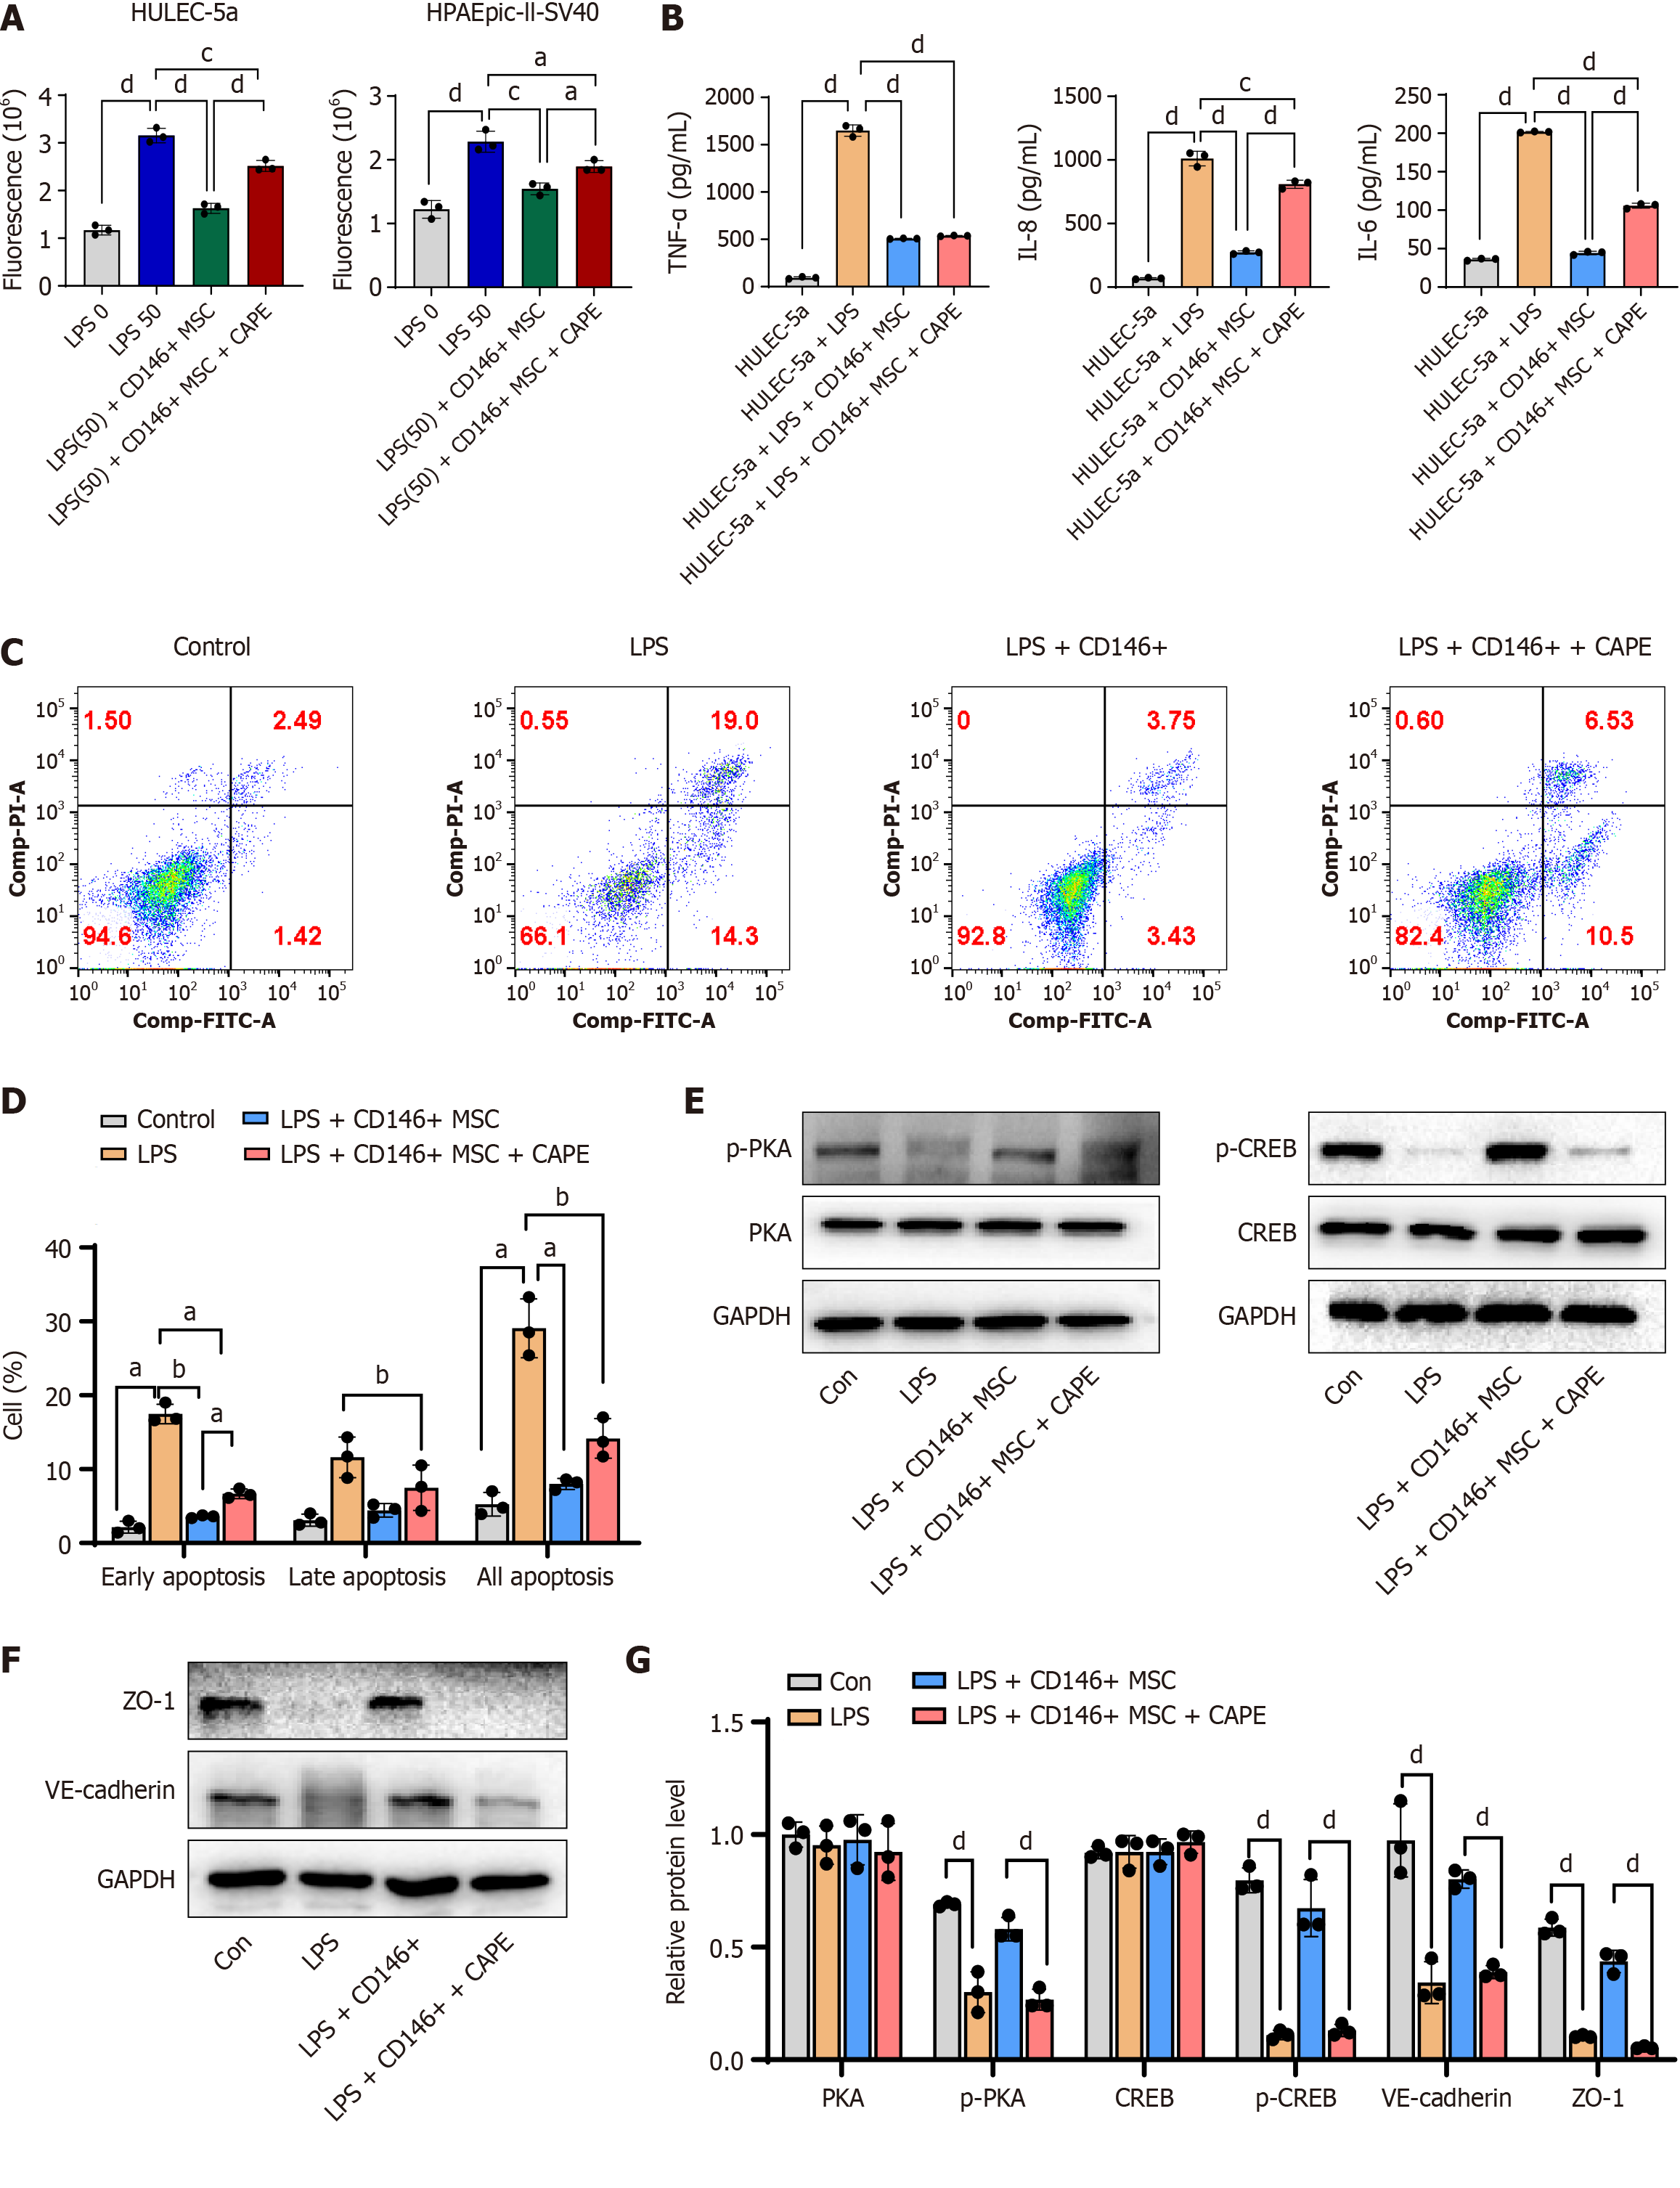
Figure 6 The nuclear factor kappa B inhibitor caffeic acid phenethyl ester reverses the improvement effect of CD146+ mesenchymal stromal cells on pulmonary endothelial barrier injury in acute respiratory distress syndrome.
A: Permeability of HULEC-5a/HPAEpic-II-SV40 cells cocultured with CD146+ mesenchymal stromal cells (MSCs) and treated with caffeic acid phenethyl ester for 24 hours; B: The expression of tumor necrosis factor-α, interleukin-8, and interleukin-6 in HULEC-5a cells was measured via enzyme-linked immunosorbent assay; C: HULEC-5a cell apoptosis was assessed by Annexin V-FITC and propidium iodide double-staining, followed by flow cytometry analysis after treatment with CD146+ MSCs + caffeic acid phenethyl ester for 24 hours. Representative flow cytometry patterns from different groups are shown; D: Cell apoptosis was measured by Annexin V-APC and propidium iodide double staining and flow cytometric analysis. Representative flow cytometry patterns from different groups are shown. The percentages of apoptotic cells in the different groups were calculated according to the flow cytometric results; E: Protein levels of protein kinase A, phospho-protein kinase A, cyclic-AMP response element-binding protein, phospho-cyclic-AMP response element-binding protein; F: Western blot analysis of zonula occludens-1, VE-cadherin, and GAPDH protein expression in HULVE-a cells after lipopolysaccharide (LPS)-induced modeling (24 hours) and different treatments; G: The density of each individual band was compared to that of the corresponding control band and normalized to that of GAPDH by densitometry. Groups: Control, LPS, LPS + CD146+ MSC, and LPS + CD146+ MSC + caffeic acid phenethyl ester. The data are presented as the mean ± SD and were analyzed by two-sided Student’s t tests. n = 3. aP < 0.05, bP < 0.01, cP < 0.001, dP < 0.0001. LPS: Lipopolysaccharide; TNF: Tumor necrosis factor; IL: Interleukin; CAPE: Caffeic acid phenethyl ester; MSC: Mesenchymal stromal cell; PKA: Protein kinase A; CREB: Cyclic-AMP response element-binding protein; ZO-1: Zonula occludens-1.
- Citation: Zhang YL, Wen DK, Wang SN, Tan Y, Ma HR. Melanoma cell adhesion molecule-positive mesenchymal stromal cells alleviate acute respiratory distress syndrome via nuclear factor kappa-B-mediated paracrine regulation. World J Stem Cells 2025; 17(10): 109284
- URL: https://www.wjgnet.com/1948-0210/full/v17/i10/109284.htm
- DOI: https://dx.doi.org/10.4252/wjsc.v17.i10.109284


