Copyright
©The Author(s) 2024.
World J Stem Cells. Jun 26, 2024; 16(6): 708-727
Published online Jun 26, 2024. doi: 10.4252/wjsc.v16.i6.708
Published online Jun 26, 2024. doi: 10.4252/wjsc.v16.i6.708
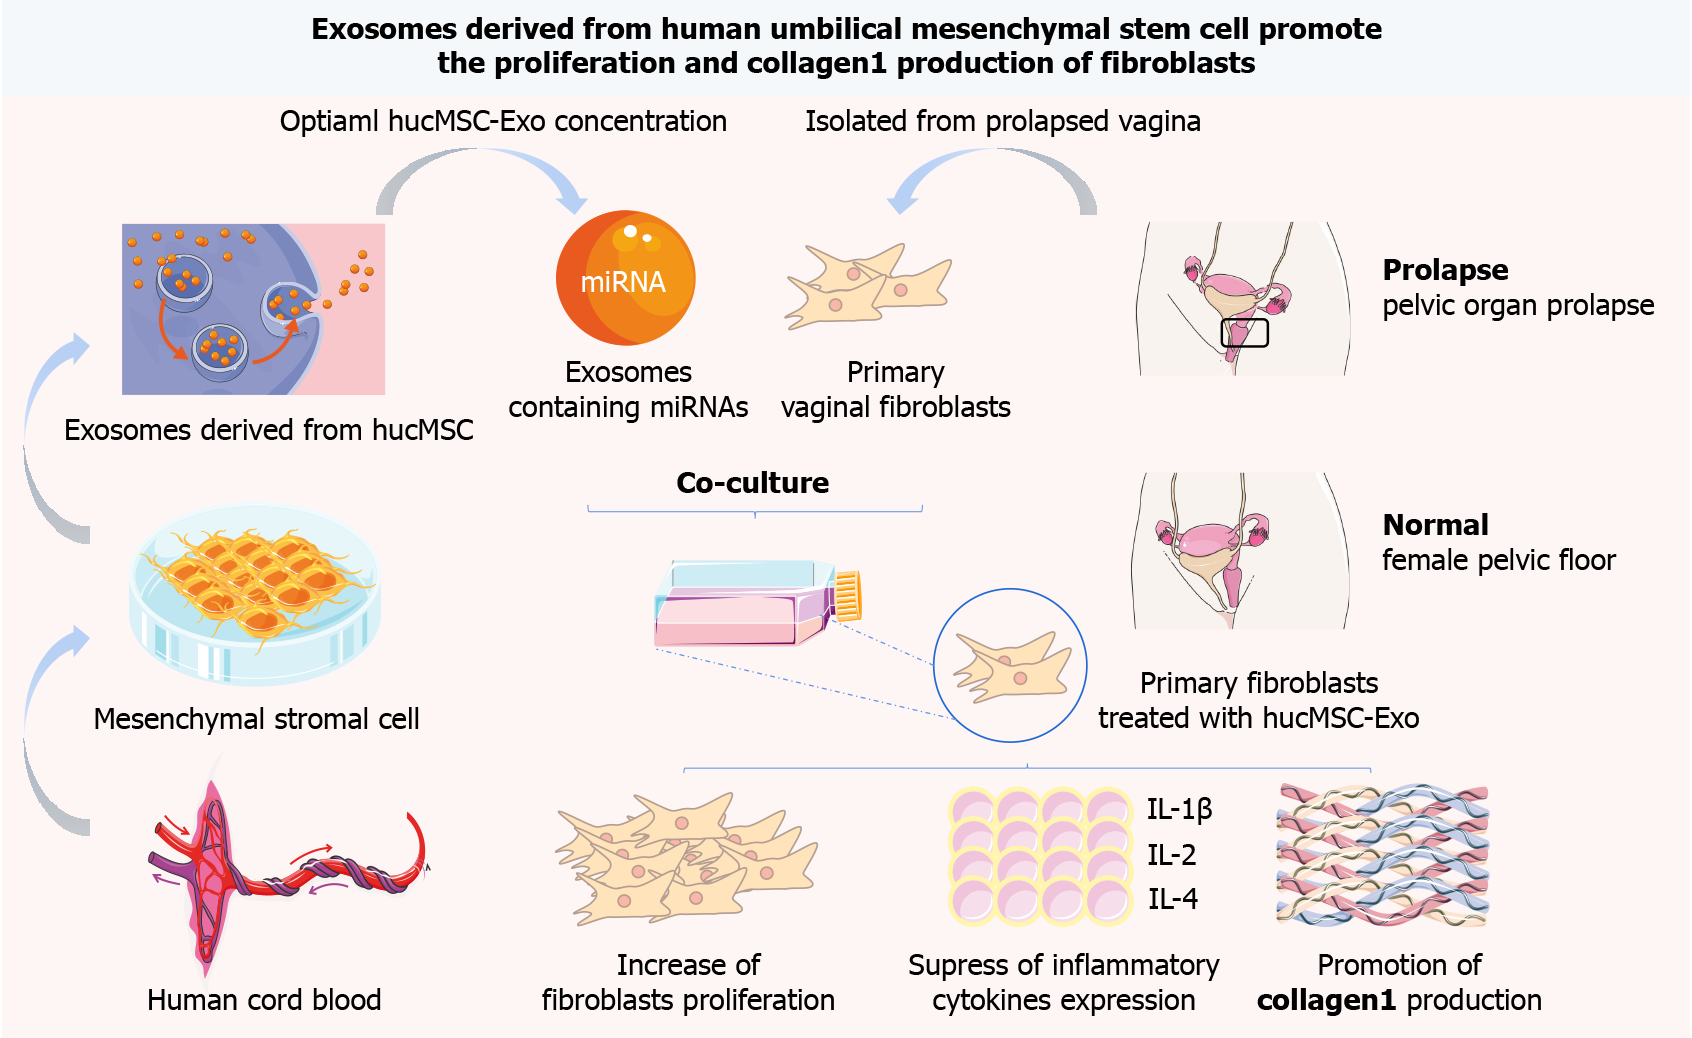
Figure 1 Human umbilical cord mesenchymal stromal cell-derived exosome promote the growth and collagen production of primary vaginal fibroblasts from patients with pelvic organ prolapse through microRNAs.
hucMSC-Exo: Human umbilical cord mesenchymal stromal cell-derived exosome; miRNA: MicroRNA; hucMSCs: Human umbilical cord mesenchymal stromal cells; IL: Interleukin.
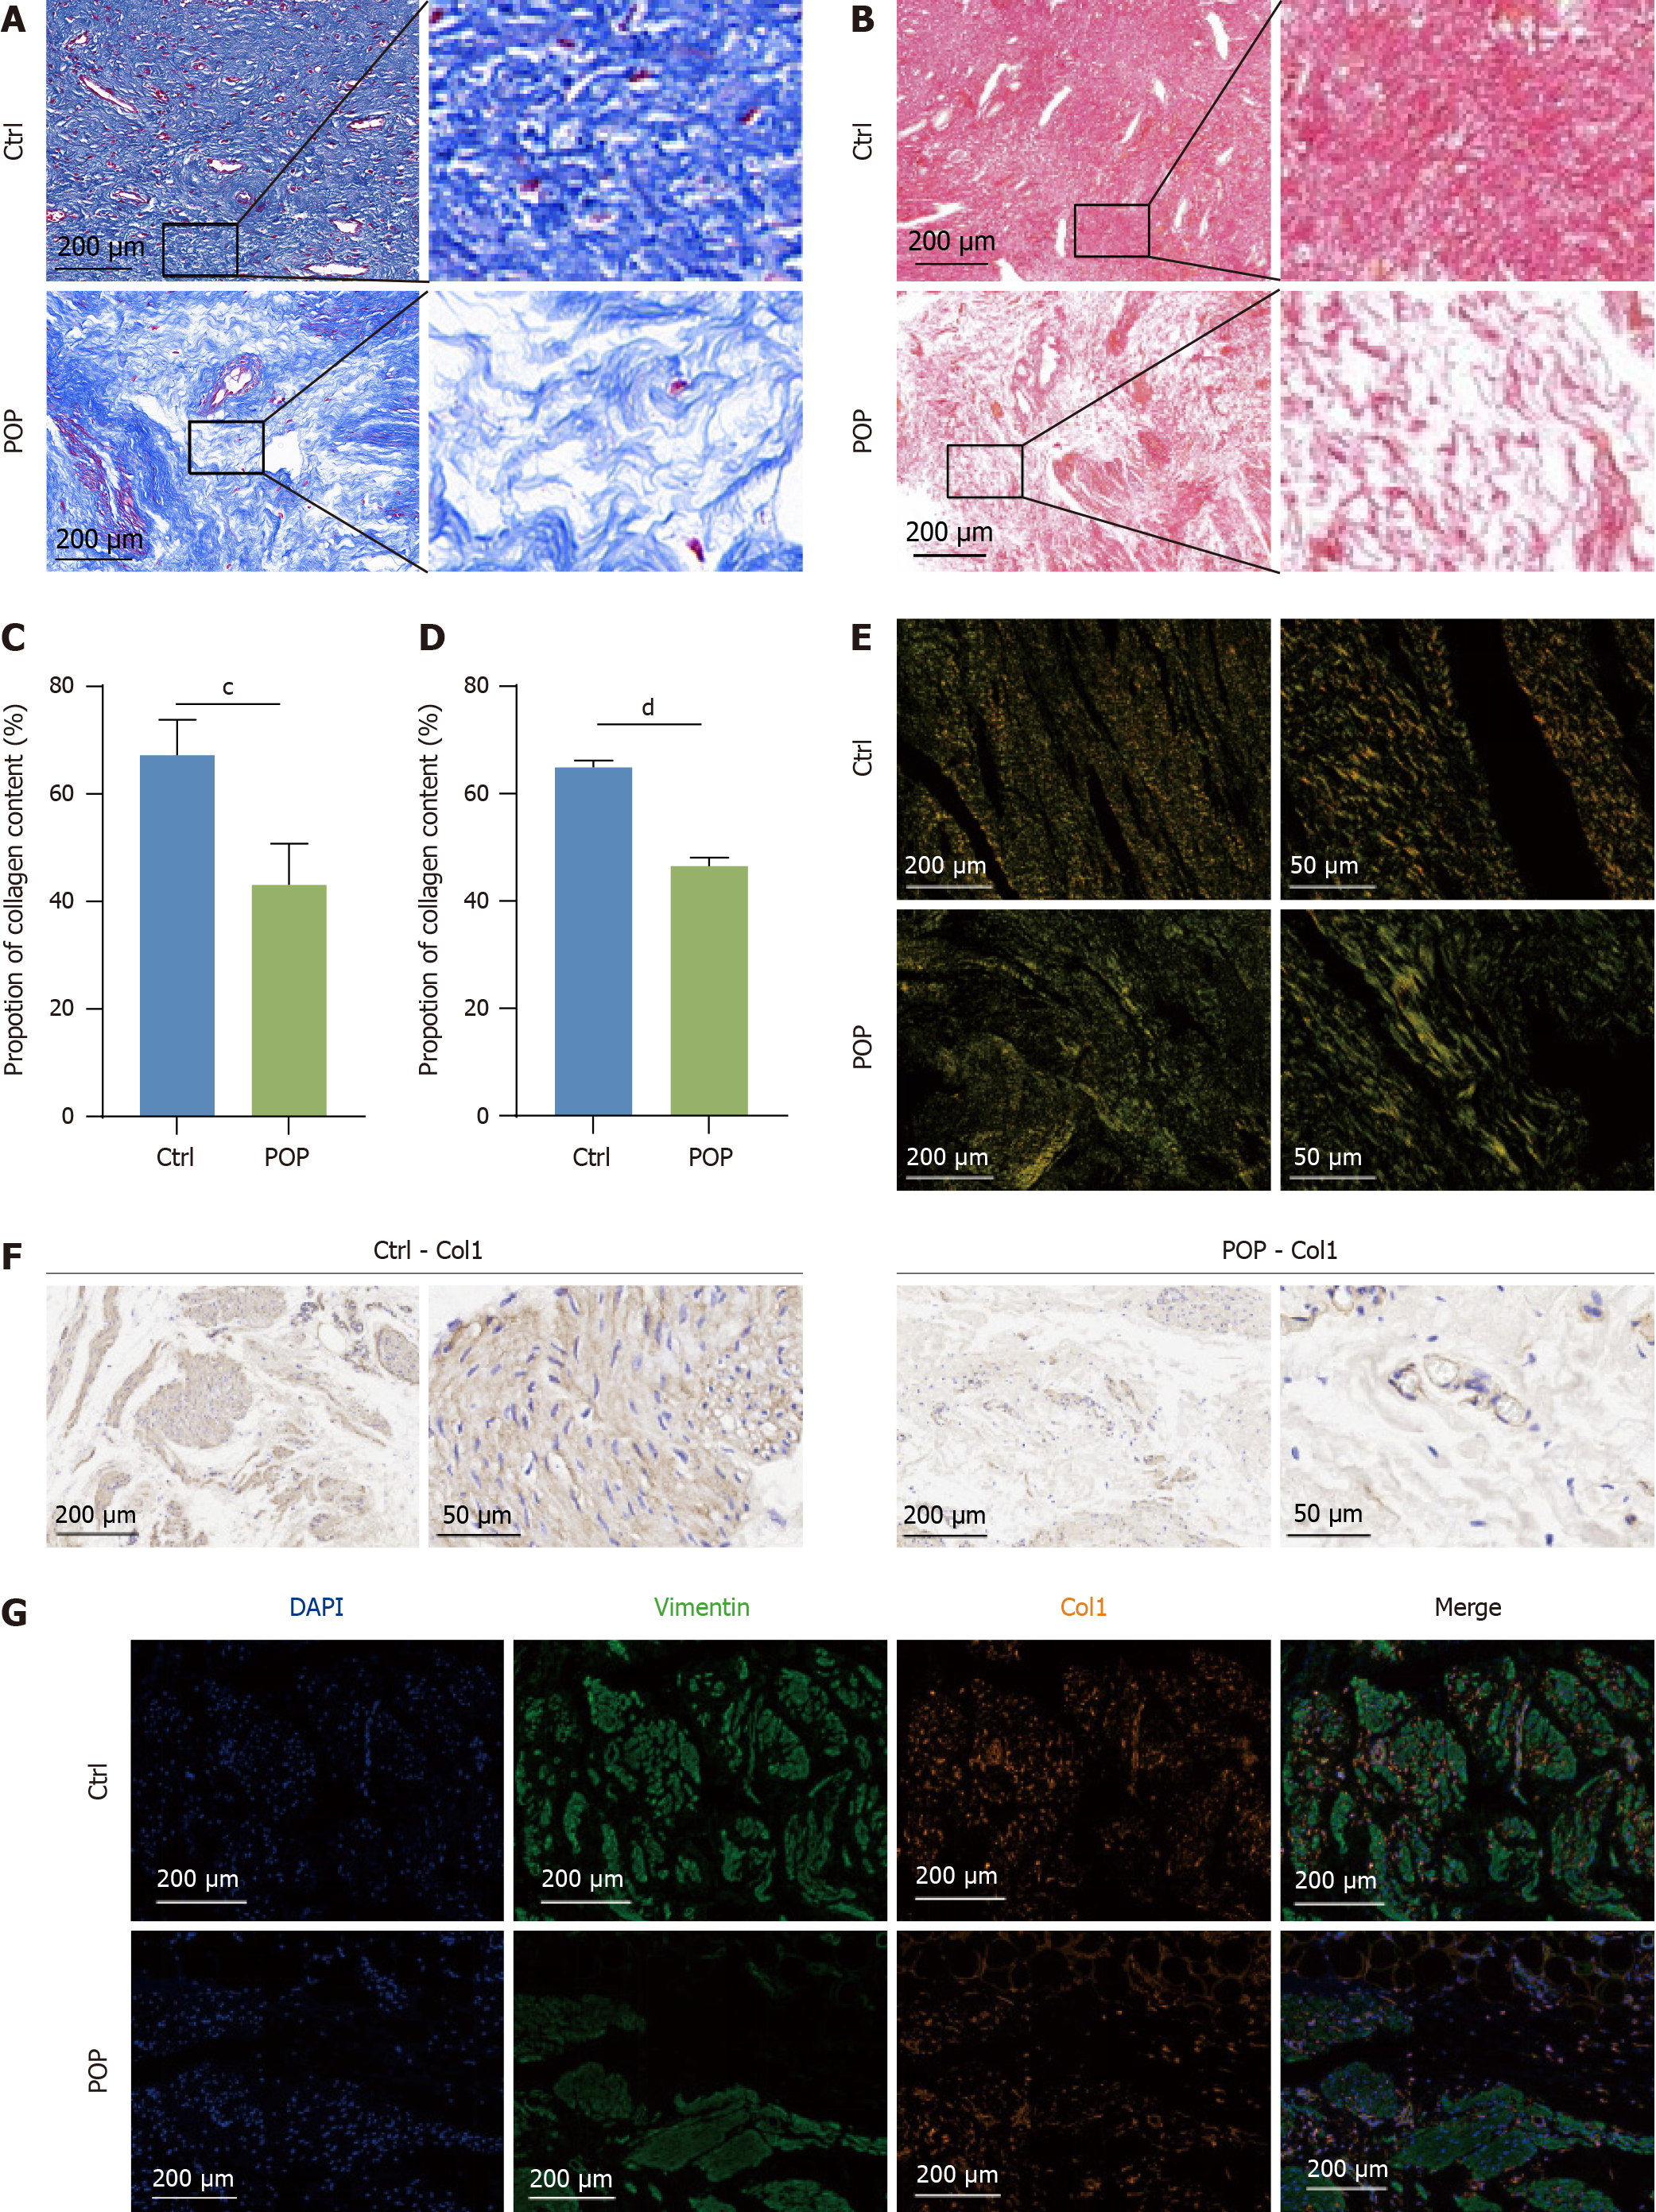
Figure 2 Differences in human vaginal collagen deposition between patients with and without pelvic organ prolapse.
Disordered collagen fibers in the pelvic organ prolapse vaginal wall. A: Masson’s trichrome staining images of vaginal tissues; B: Images of vaginal tissues stained with Sirius Red were collected by brightfield microscopy; C and D: Quantification of the collagen content in A and B; E: Sirius Red-stained tissues were scanned via polarized light microscopy; F: Representative immunohistochemistry images showing the distribution of Col1 in the human vaginal wall; G: Immunofluorescence showing the expression of Col1 and vimentin (a fibroblast marker) in the human vaginal wall. cP < 0.001; dP < 0.0001. POP: Pelvic organ prolapse.
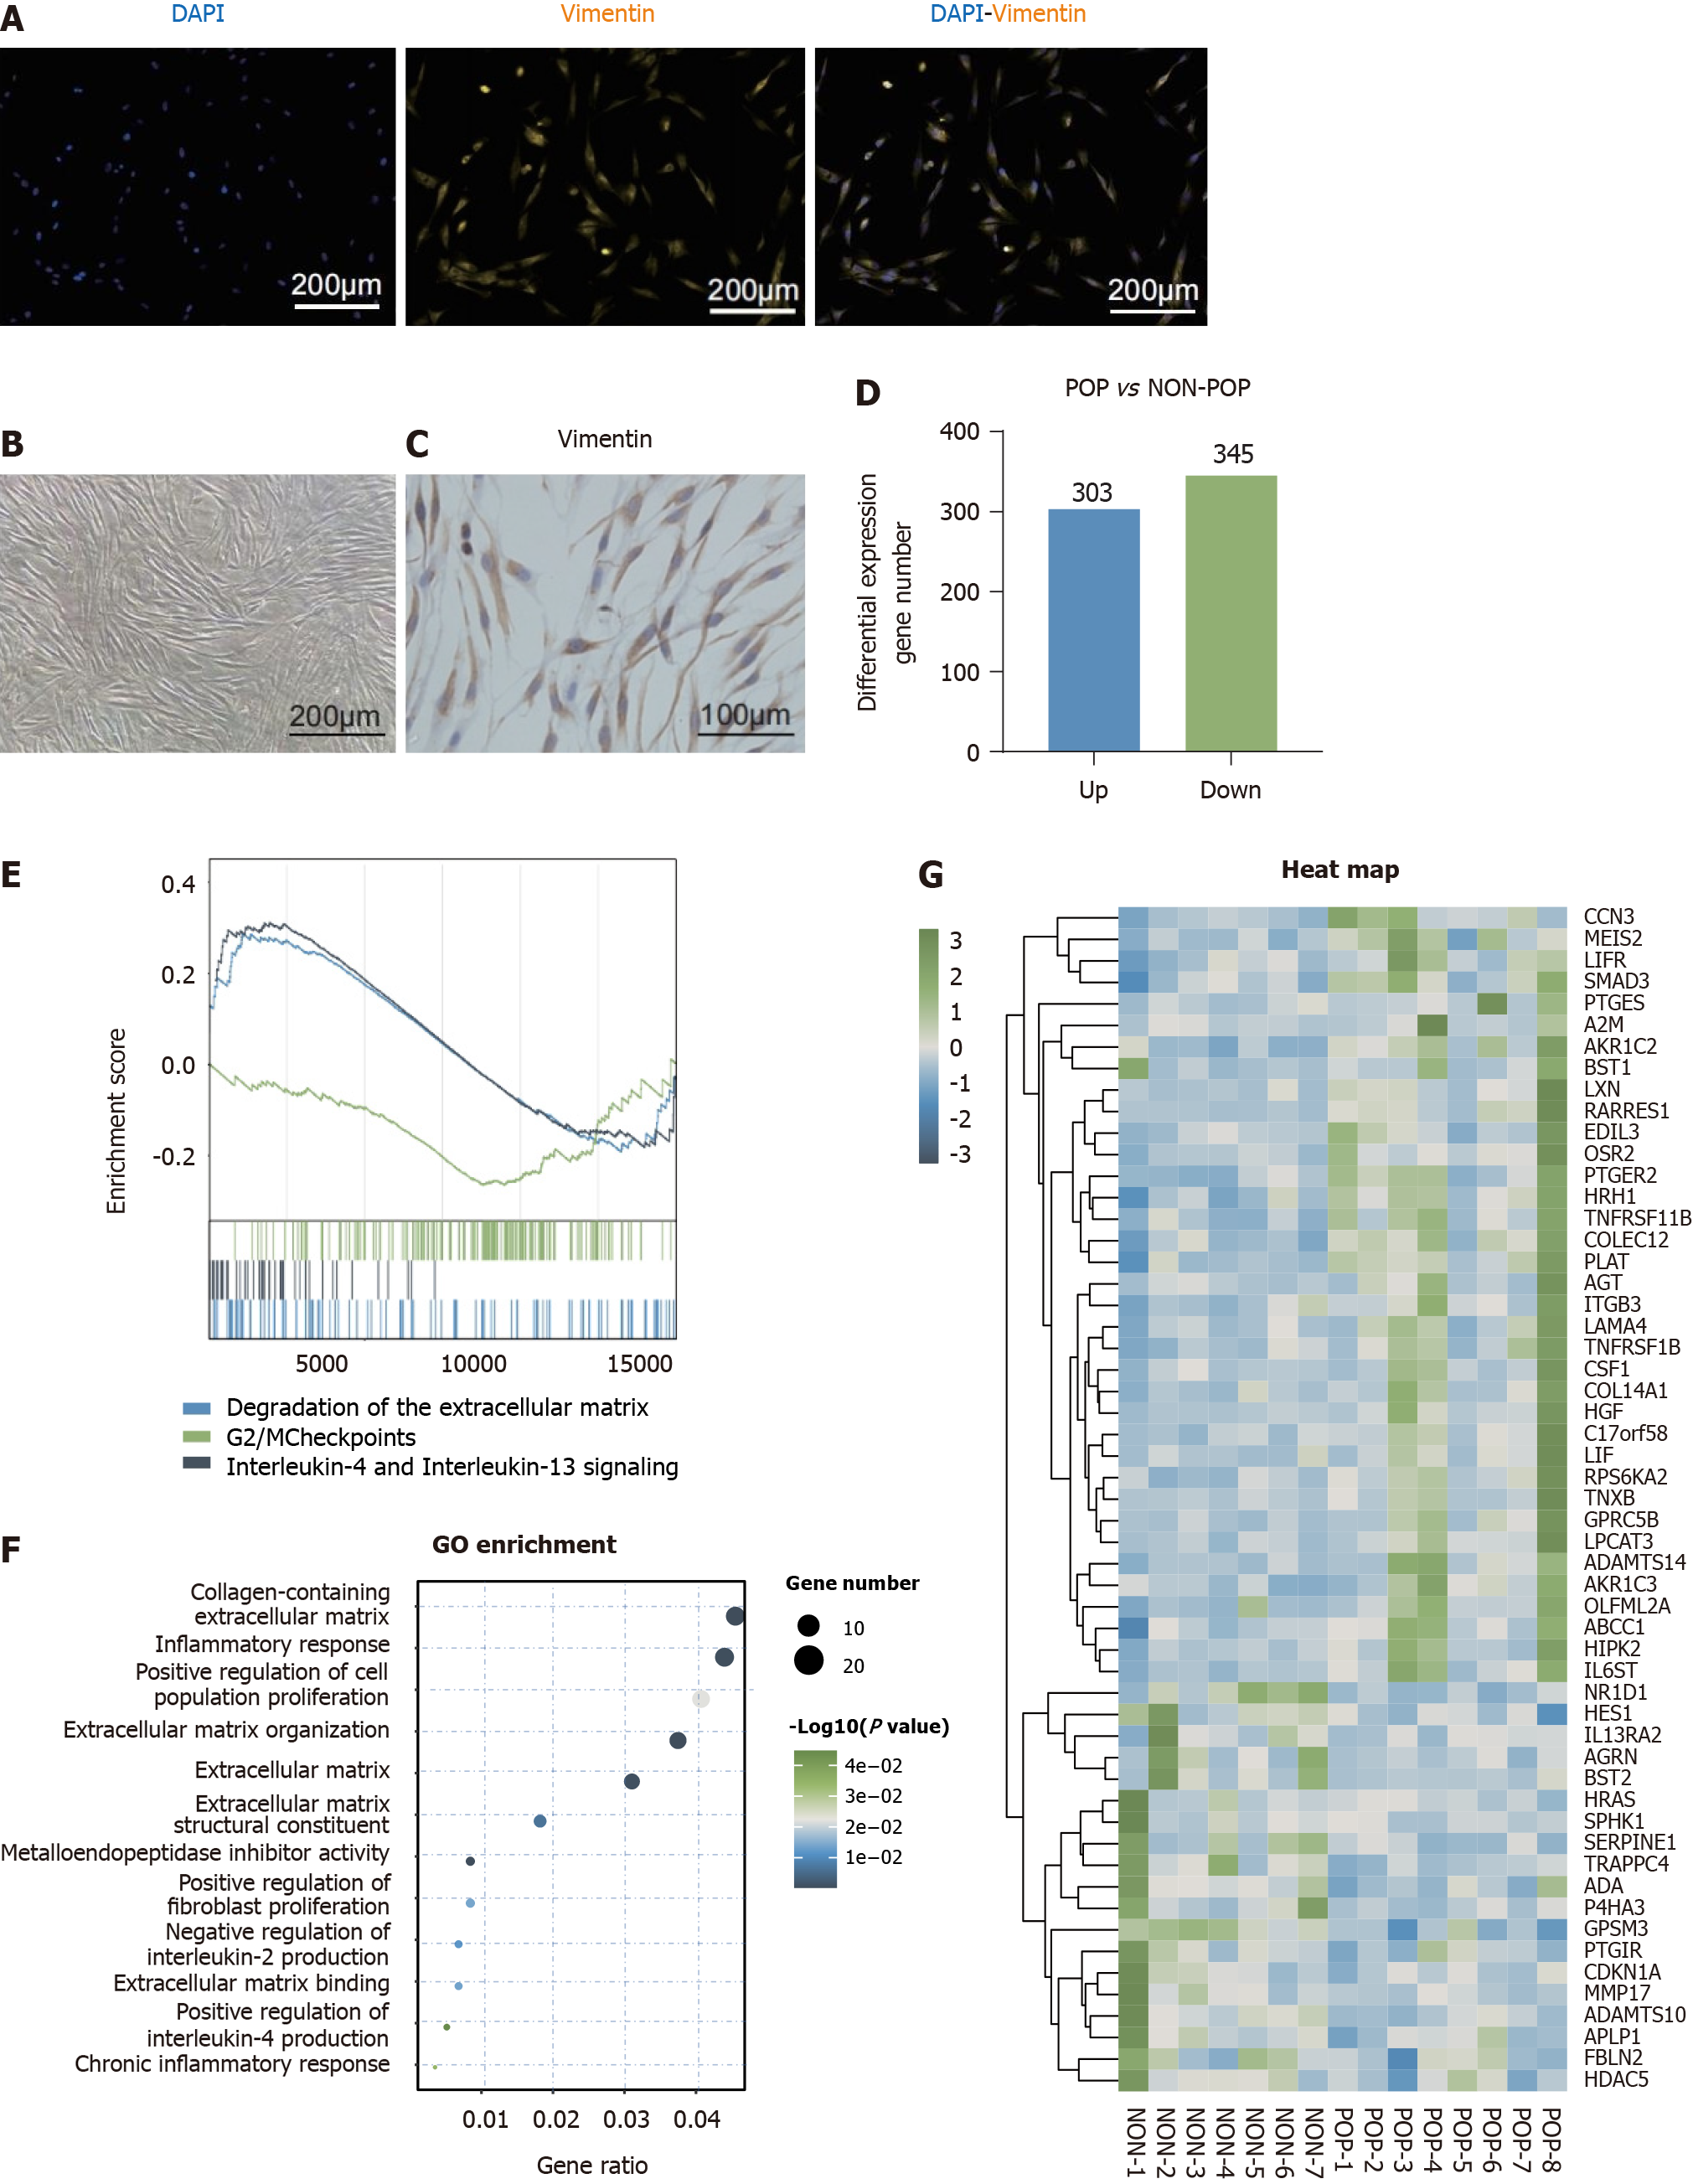
Figure 3 Differences in the gene expression profiles of human primary vaginal fibroblasts between the pelvic organ prolapse and non-pelvic organ prolapse groups.
A: Images of primary vaginal fibroblasts for immunofluorescence; B: Images of primary vaginal fibroblasts for brightfield microscopy; C: Images of primary vaginal fibroblasts for immunohistochemistry; D: Number of differentially expressed genes (DEGs) between the pelvic organ prolapse (POP) and non-POP groups (fold change > 1.5, P < 0.05); E: Transcriptomic data were analyzed by Gene set enrichment analysis (false discovery rate > 0.25, P < 0.05); F: The above DEGs were further analyzed using Gene Ontology analysis (P < 0.05); G: Heatmaps were generated to show the DEGs of the two groups with respect to the previously mentioned terms. POP: Pelvic organ prolapse; GO: Gene Ontology.
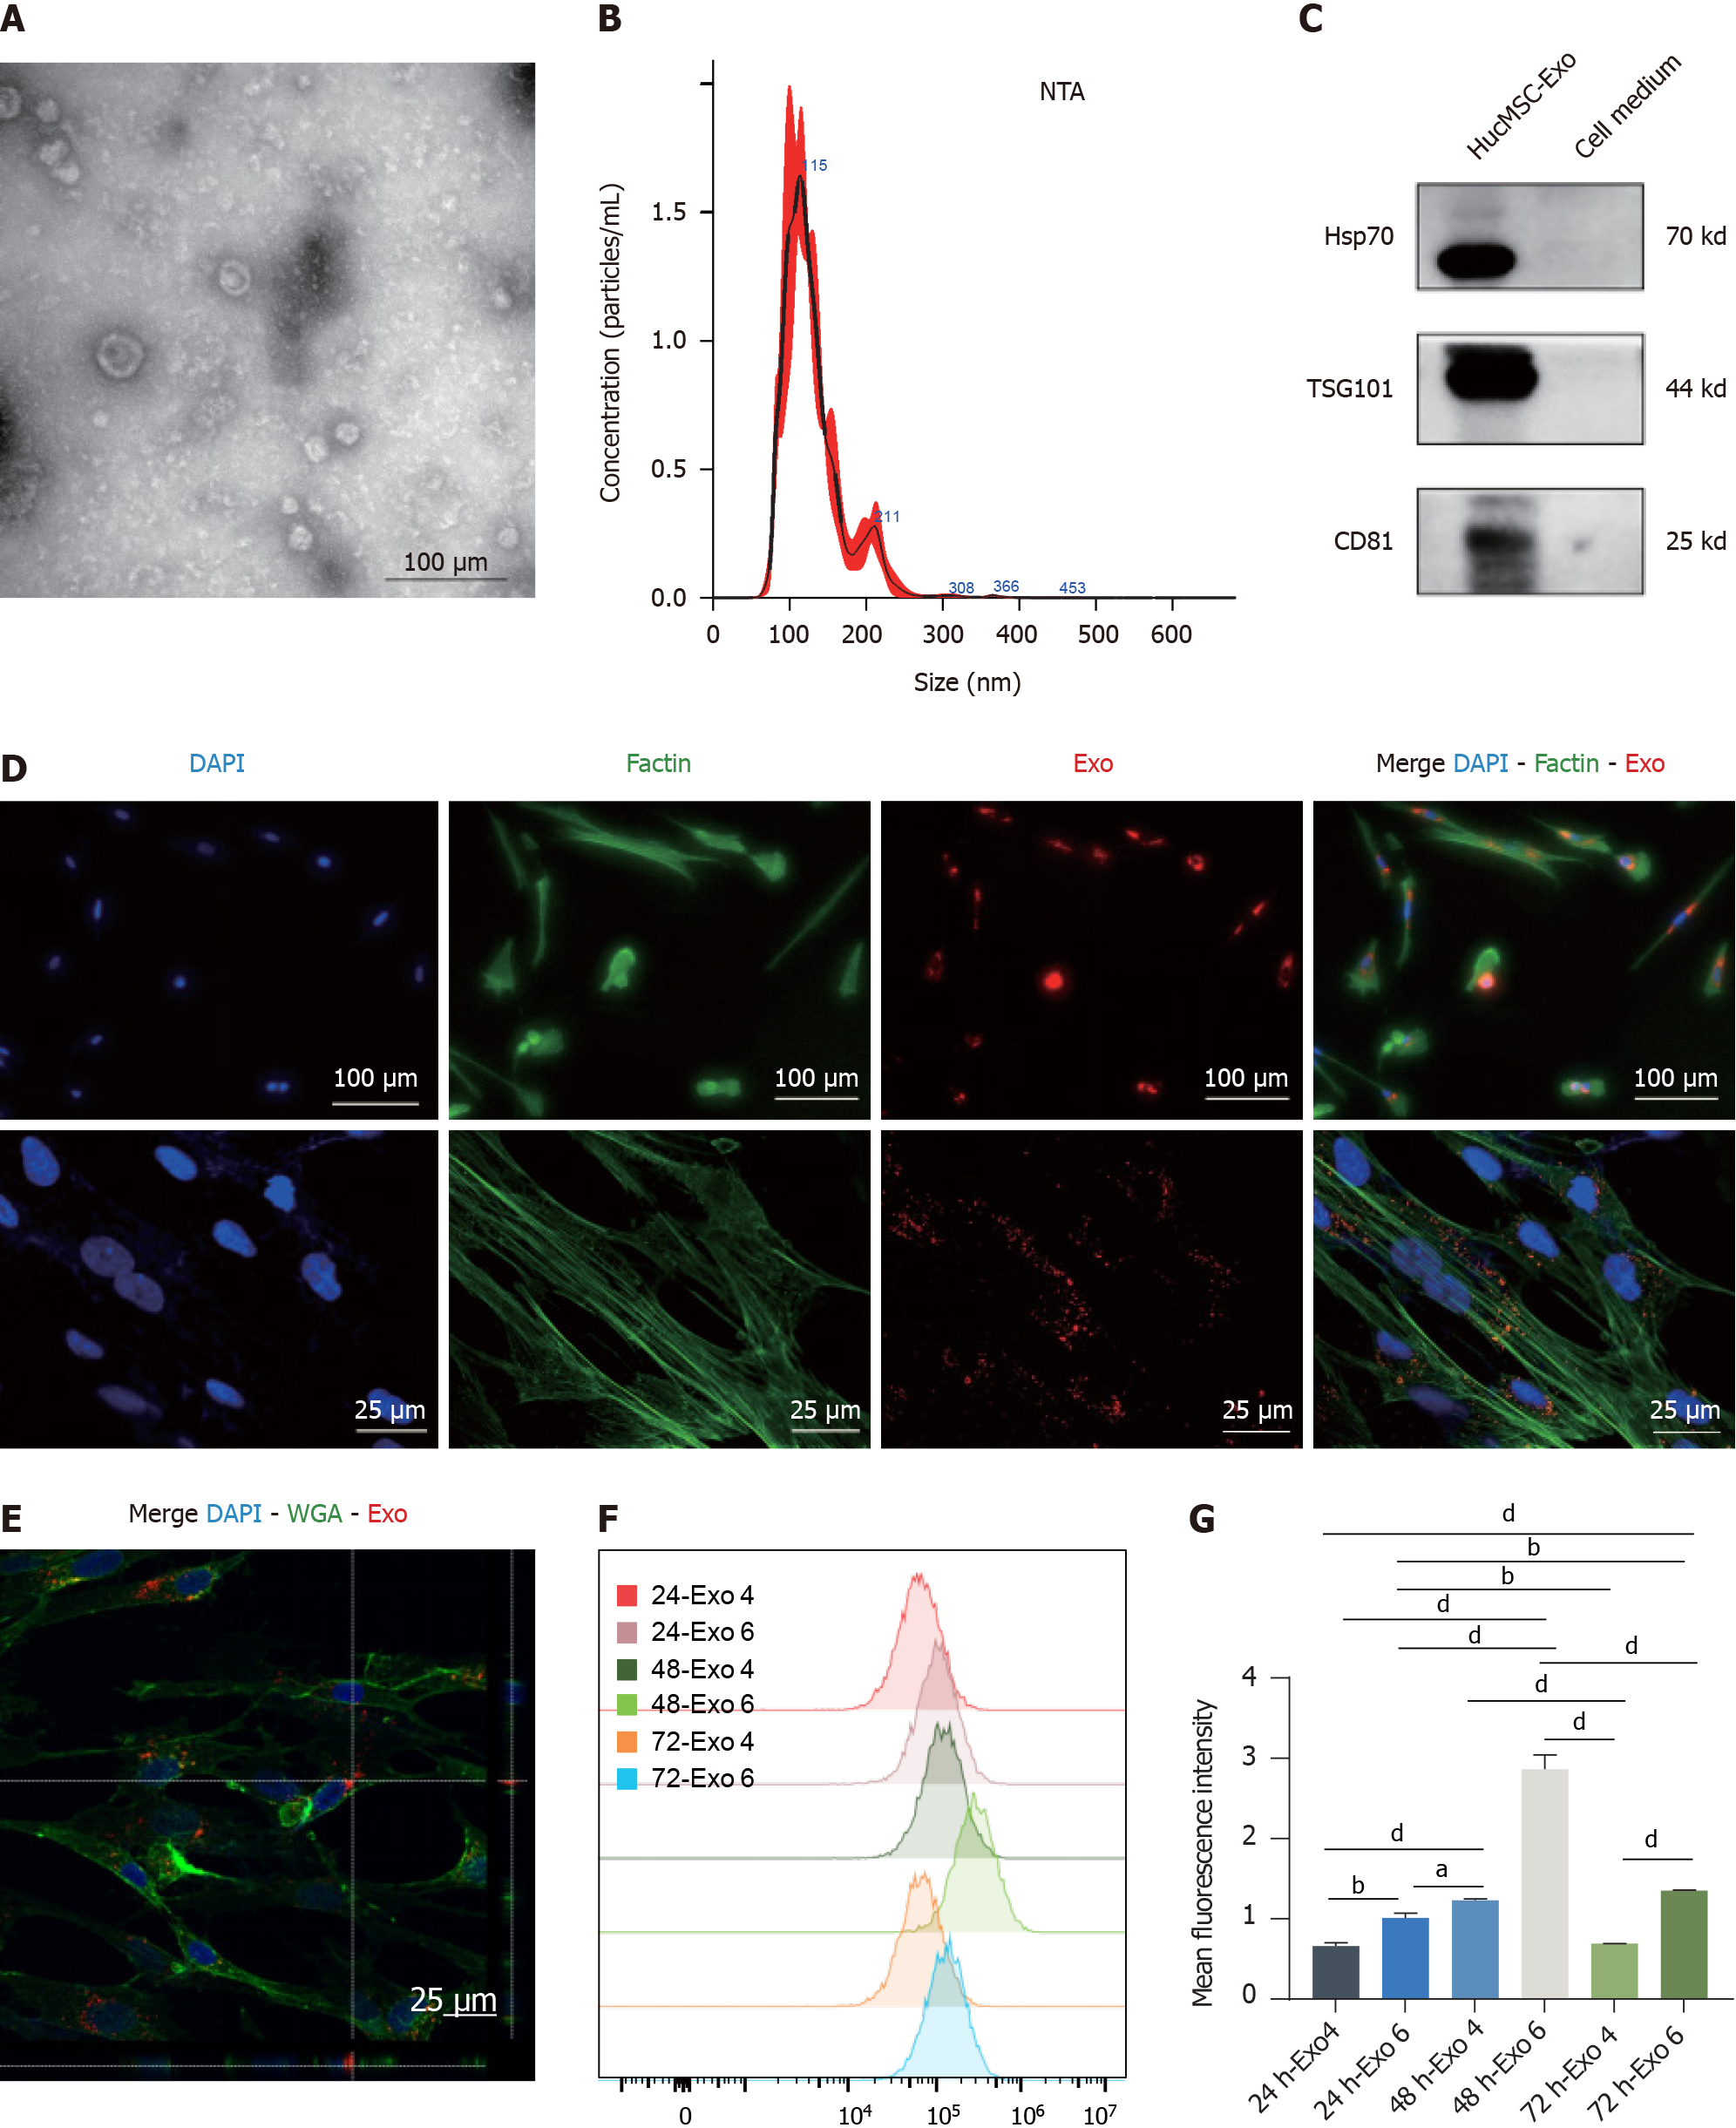
Figure 4 Identification and internalization of human umbilical cord mesenchymal stromal cell-derived exosomes.
A: TEM was utilized to obtain representative images of human umbilical cord mesenchymal stromal cell-derived exosome (hucMSC-Exo) (scale bar: 200 μm); B: NTA of the size distribution and concentration of hucMSC-Exo; C: Western blot analysis for the detection of the hucMSC-Exo surface markers heat shock protein 70, TSG101, and CD81; D: Observation of PKH-26-hucMSC-Exo internalization by fibroblasts via both fluorescence microscopy and laser confocal microscopy; E: The 3D image of hucMSC-Exo internalized by fibroblasts; F and G: The median fluorescence intensity (F) and quantification (G) of hucMSC-Exo uptaken by fibroblasts with 4 μg/mL and 6 μg/mL after treatment for 24, 48, and 72 h via FCM. DAPI is blue, PKH26 is red, F-actin is green in D, Wheat germ agglutinin is green in E. Scale bars: 50 μm and 25 μm. aP < 0.05; bP < 0.01; dP < 0.0001. HSP: Heat shock protein; Exo: Exosome.
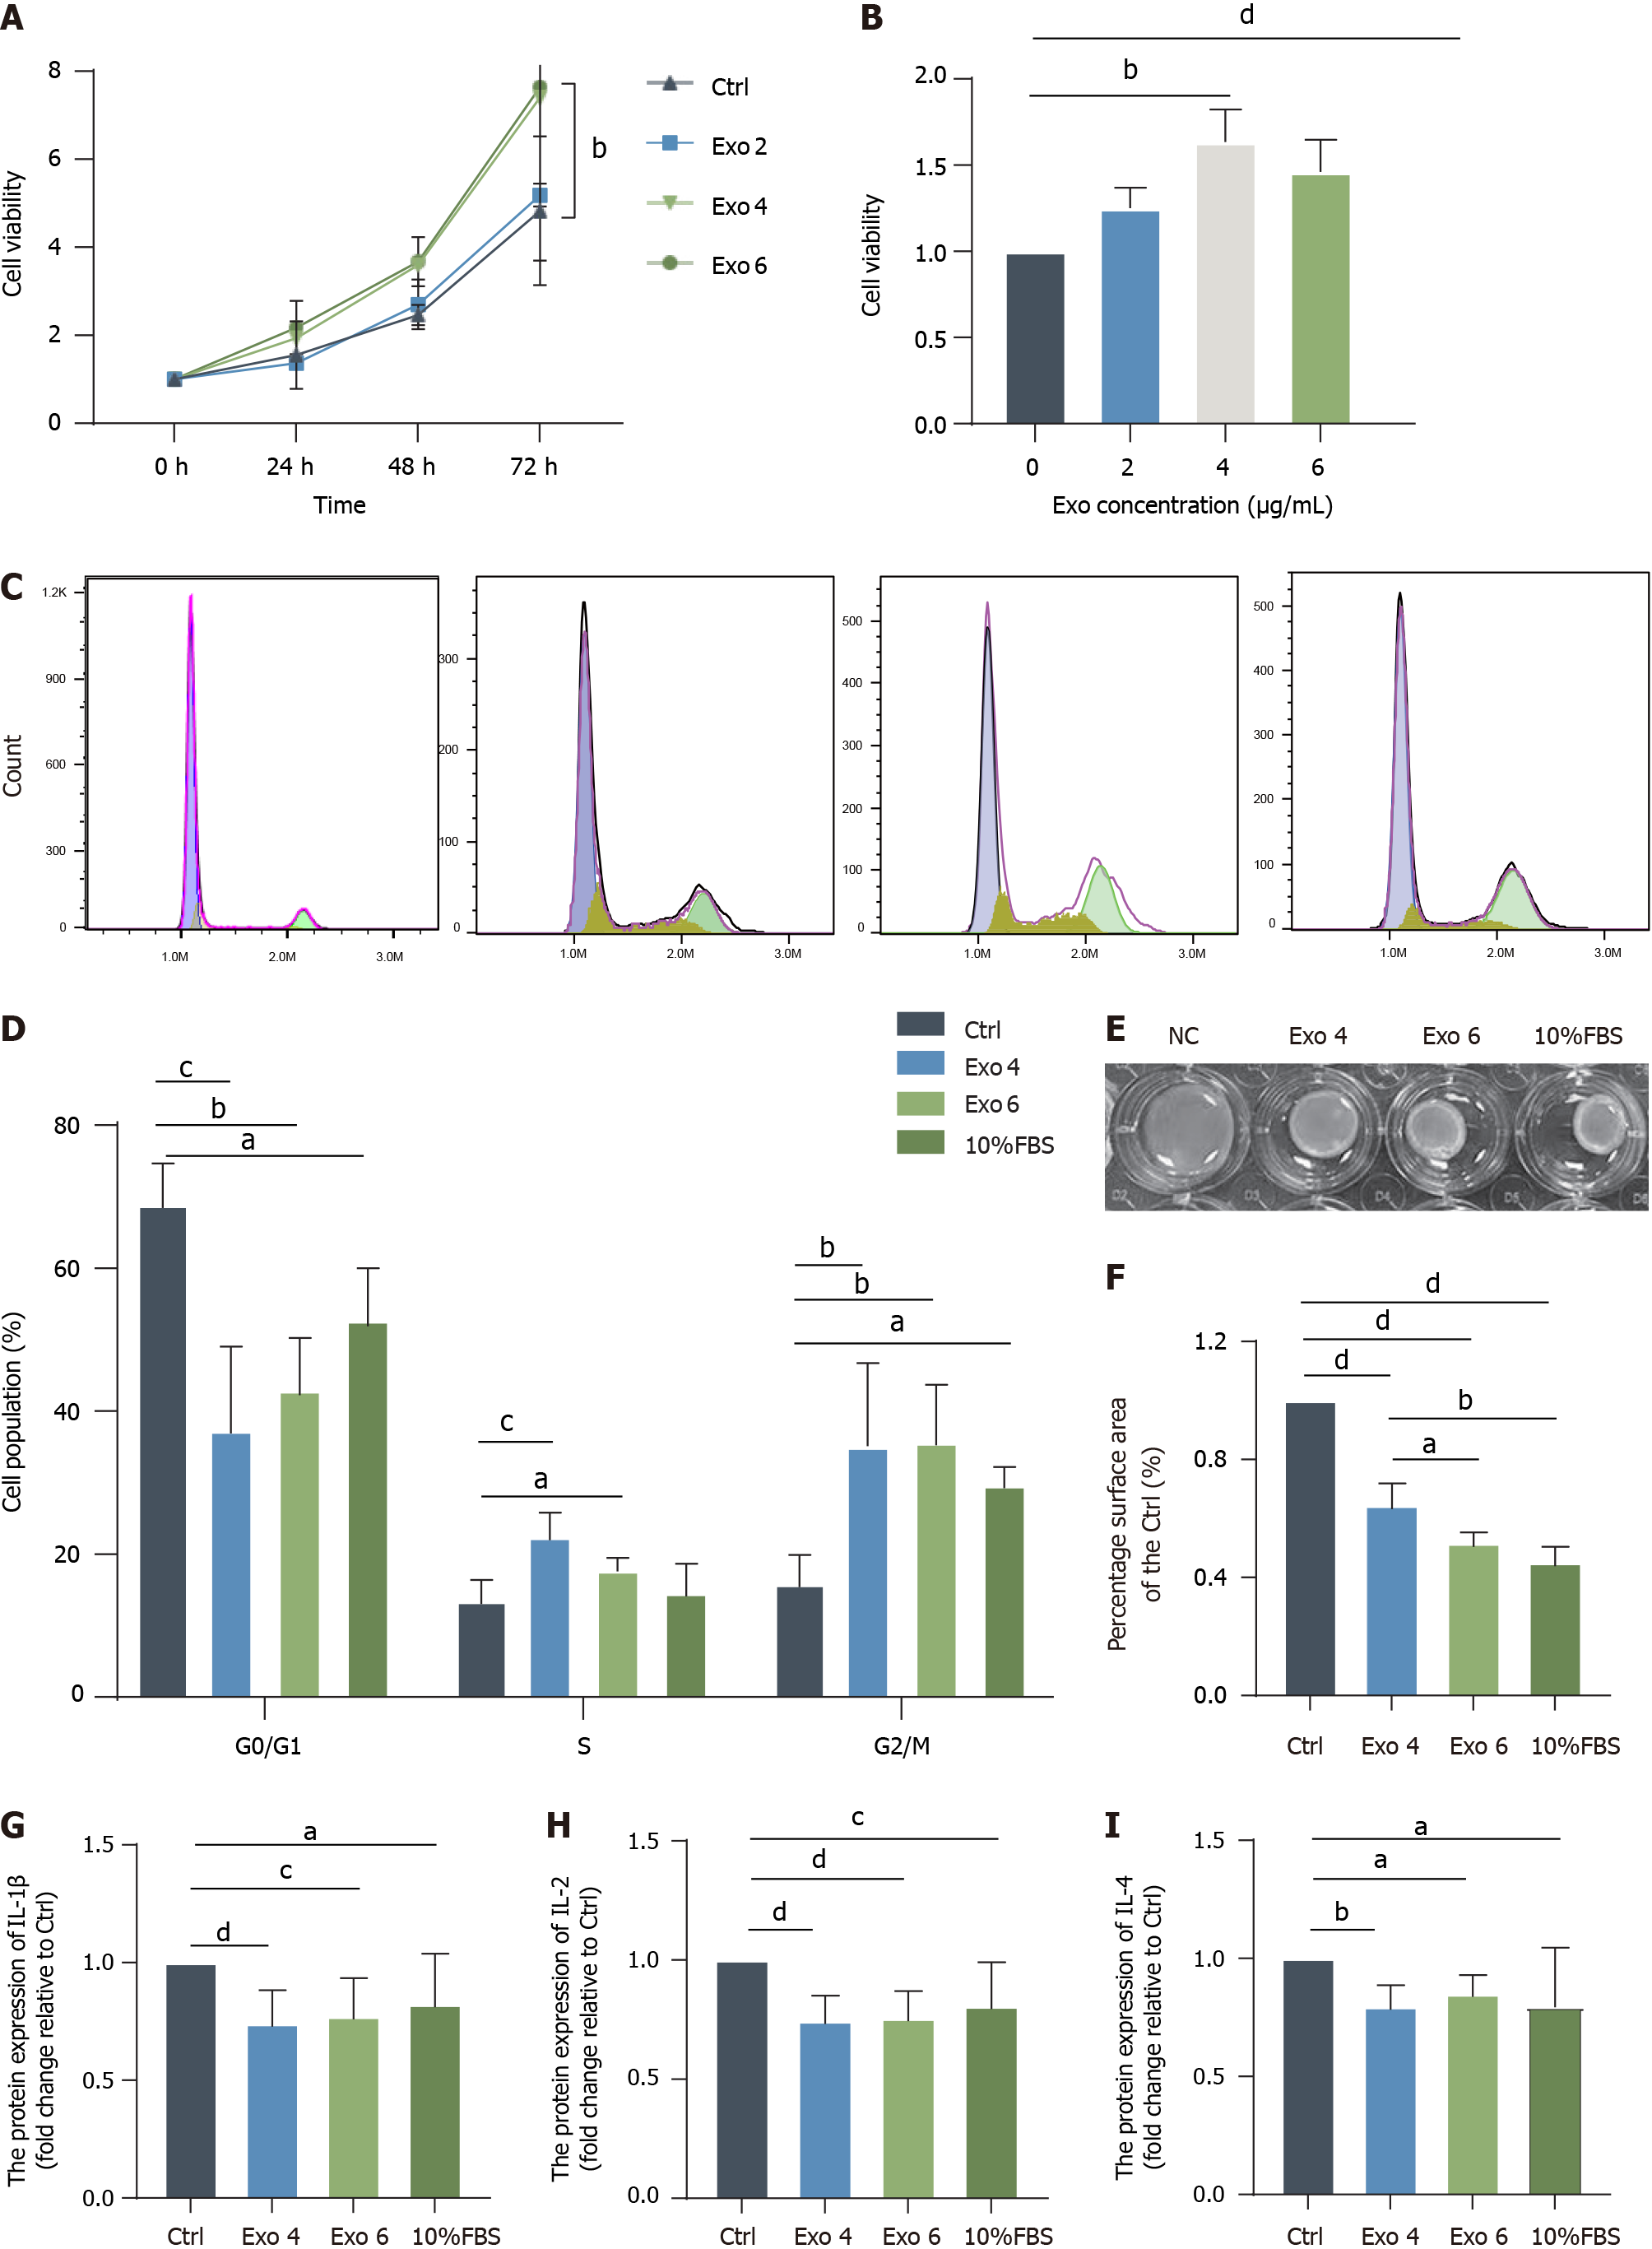
Figure 5 Human umbilical cord mesenchymal stromal cell-derived exosome stimulated the growth and contractility of fibroblasts.
A: A Cell Counting Kit-8 (CCK-8) assay was used to detect the effect of human umbilical cord mesenchymal stromal cell-derived exosome (hucMSC-Exo) on the viability of fibroblasts from 0 h to 72 h; B: Quantification of the CCK-8 results at 48 h; C and D: Flow cytometric analysis of the cell cycle distribution of fibroblasts exposed to hucMSC-Exo and quantification of the results at 48 h; E and F: Representative images and quantification of gel contraction following incubation with hucMSC-Exo (4 or 6 μg/mL) for 48 h. Gel contraction was measured as a percentage of the area of the control group; G-I: Culture supernatant was collected after fibroblasts from the 4 groups were treated for 48 h, and enzyme-linked immunosorbent assay was conducted to determine the levels of interleukin (IL)-1β, IL-2 and IL-4. The data were analyzed by one-way ANOVA (means ± SD). aP < 0.05; bP < 0.01; cP < 0.001; dP < 0.0001. Exo: Exosome; IL: Interleukin; FBS: Fetal bovine serum.
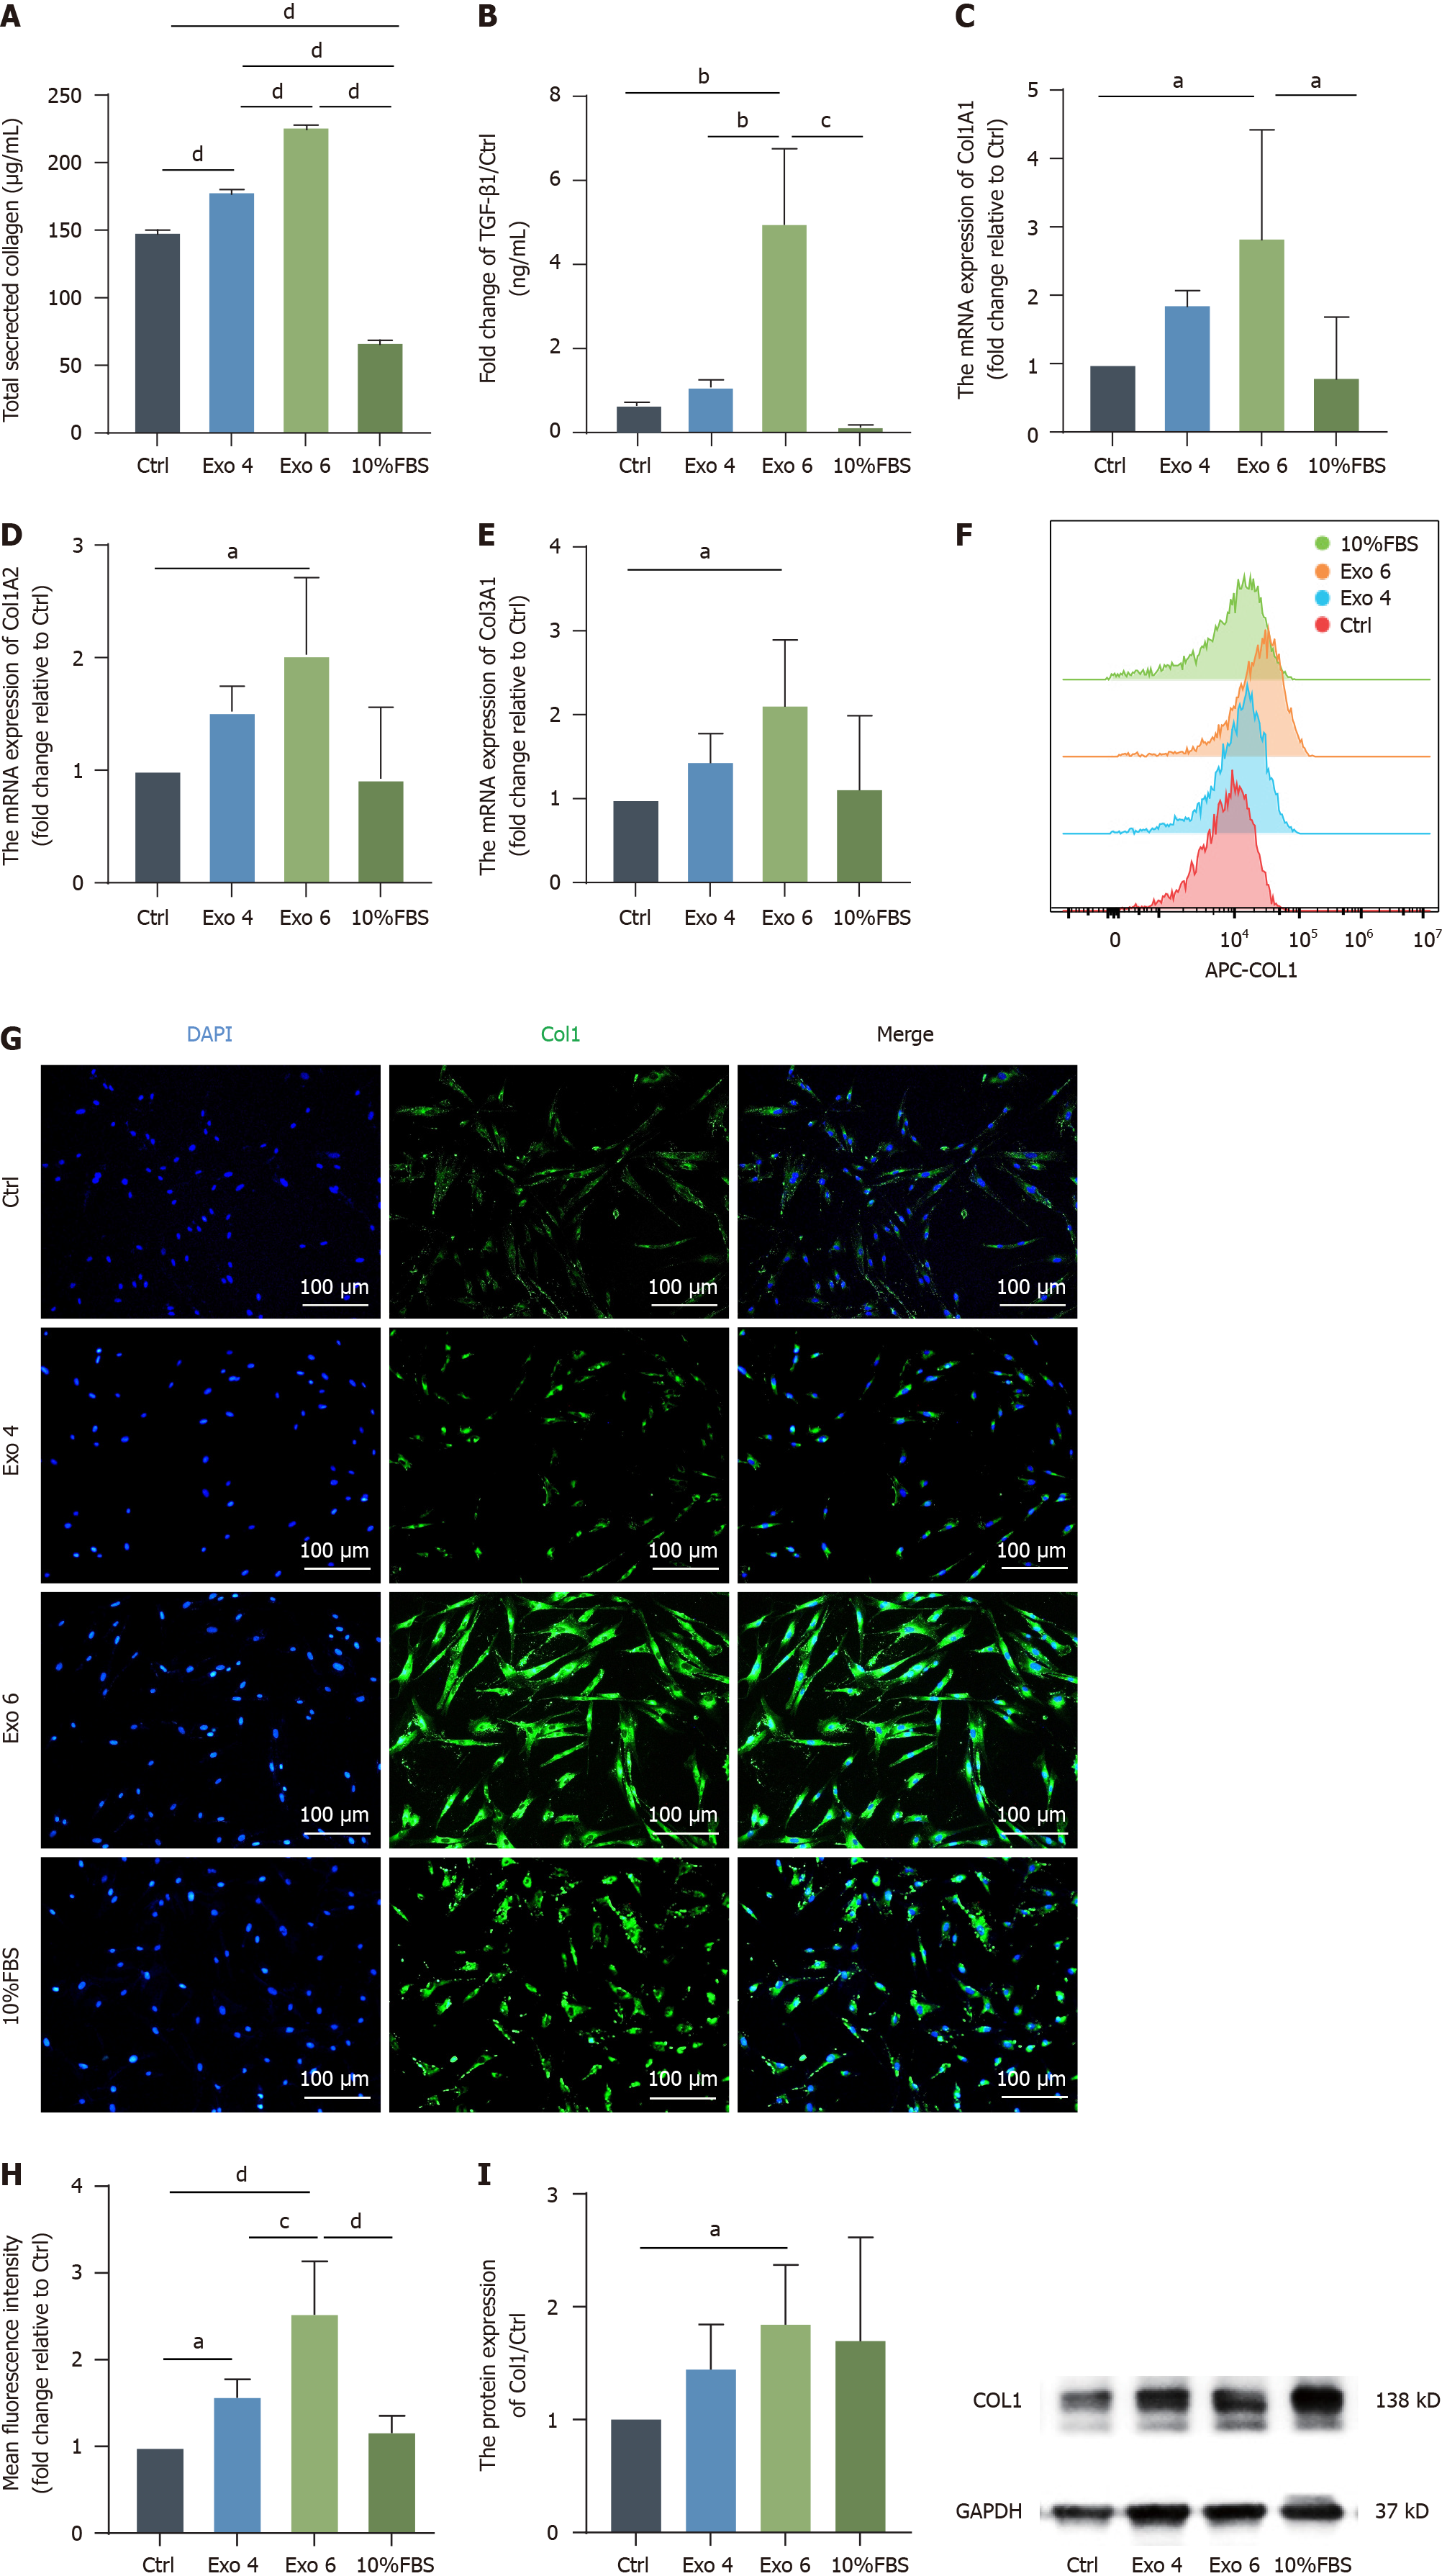
Figure 6 Human umbilical cord mesenchymal stromal cell-derived exosome promote the production of collagen in primary vaginal fibroblasts.
A: A Sirius Red collagen staining kit was used to determine the total secreted collagen level in the fibroblasts’ supernatant; B: Enzyme-linked immunosorbent assays were conducted to quantify the expression level of transforming growth factor-β1 in the cell culture supernatant; C-E: Quantitative real-time polymerase chain reaction was performed to evaluate the mRNA levels of Col1A1, Col1A2 and Col3A1; F-H: Representative histogram overlay showing the median fluorescence intensity of each group (F) and quantification of these values (H), the expression level of Col1 was also detected by immunofluorescence. Green indicates Col1; blue indicates DAPI-stained nuclei. Scale bar: 100 μm (G); I: The protein expression of Col1 was determined by western blot, and the results were quantified, which was in line with the previous results of Sirius Red staining, real-time polymerase chain reaction, FCM and immunofluorescence. The data are presented as the means ± SEMs. Statistical analysis was performed with one-way ANOVA. aP < 0.05; bP < 0.01; cP < 0.001; dP < 0.0001. FBS: Fetal bovine serum; TGF: Transforming growth factor; Exo: Exosome.
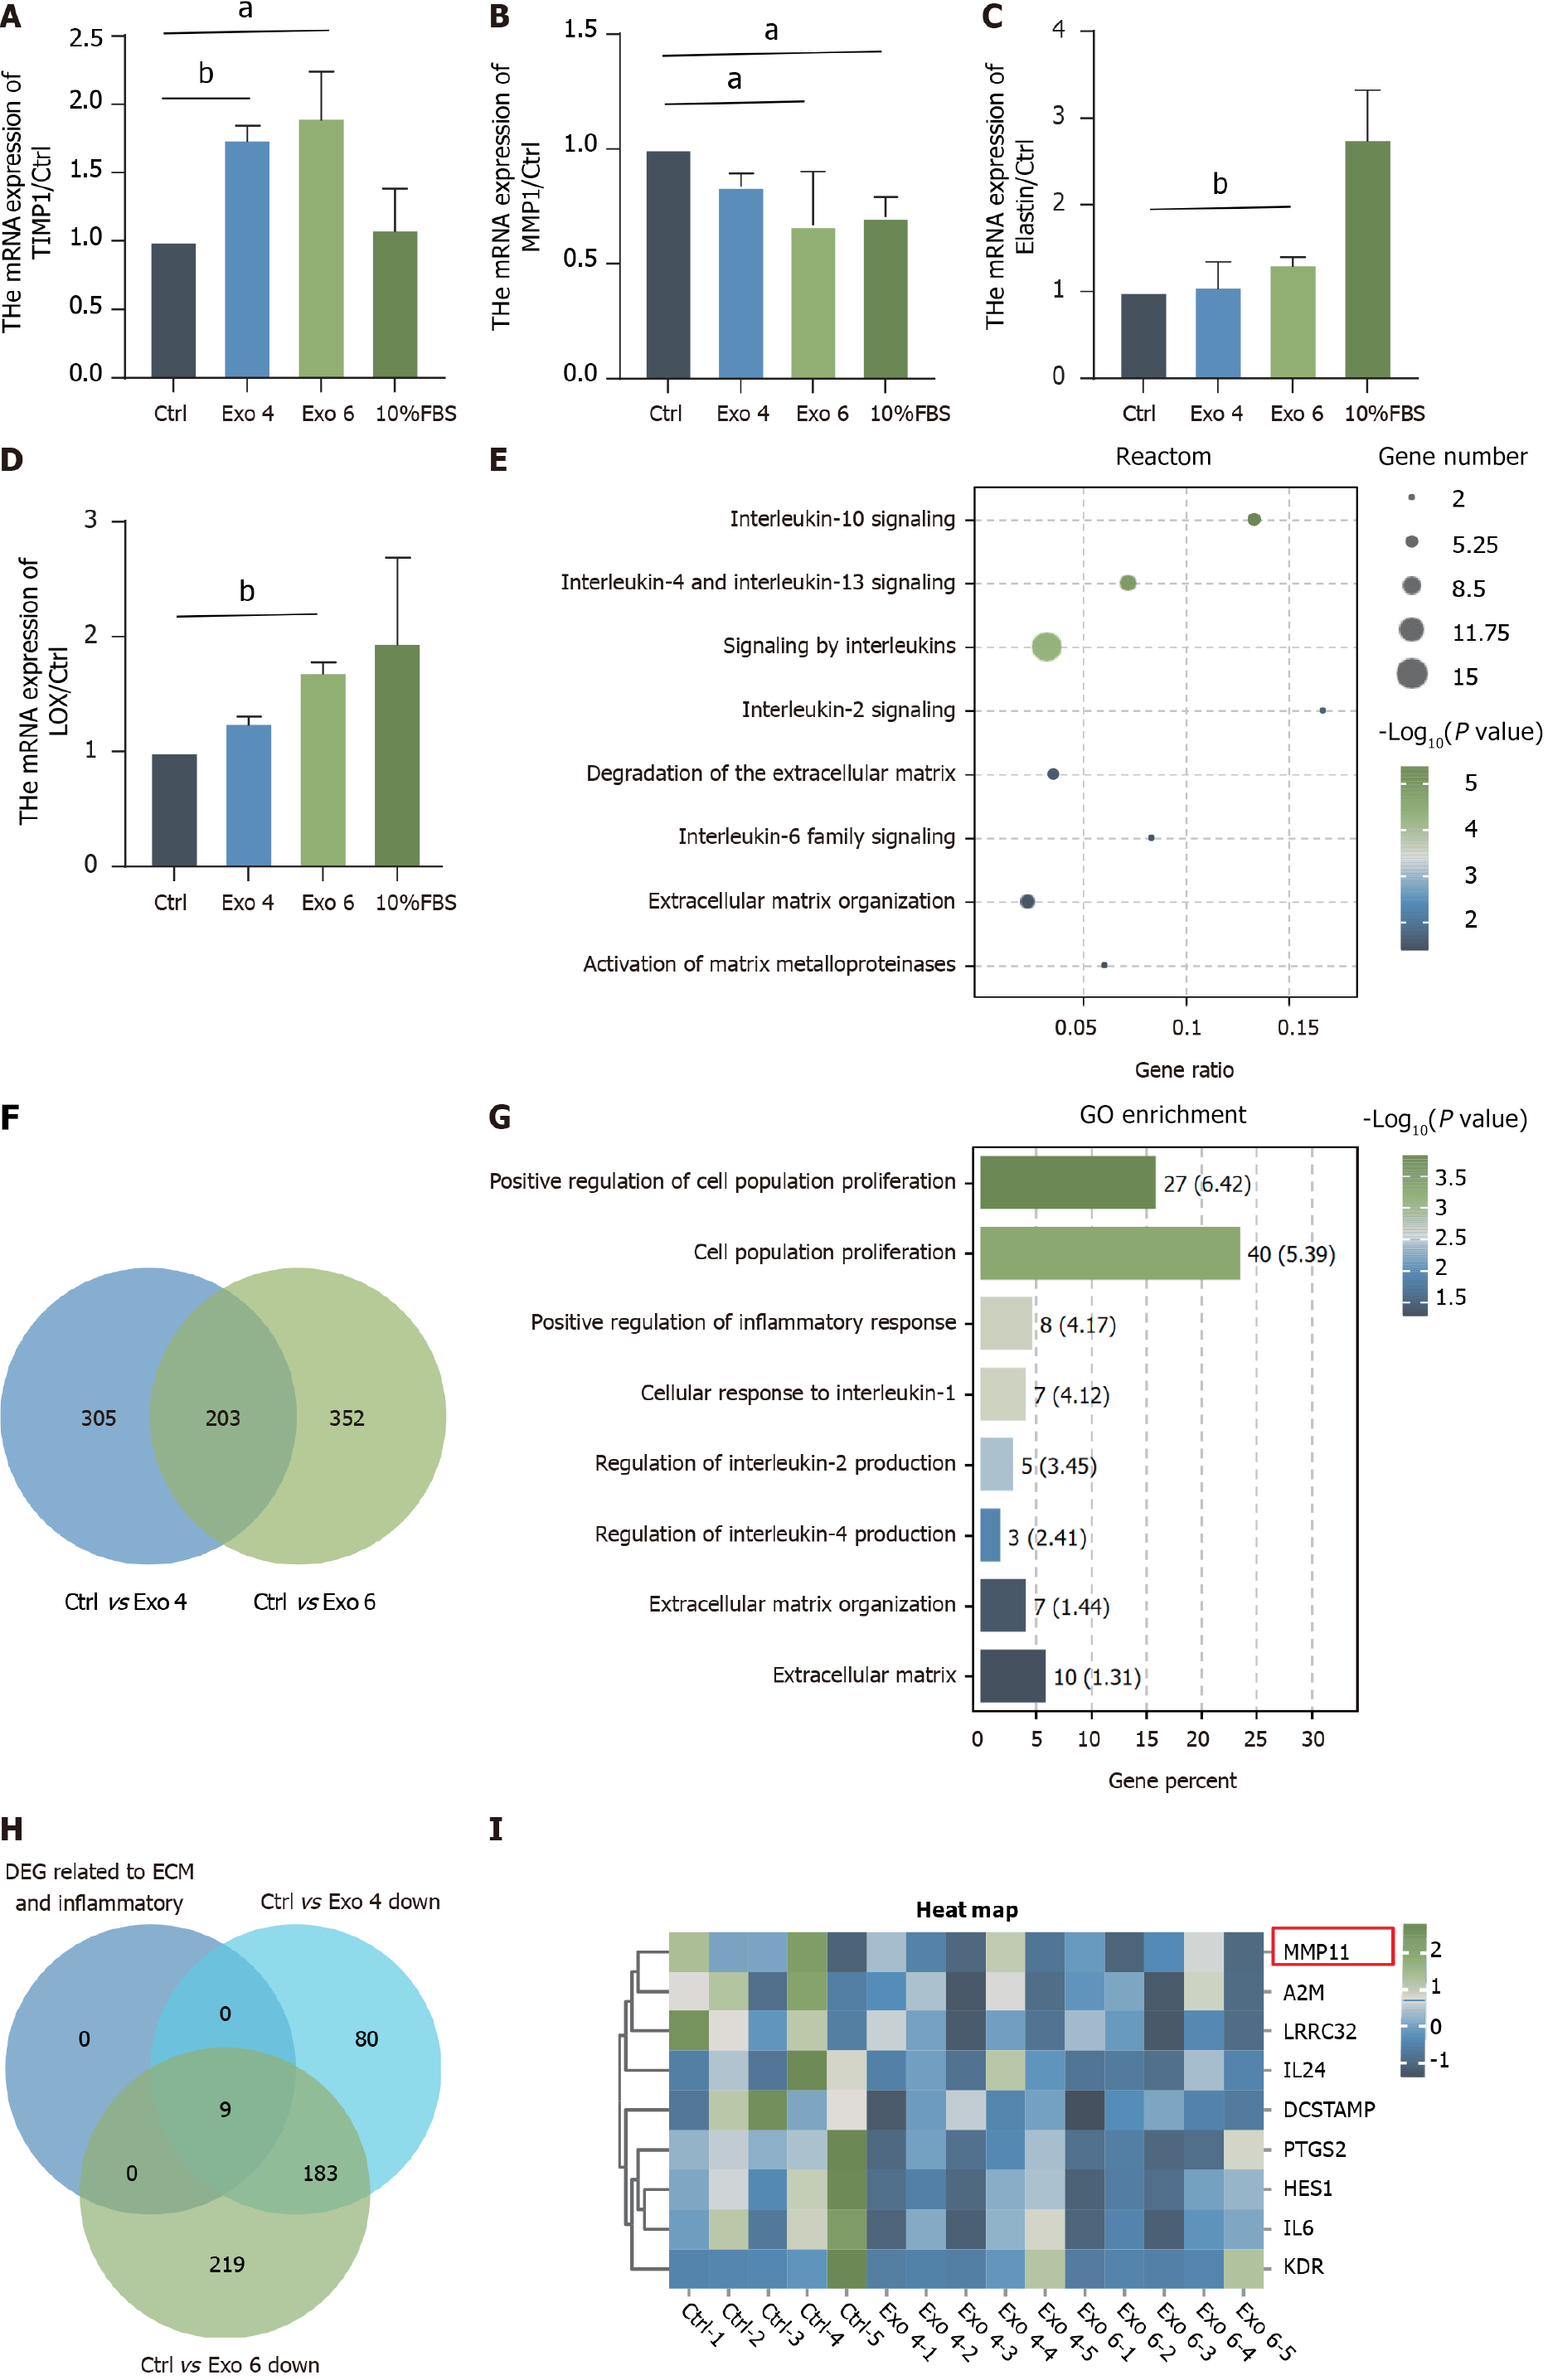
Figure 7 Effect of human umbilical cord mesenchymal stromal cell-derived exosome on the gene expression profile of human primary vaginal fibroblasts.
A-D: Quantitative real-time polymerase chain reaction was performed to evaluate the mRNA levels of tissue inhibitor of matrix metalloprotease 1, matrix metalloproteinase 1, elastin and lysyl oxidase; E: Venn diagrams were generated to show the shared differentially expressed genes (DEGs) from the comparison of the group treated with 4 μg/mL versus the Exo-depleted group and the other group exposed to 4 μg/mL versus the Exo-depleted group [fold change (FC) > 1.5, P < 0.05]. F and G: Reactome analysis (F) and Gene Ontology (G) analysis of the 203 overlapping genes; H: Venn diagrams showed DEGs about extracellular matrix (ECM) and inflammatory (FC > 1.5, P < 0.05); I: The heatmap depicting the 11 genes most related to inflammatory and ECM organization processes. aP < 0.05; bP < 0.01. TIMP1: Tissue inhibitor of matrix metalloprotease 1; MMP1: Matrix metalloproteinase 1; LOX: Lysyl oxidase; GO: Gene Ontology; FBS: Fetal bovine serum; Exo: Exosome.
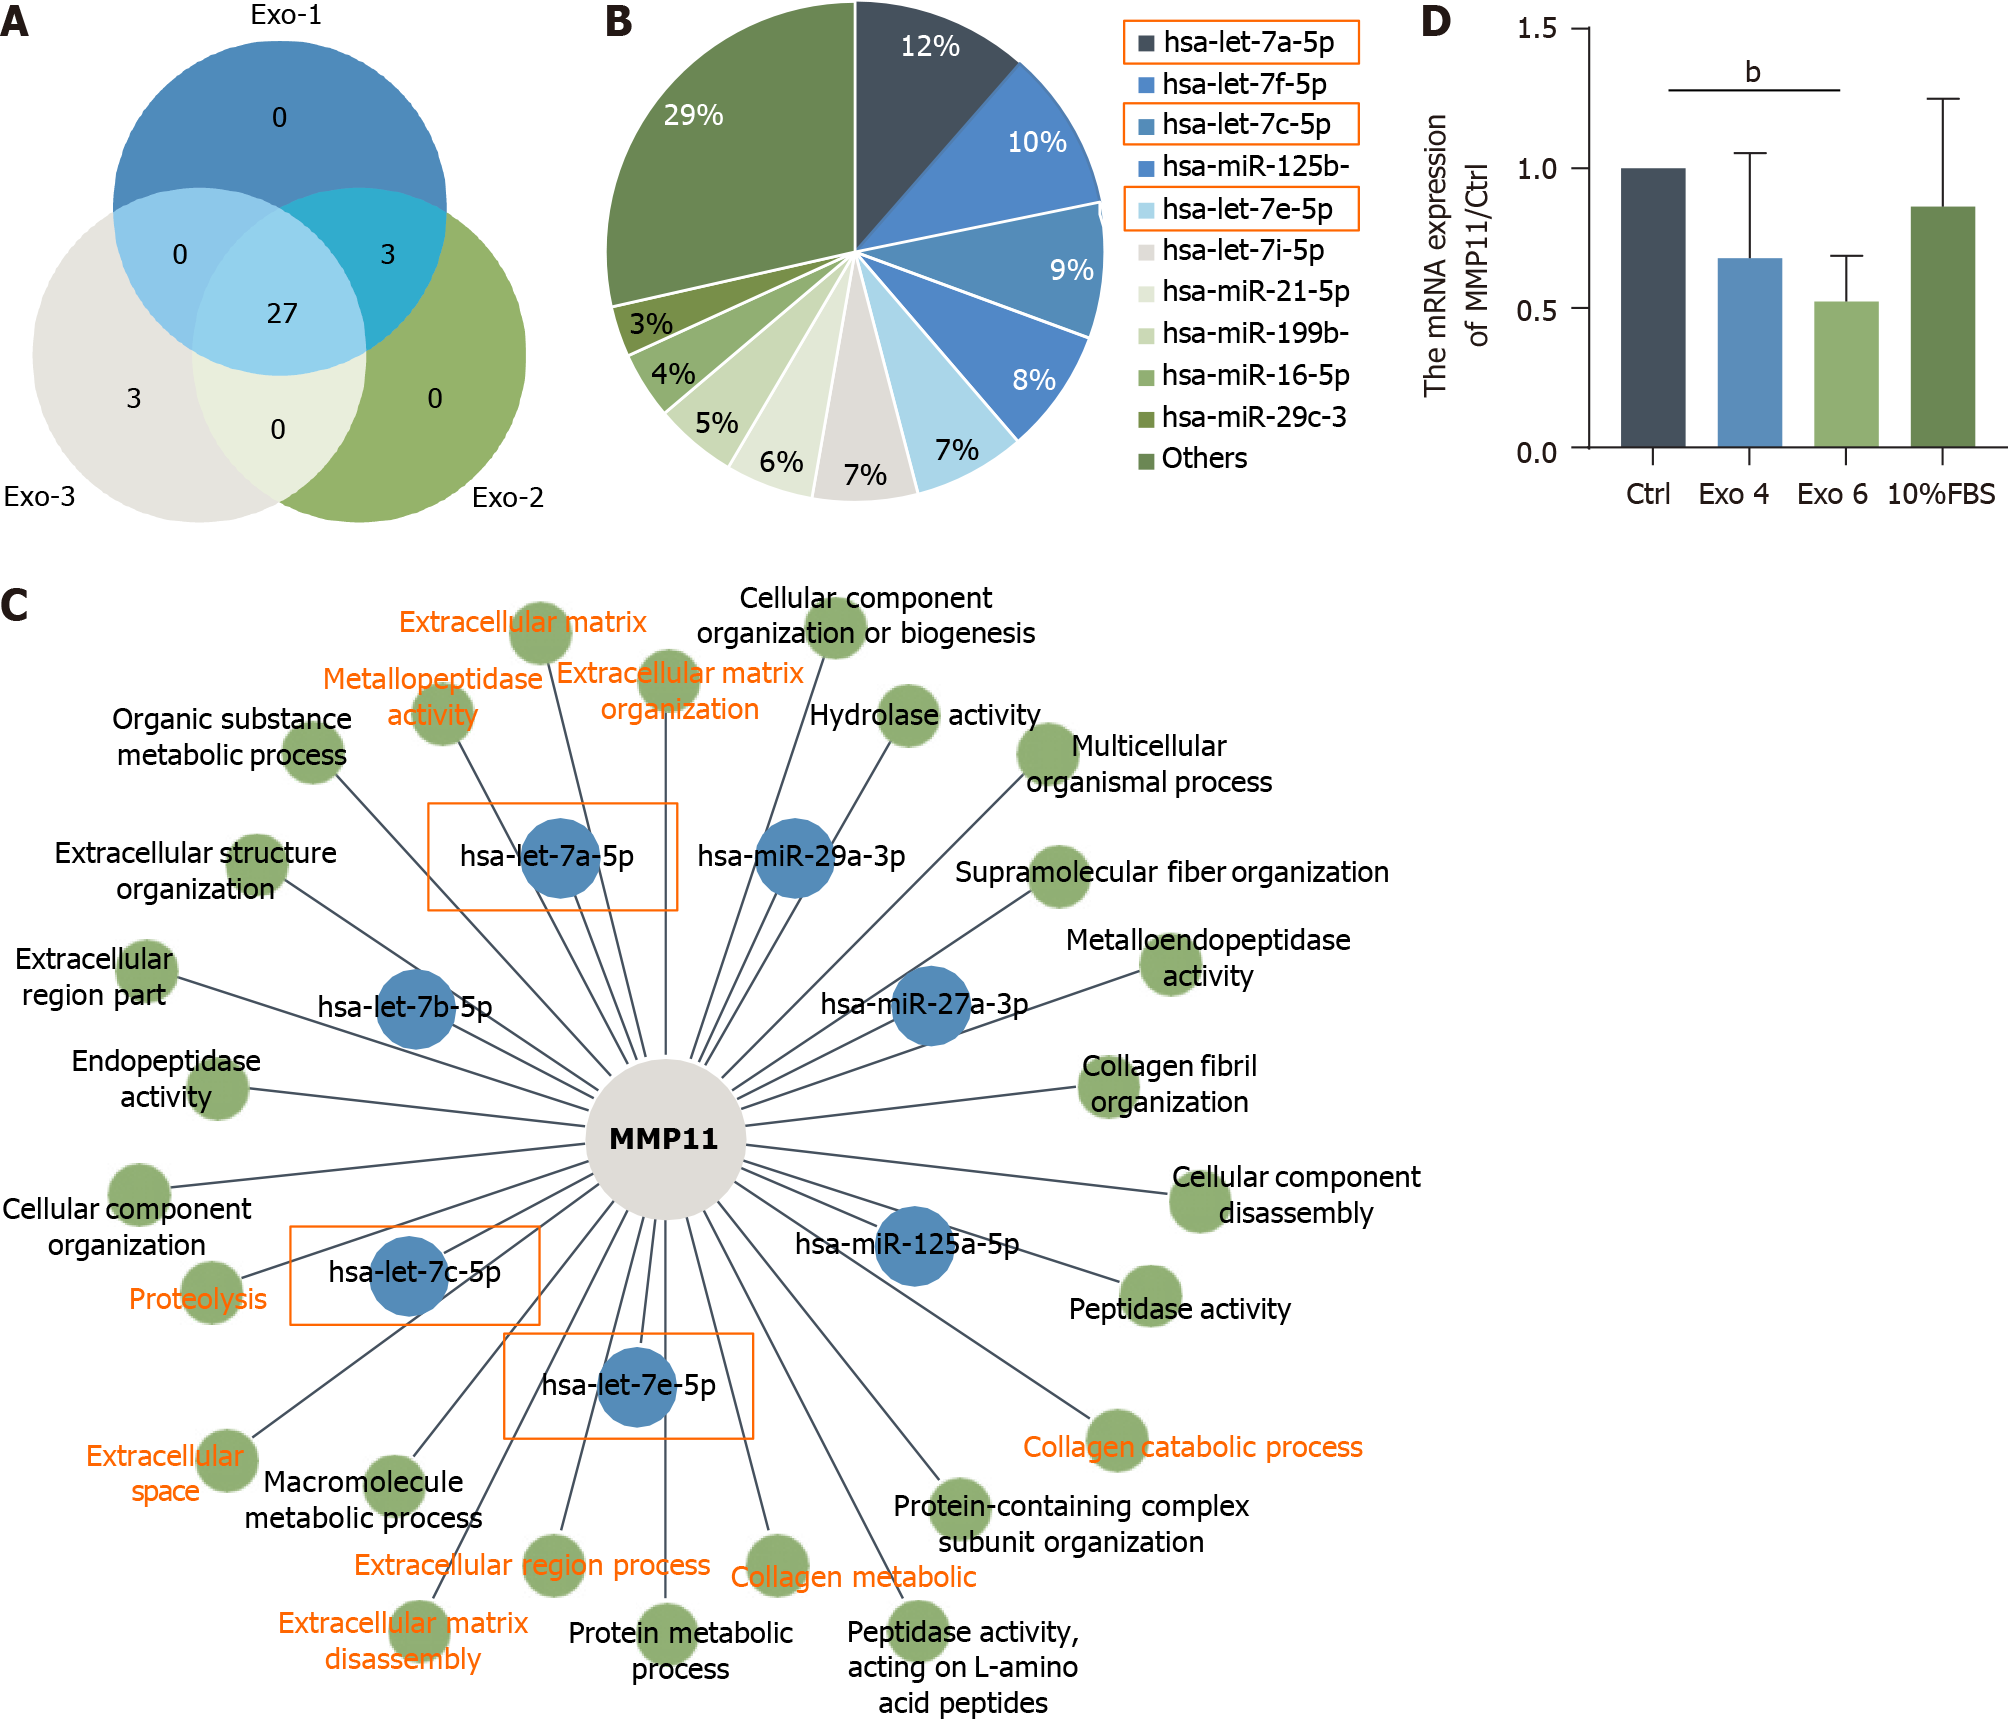
Figure 8 Characterization of microRNA profiles in human umbilical cord mesenchymal stromal cell-derived exosome and verification of beneficial targeted microRNAs.
A: Venn diagram of the top 27 shared microRNAs (miRNAs) in human umbilical cord mesenchymal stromal cell-derived exosome (hucMSC-Exo) (n = 3); B: Pie charts showing the abundances of different miRNAs in hucMSC-Exo; C: The regulatory network depicting the predicted miRNAs of the gene of interest matrix metalloproteinase 11 (MMP11) in the top 27 list and the enrichment terms of these miRNAs in the Gene Ontology analysis; D: Quantitative real-time polymerase chain reaction was performed to evaluate the mRNA levels of MMP11. bP < 0.01. MMP: Matrix metalloproteinase; FBS: Fetal bovine serum; Exo: Exosome.
- Citation: Xu LM, Yu XX, Zhang N, Chen YS. Exosomes from umbilical cord mesenchymal stromal cells promote the collagen production of fibroblasts from pelvic organ prolapse. World J Stem Cells 2024; 16(6): 708-727
- URL: https://www.wjgnet.com/1948-0210/full/v16/i6/708.htm
- DOI: https://dx.doi.org/10.4252/wjsc.v16.i6.708


