Copyright
©The Author(s) 2024.
World J Stem Cells. May 26, 2024; 16(5): 560-574
Published online May 26, 2024. doi: 10.4252/wjsc.v16.i5.560
Published online May 26, 2024. doi: 10.4252/wjsc.v16.i5.560
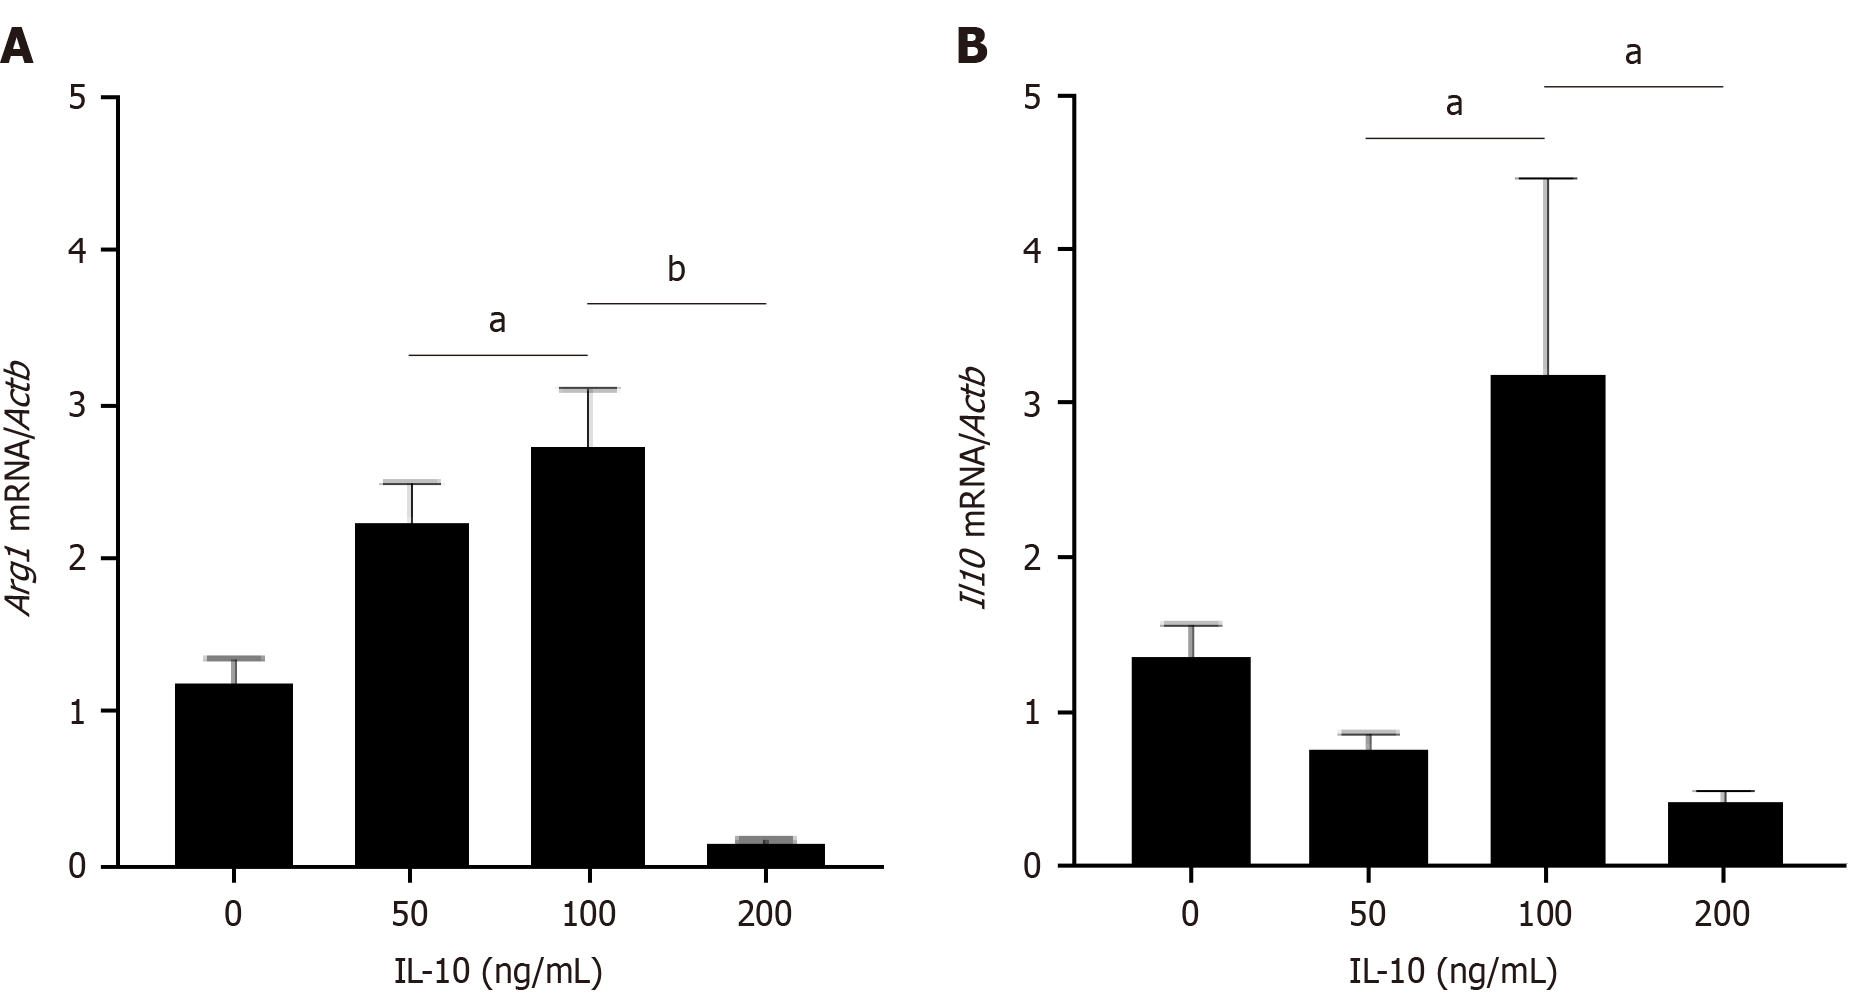
Figure 1 Expression of Arginase 1 and interleukin-10 in macrophages after stimulated by different concentrations of interleukin-10.
A: Real-time polymerase chain reaction (PCR) analysis of mRNA level of Arginase 1 (Arg1) in macrophages after stimulated by different concentrations of interleukin-10 (IL-10) (0, 50, 100, 200 ng/uL) for 24 h; B: Real-time PCR analysis of mRNA level of Il10 in macrophages (groups as above). The expression levels were normalized to the expression of β-actin (Actb). n = 3 biological replicates. Data are represented as mean ± SD, statistically significant difference at the levels as aP < 0.05 and bP < 0.01. Arg1: Arginase 1; IL-10: Interleukin-10; Actb: β-actin.
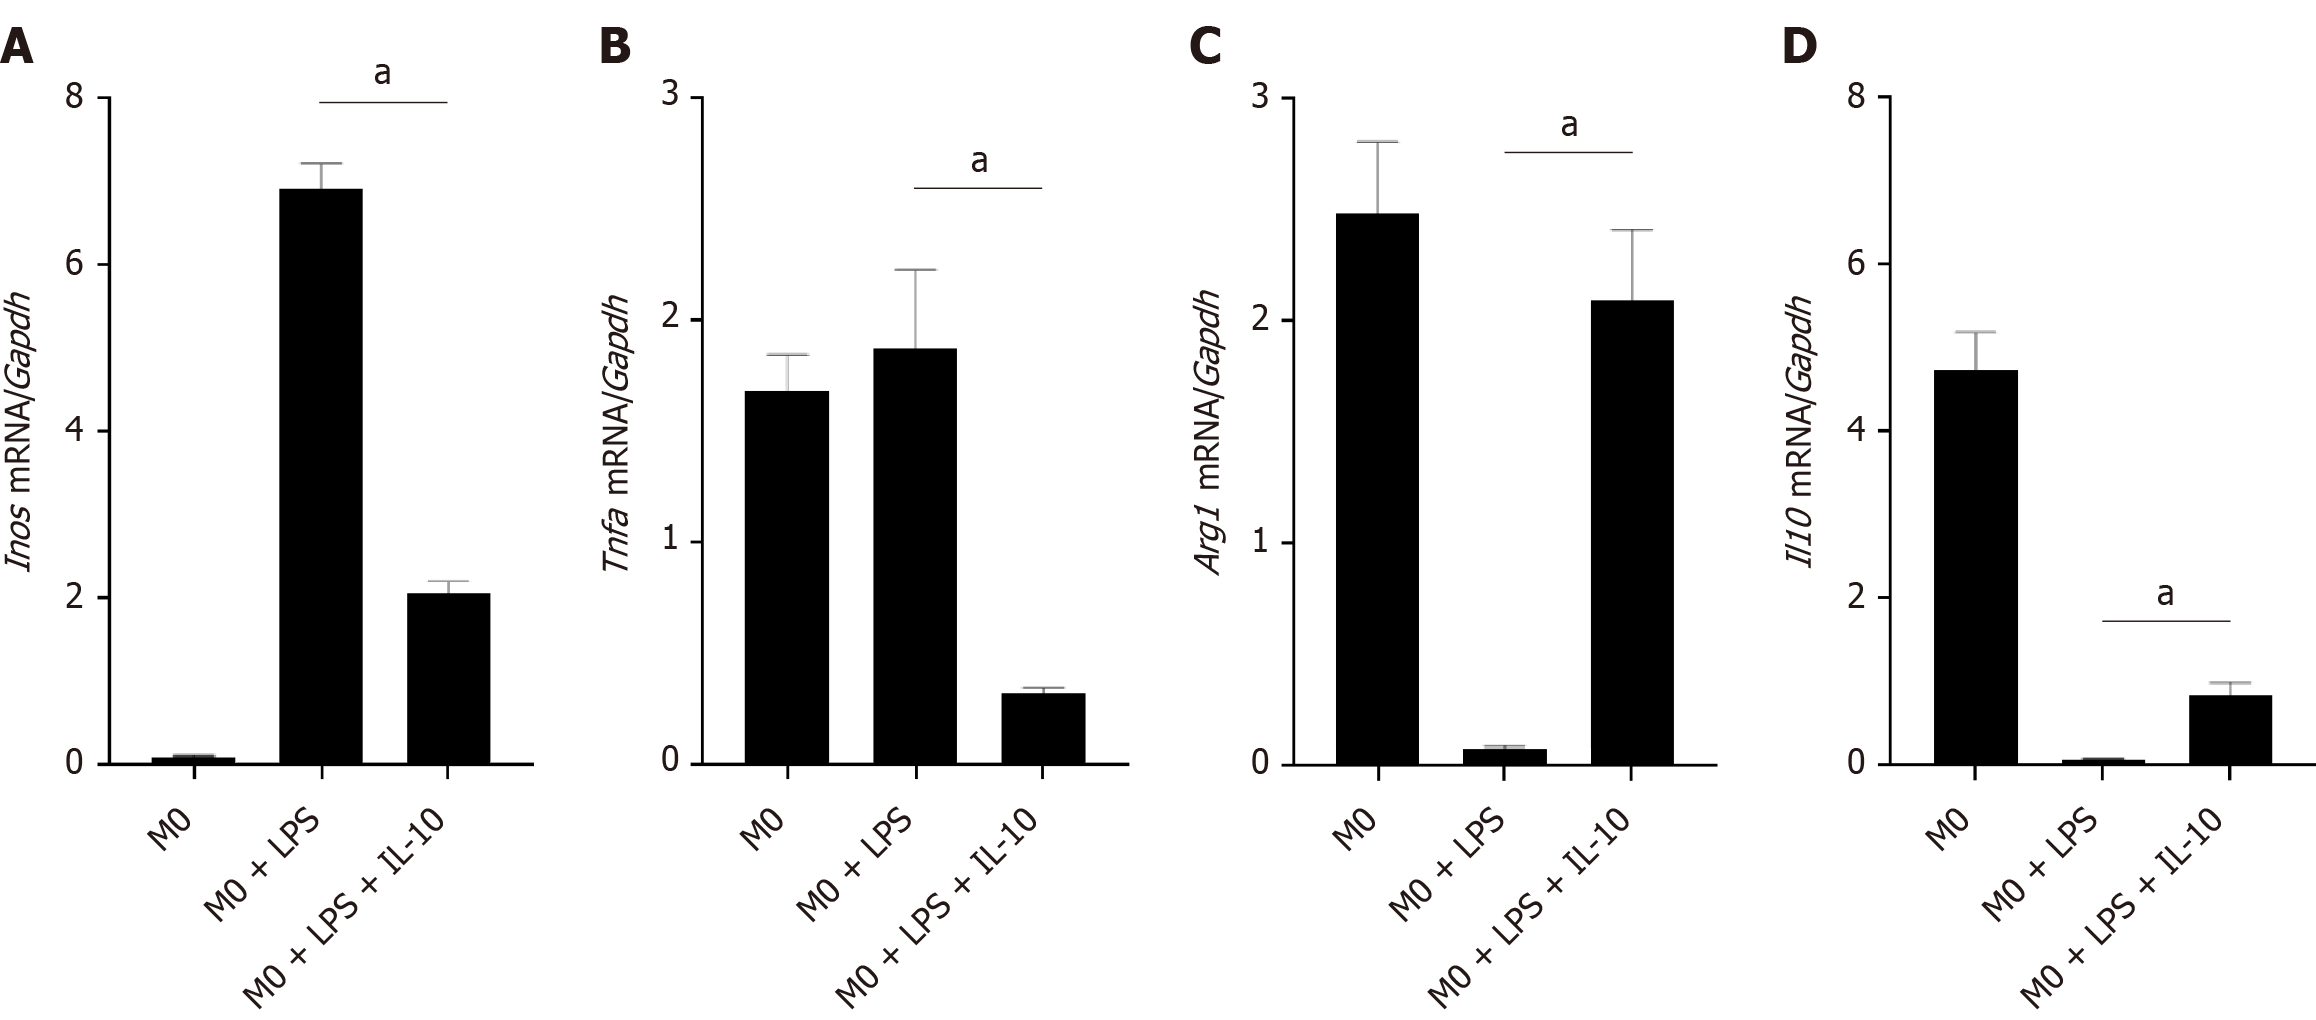
Figure 2 The effect of interleukin-10 acting on the macrophages on the inflammatory reaction environment.
A: Real-time polymerase chain reaction (PCR) analysis for inducible nitric oxide synthase mRNA level in different groups of macrophages; B: Real-time PCR analysis for tumor necrosis factor-αmRNA level in different groups of macrophages; C: Real-time PCR analysis for Arginase 1 mRNA level in different groups of macrophages; D: Real-time PCR analysis for interleukin-10 mRNA level in different groups of macrophages. M0 group was stimulated without any special treatment. M0 + lipopolysaccharide (LPS) group was stimulated with LPS (1 μg/mL) for 12 h, then cultured the cells in normal medium for another 12 h. M0 + LPS + interleukin-10 group was stimulated with LPS (1 μg/mL) for 12 h, then stimulated with interleukin-10 (100 ng/mL) for another 12 h. The expression levels were normalized to the expression of glyceraldehyde-3-phosphate dehydrogenase (Gapdh). n = 3 biological replicates. Data are represented as mean ± SD, statistically significant difference at the levels as aP < 0.05 and bP < 0.01. Arg1: Arginase 1; Il10: Interleukin-10; Inos: Inducible nitric oxide synthase (gene); Tnfa: Tumor necrosis factor-α; Gapdh: Glyceraldehyde-3-phosphate dehydrogenase; LPS: Lipopolysaccharide.
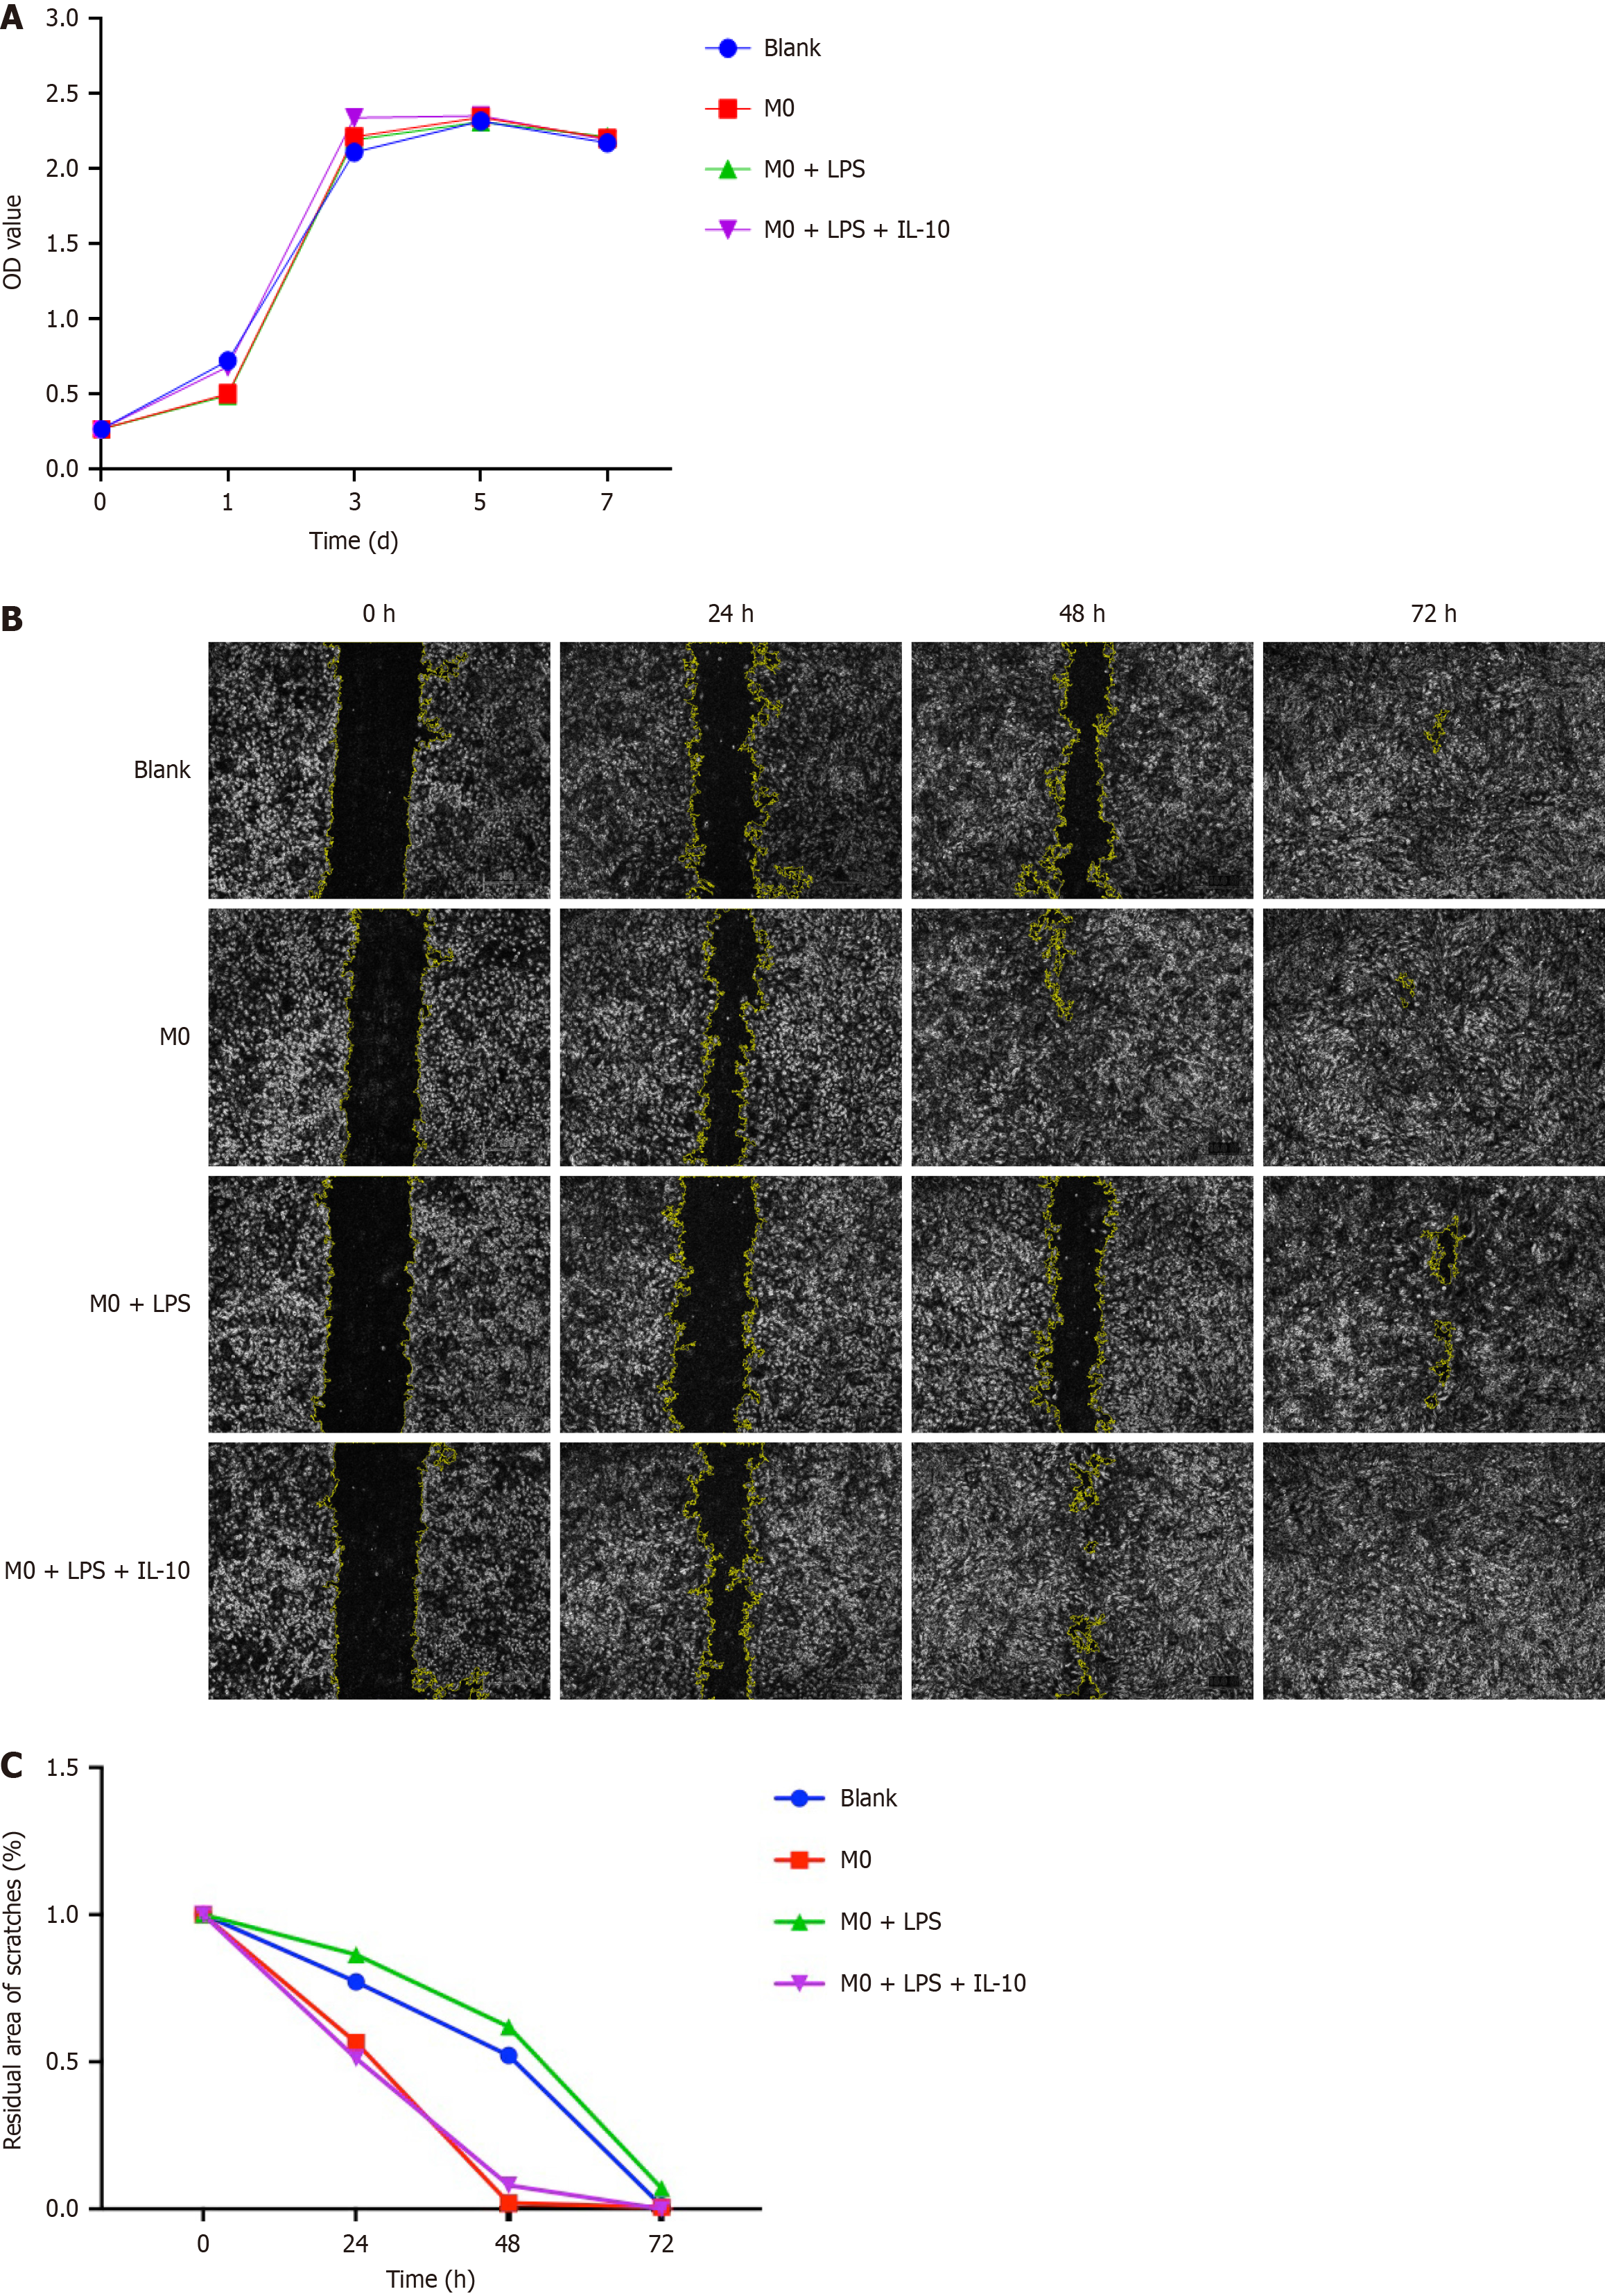
Figure 3 The effect of macrophages on the proliferation and migration of bone marrow mesenchymal stem cells.
A: Cell Counting Kit-8 assay of the 3rd generation of bone marrow mesenchymal stem cells (BMSCs) proliferation after co-cultured with different groups of macrophages: M0, M0 + lipopolysaccharide (LPS), M0 + LPS + interleukin-10; compared with the control group for 1, 3, 5, and 7 d; B: Migration analysis of BMSCs and those co-cultured with different groups of macrophages (groups as above). The Image J software was adopted to process the pictures; C: Quantitative analysis of residual scratch area to initial scratch area percentage. Macrophages influenced the migration but not the proliferation of bone marrow mesenchymal stem cells. IL-10: Interleukin-10; LPS: Lipopolysaccharide.
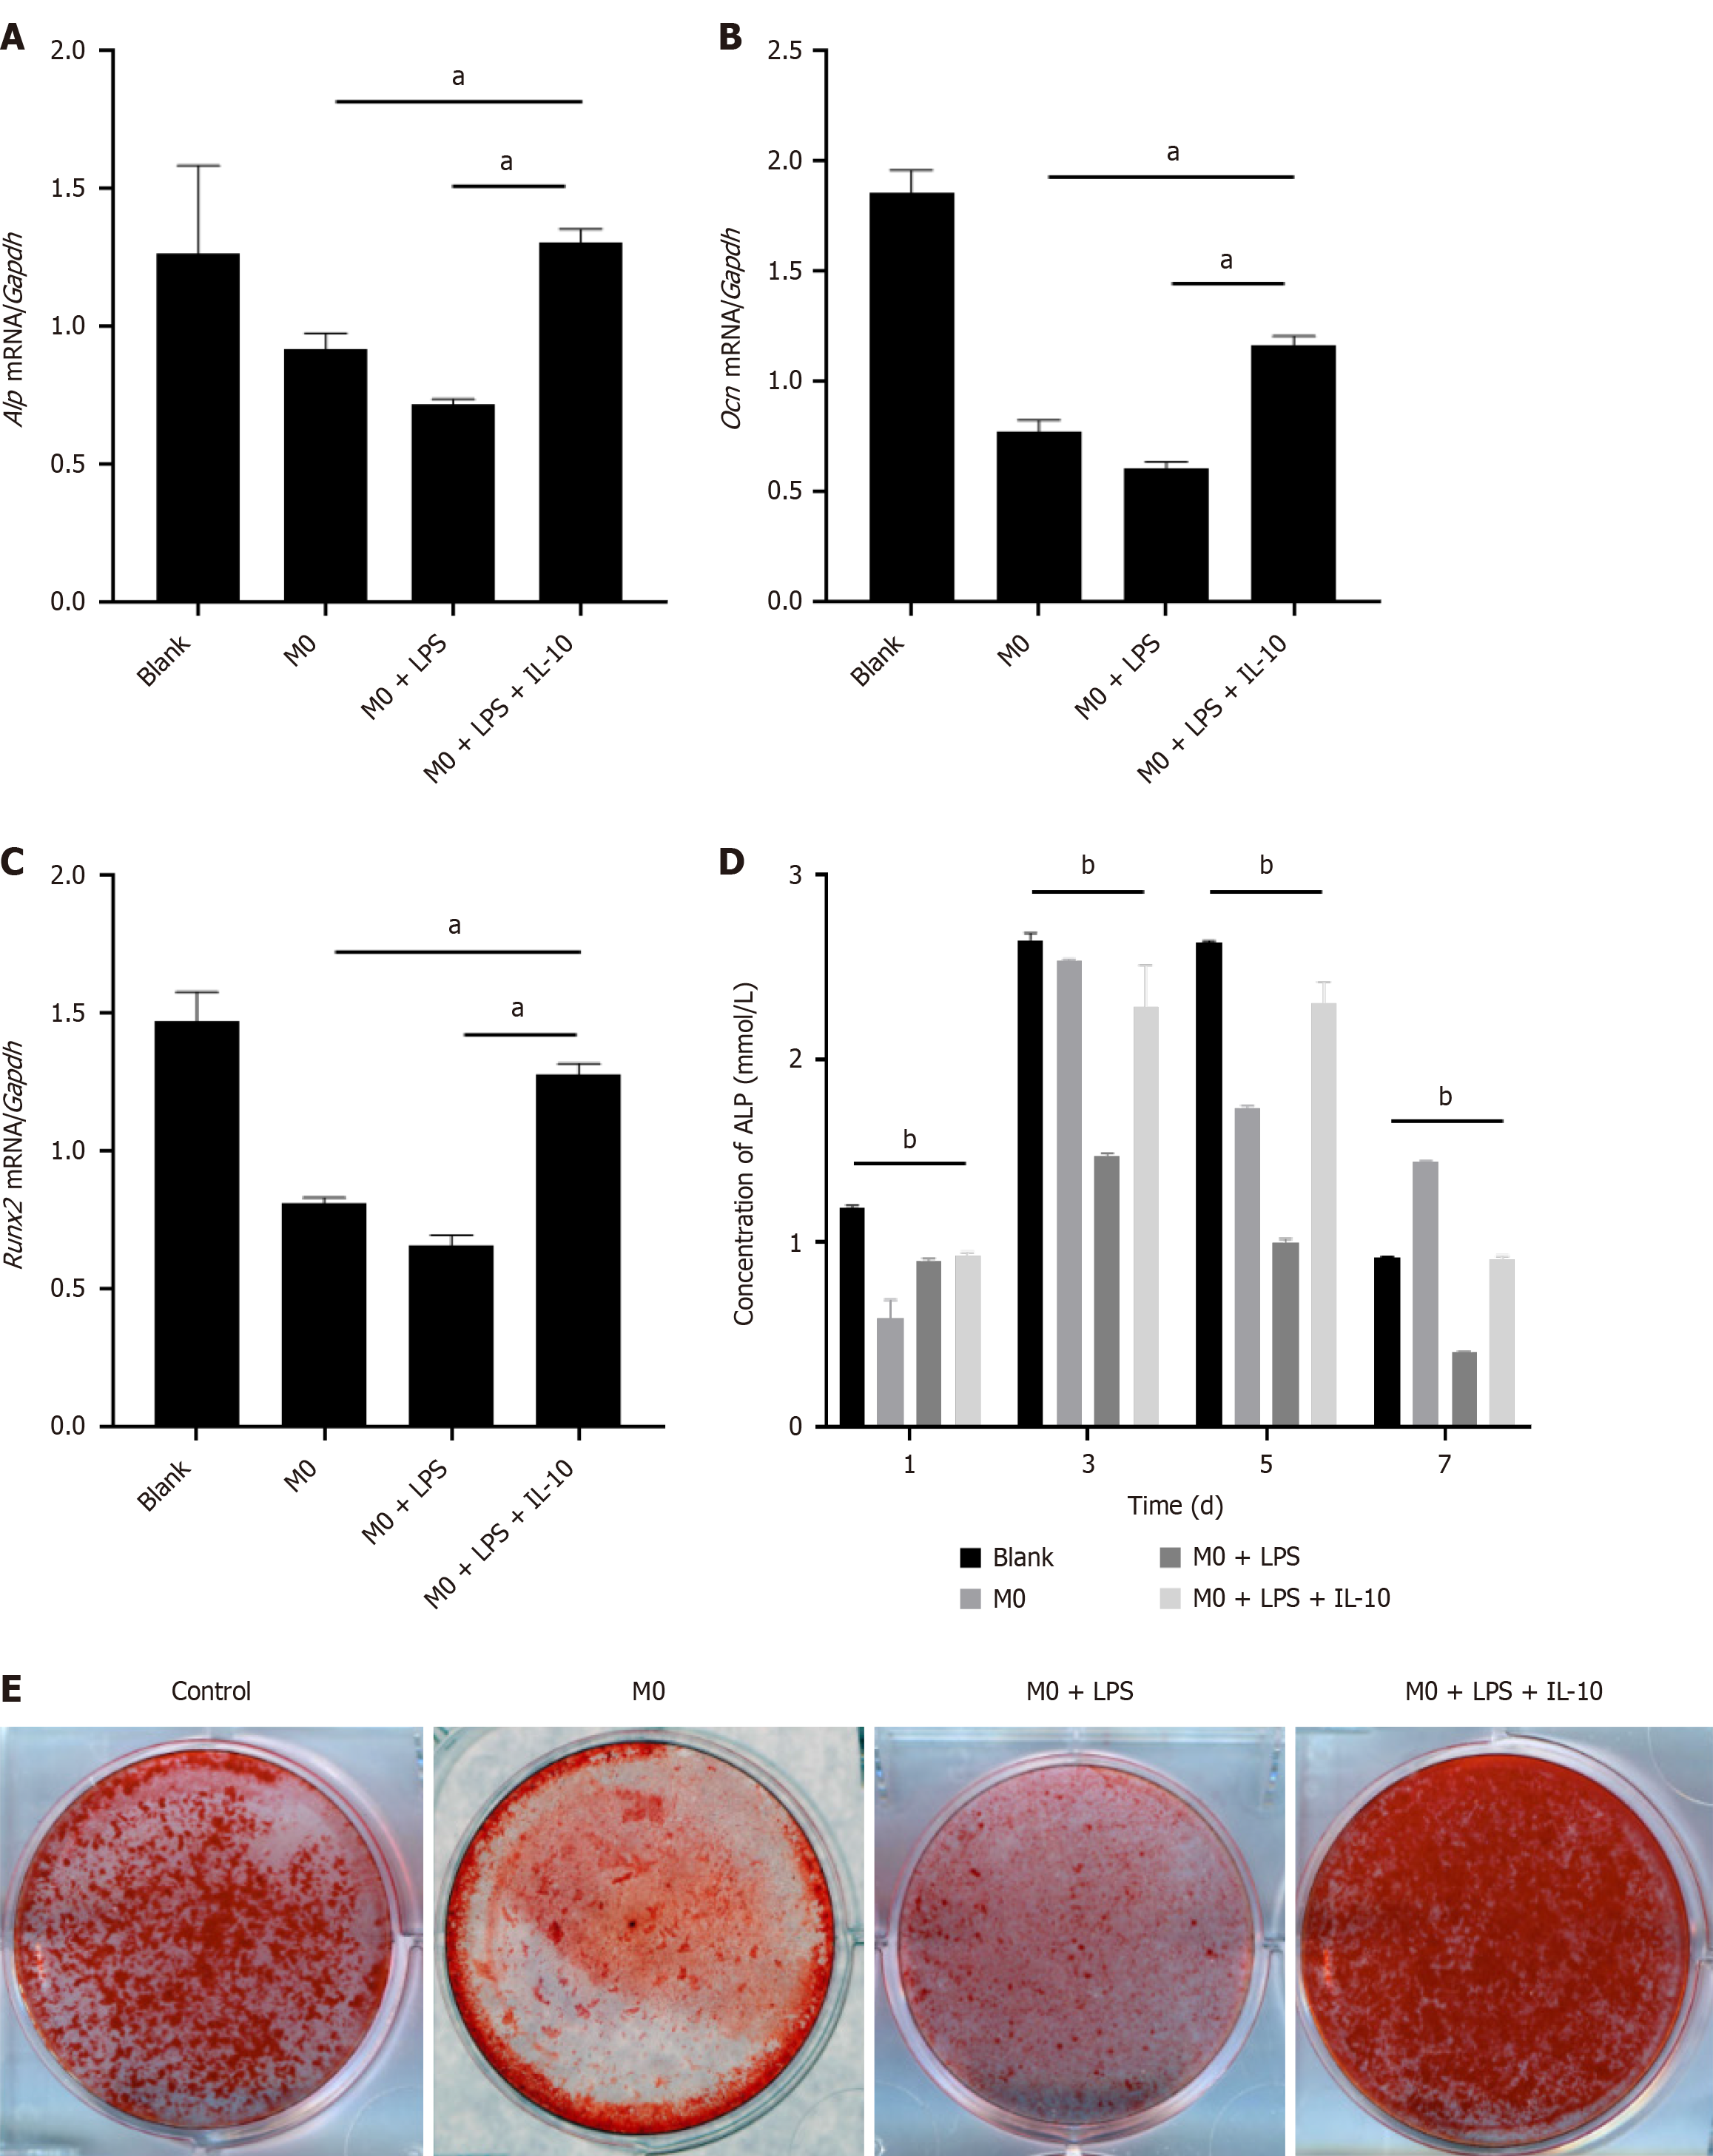
Figure 4 The effect of macrophages on osteogenic differentiation of bone marrow mesenchymal stem cells.
A: Real-time polymerase chain reaction (PCR) analysis for Alkaline phosphatase (Alp) mRNA level in bone marrow mesenchymal stem cells (BMSCs) at the 3rd d after osteogenic induction, which were co cultured with different groups of macrophages: M0, M0 + lipopolysaccharide (LPS), M0 + LPS + interleukin-10 (IL-10); compared with the control group; B: Real-time PCR analysis for osteocalcin mRNA level in BMSCs (groups as above); C: Real-time PCR analysis for Recombinant runt related transcription factor 2 mRNA level in BMSCs (groups as above). The expression levels were normalized to the expression of glyceraldehyde-3-phosphate dehydrogenase; D: Analysis of ALP activity of BMSCs following range of co-cultured with different groups of macrophages at 1, 3, 5, 7 d, compared with the control group; E: At the 14th d after osteogenic induction of different BMSCs, quantitative measurement of calcium mineral deposition was stained by Alizarin Red S staining. n = 3 biological replicates. Data are represented as mean ± SD, statistically significant difference at the levels as aP < 0.05 and bP < 0.01. Alp: Alkaline phosphatase; Ocn: Osteocalcin; Runx2: Recombinant runt related transcription factor 2; Gapdh: Glyceraldehyde-3-phosphate dehydrogenase; IL-10: Interleukin-10; LPS: Lipopolysaccharide.
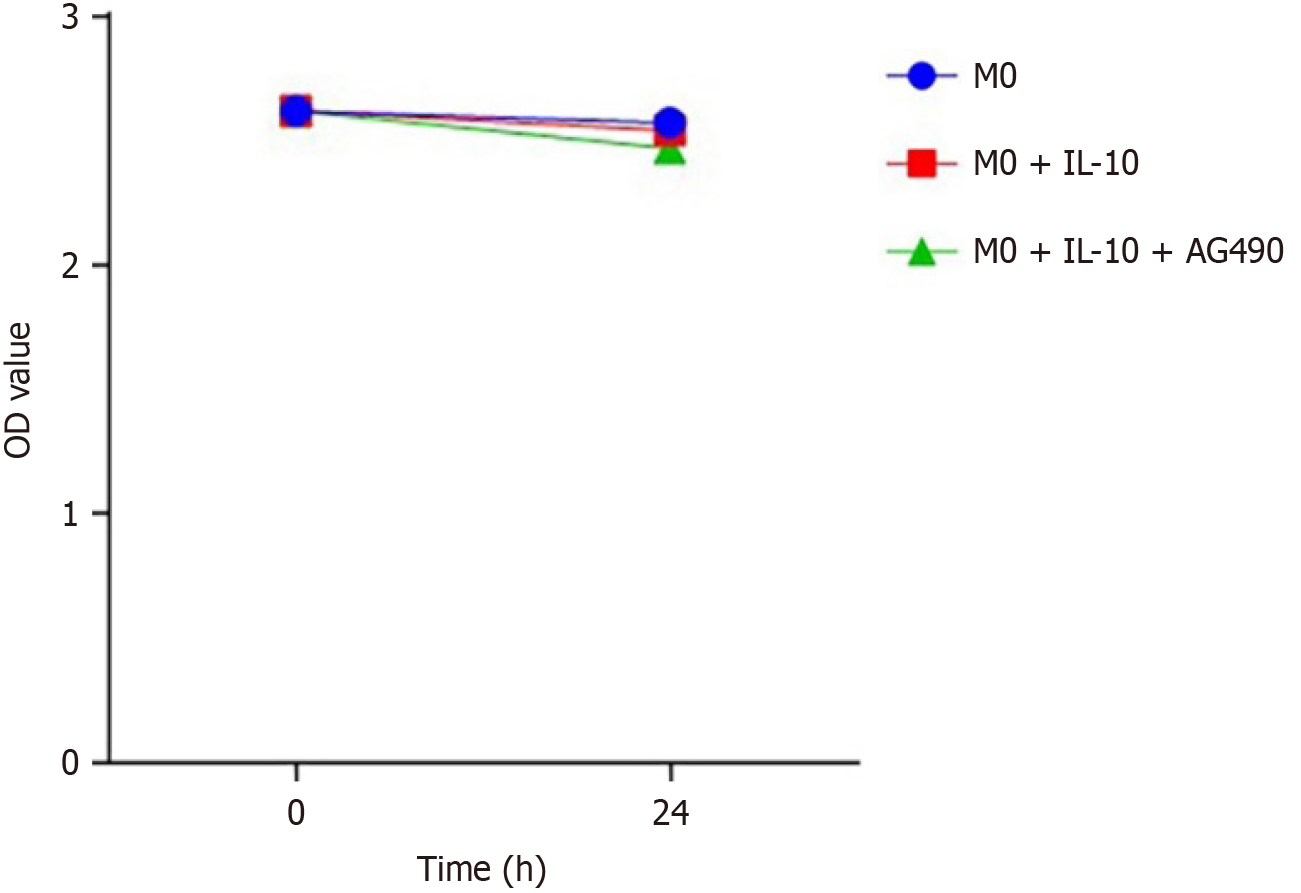
Figure 5 The cytotoxicity of the special inhibitor Tyrphostin AG490.
Analysis of the macrophage activity showed no significantly influences in the group with phosphorylated signal transducer and activator of transcription 3 inhibitor Tyrphostin AG490 compared with the rest of the groups by using Cell Counting Kit-8. IL-10: Interleukin-10.
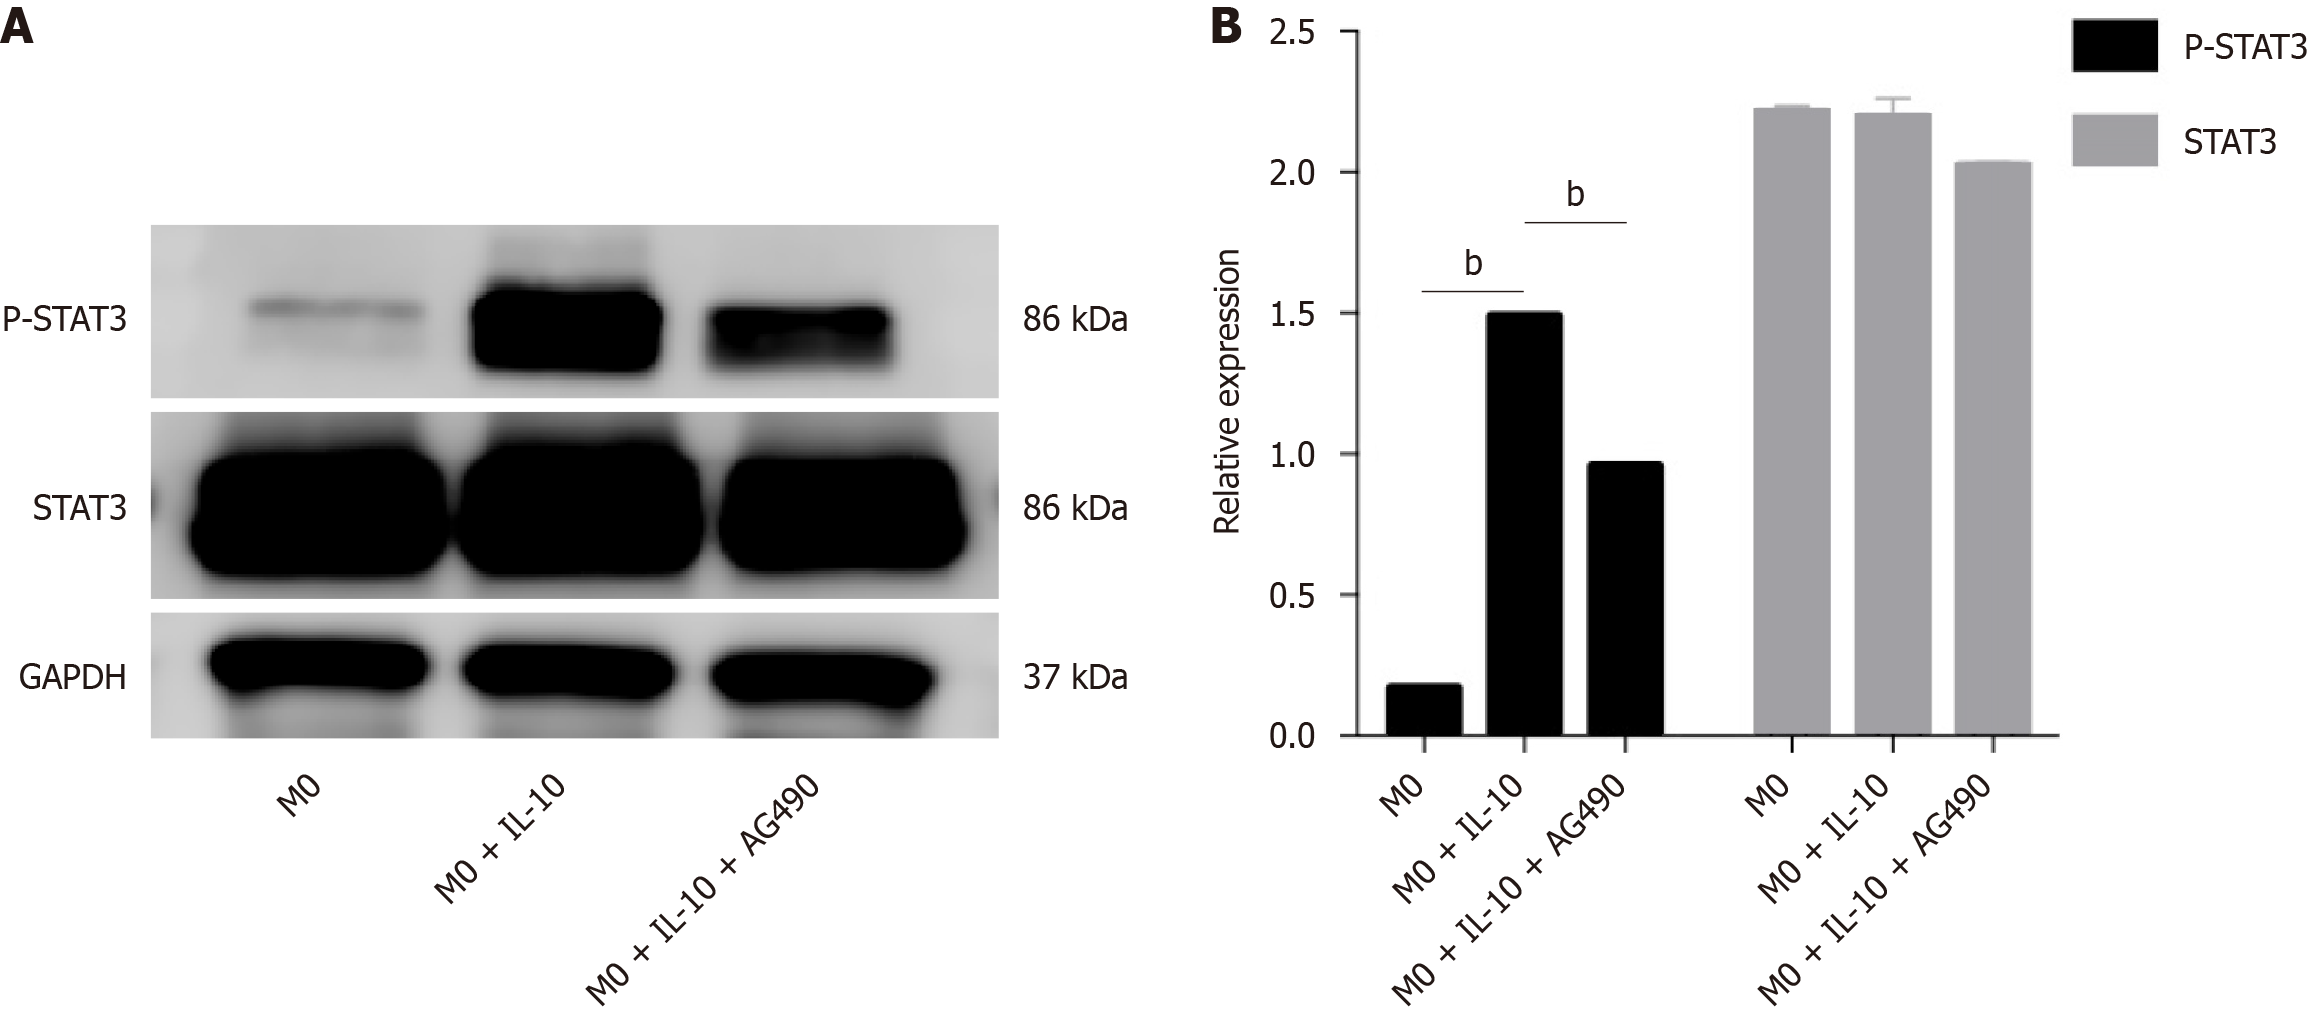
Figure 6 The effect of interleukin-10 treatment on the activation of signal transducer and activator of transcription 3 in macrophages.
A: Western analysis of signal transducer and activator of transcription 3 (STAT3) and phosphorylated STAT3 protein in macrophages treated with/without interleukin-10. Glyceraldehyde-3-phosphate dehydrogenase (GAPDH) as a loading control. Tyrphostin AG490 was used at 10 μM concentration in culture medium as a phosphorylation specific inhibitor of STAT3. Data are representative of three independent experiments; B: Density values were measured by using Image J software for the representative blot shown. n = 3 biological replicates. Data are represented as mean ± SD, statistically significant difference at the levels as aP < 0.05 and bP < 0.01. IL-10: Interleukin-10; p-STAT3: Phosphorylated signal transducer and activator of transcription 3.
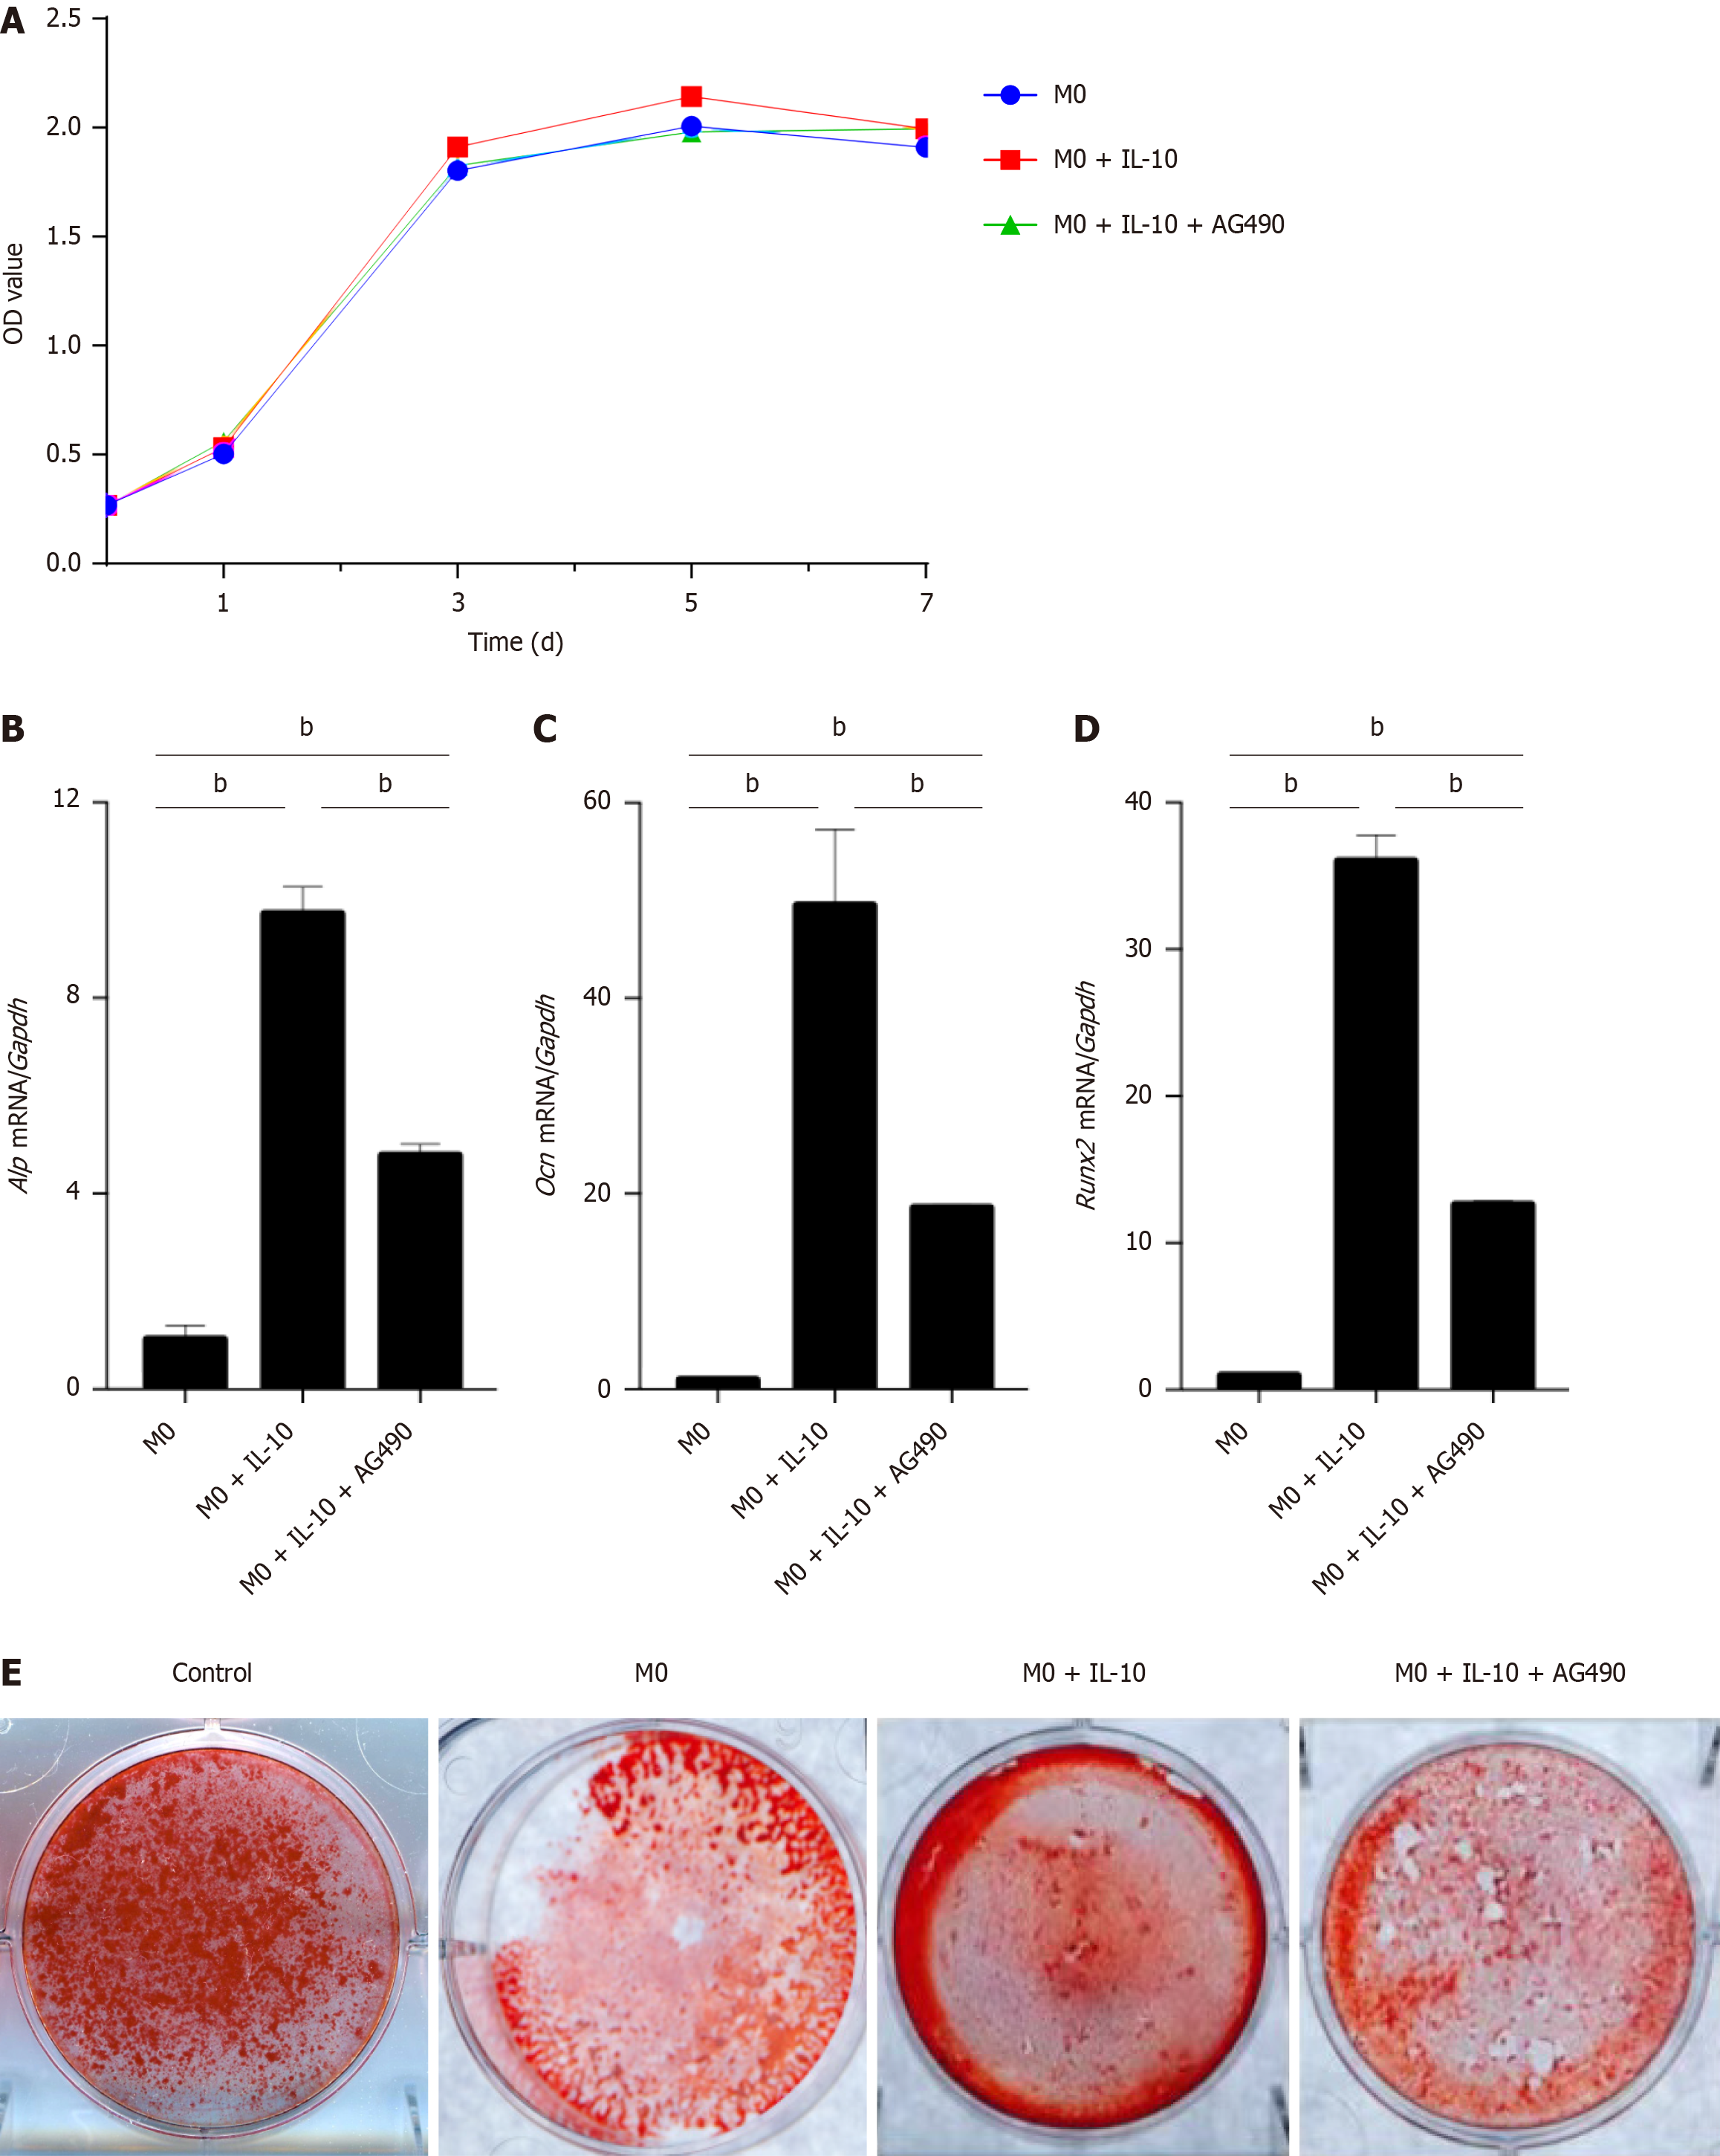
Figure 7 The effect of interleukin-10 acting on macrophages after the inhibition of signal transducer and activator of transcription 3.
A: Cell Counting Kit-8 assay of the bone marrow mesenchymal stem cells (BMSCs) proliferation after co-cultured with different groups of macrophages: M0, M0 + interleukin-10 (IL-10), M0 + IL-10 + Tyrphostin AG490 for 1, 3, 5, and 7 d; B: Real-time polymerase chain reaction (PCR) analysis for Alkaline phosphatase mRNA level in different groups of BMSCs (groups as above); C: Real-time PCR analysis for osteocalcin mRNA level in different groups of BMSCs (groups as above); D: Real-time PCR analysis for recombinant runt related transcription factor 2 mRNA level in different groups of BMSCs (groups as above). The expression levels were normalized to the expression of glyceraldehyde-3-phosphate dehydrogenase; E: Quantitative measurement of calcium mineral deposition was stained by Alizarin Red S staining after 14 d of osteogenic induction on BMSCs. n = 3 biological replicates. Data are represented as mean ± SD, statistically significant difference at the levels as aP < 0.05 and bP < 0.01. Alp: Alkaline phosphatase; Ocn: Osteocalcin; Runx2: Recombinant runt related transcription factor 2; Gapdh: Glyceraldehyde-3-phosphate dehydrogenase; IL-10: Interleukin-10.
- Citation: Lyu MH, Bian C, Dou YP, Gao K, Xu JJ, Ma P. Effects of interleukin-10 treated macrophages on bone marrow mesenchymal stem cells via signal transducer and activator of transcription 3 pathway. World J Stem Cells 2024; 16(5): 560-574
- URL: https://www.wjgnet.com/1948-0210/full/v16/i5/560.htm
- DOI: https://dx.doi.org/10.4252/wjsc.v16.i5.560


