Copyright
©The Author(s) 2024.
World J Stem Cells. Dec 26, 2024; 16(12): 1062-1085
Published online Dec 26, 2024. doi: 10.4252/wjsc.v16.i12.1062
Published online Dec 26, 2024. doi: 10.4252/wjsc.v16.i12.1062
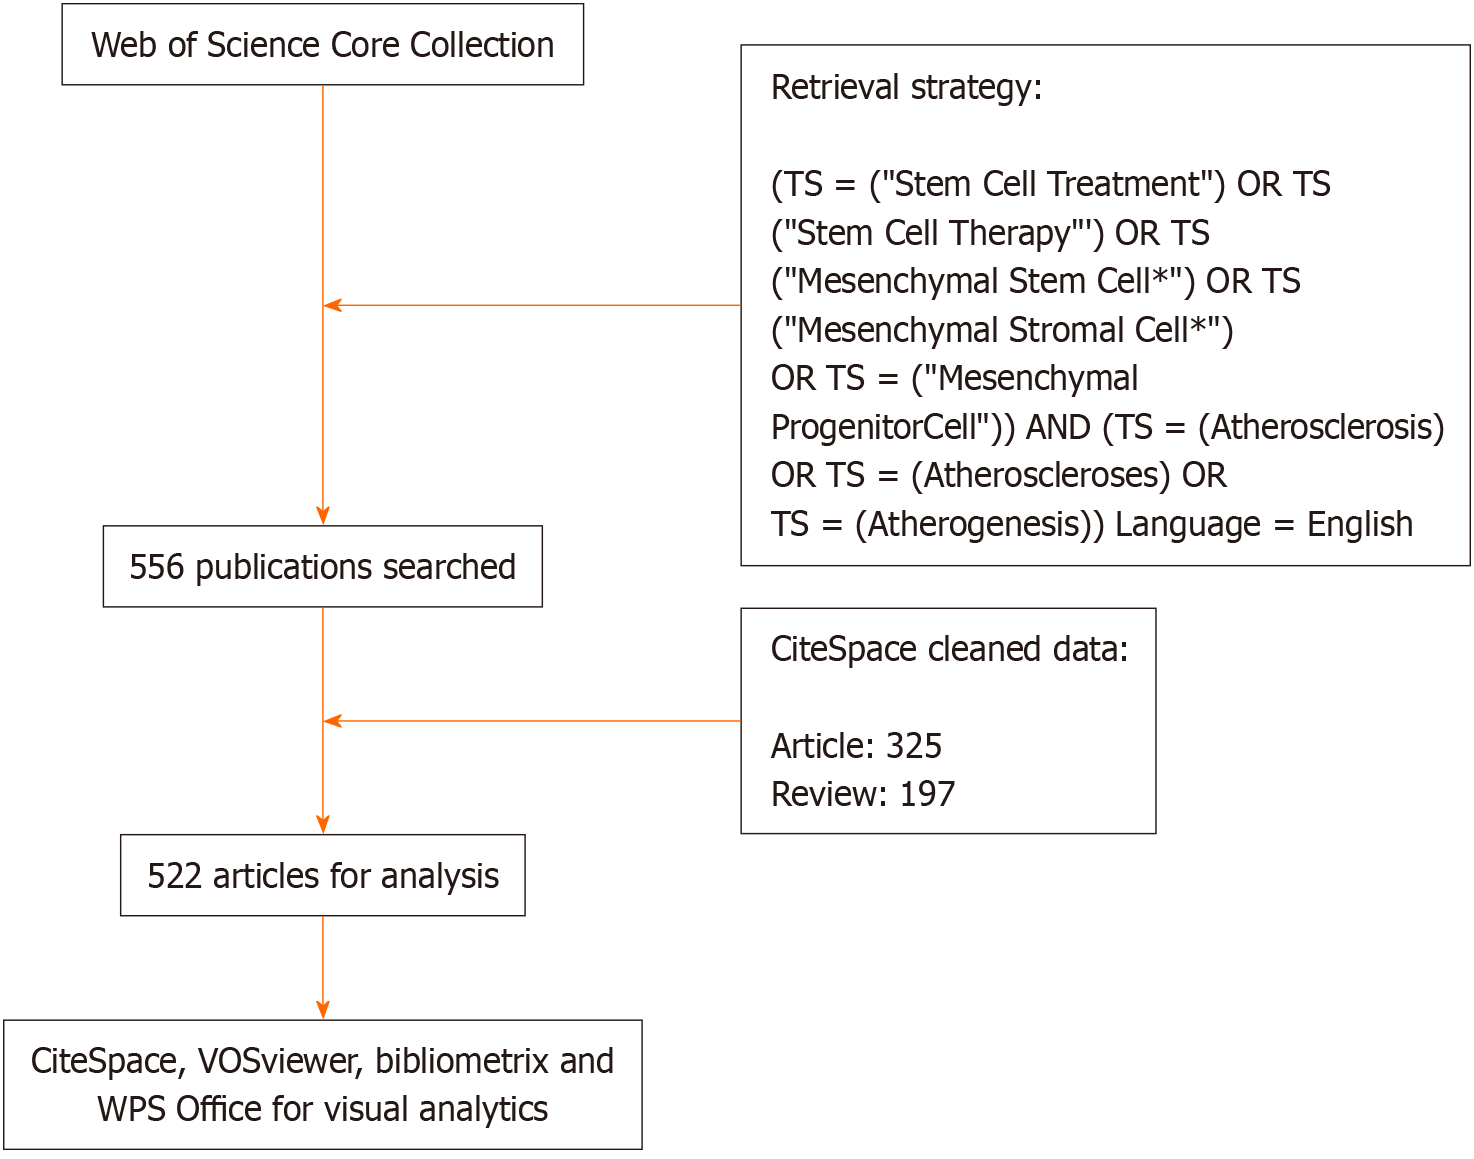
Figure 1 Flowchart of the screening process.
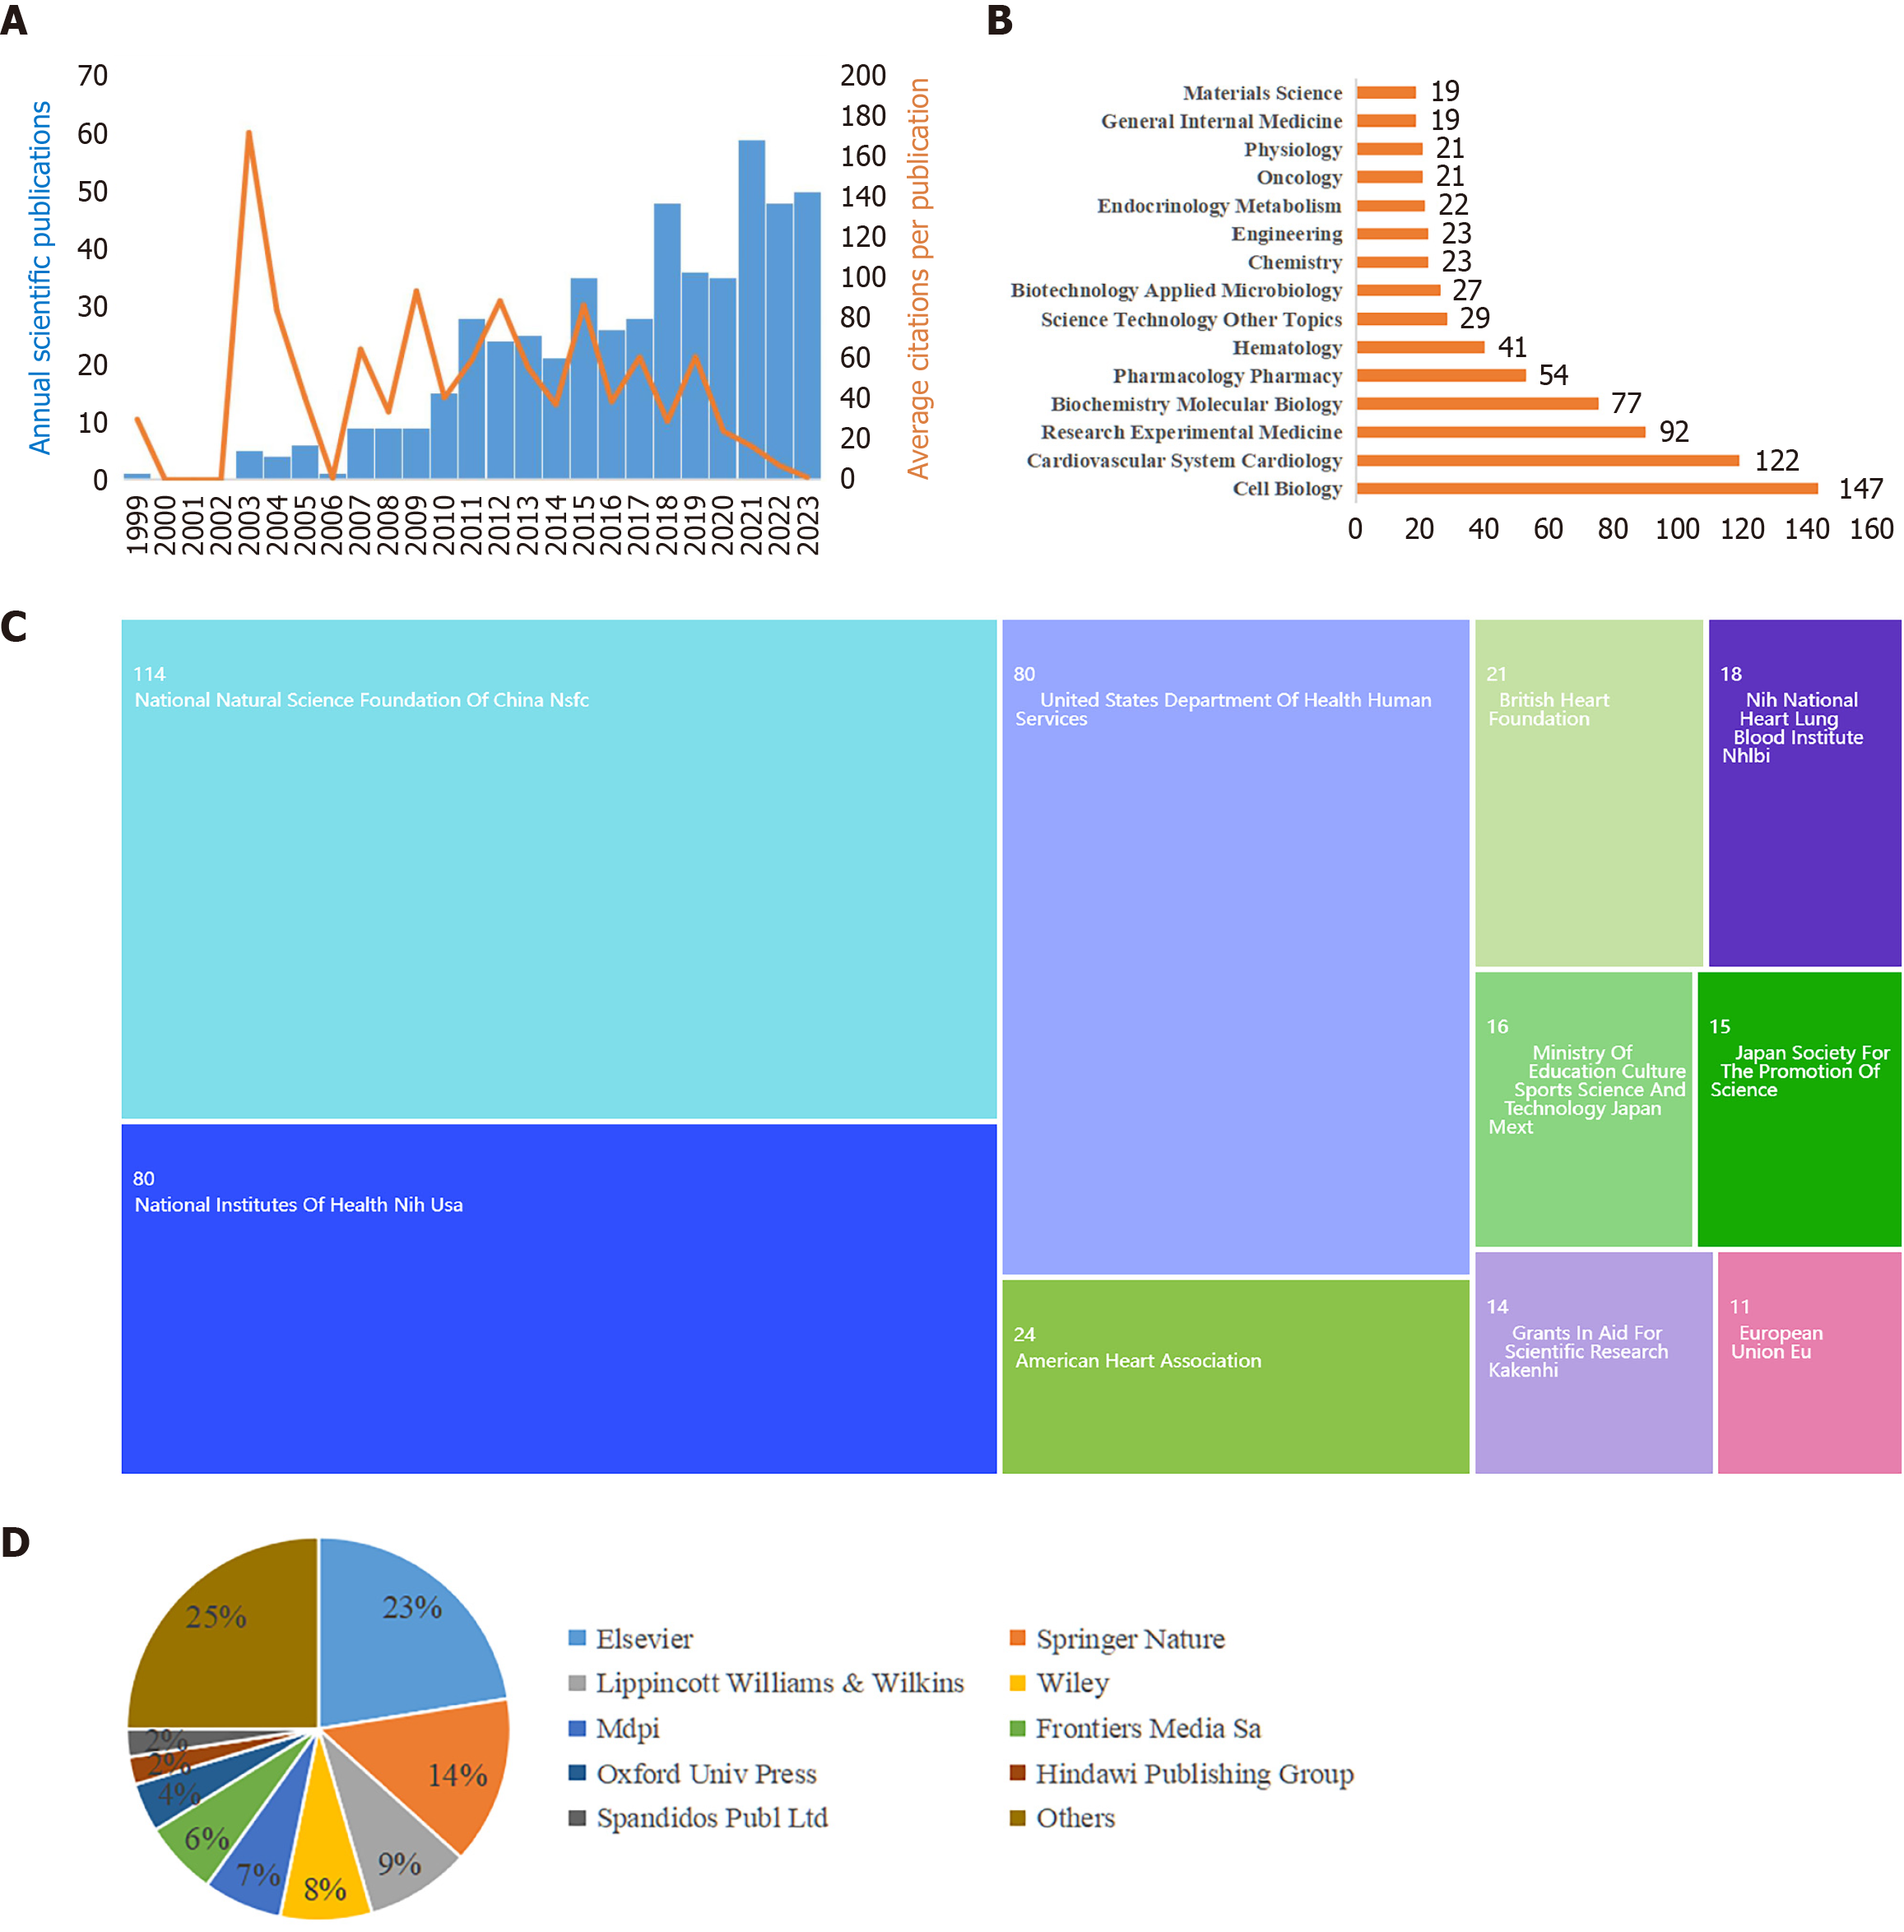
Figure 2 Visual analysis of global publishing characteristics.
A: Number of articles published per year and average number of citations per year; B: Areas of research covered by the publications; C: The funding organization of the publications; D: Publishers of the articles.
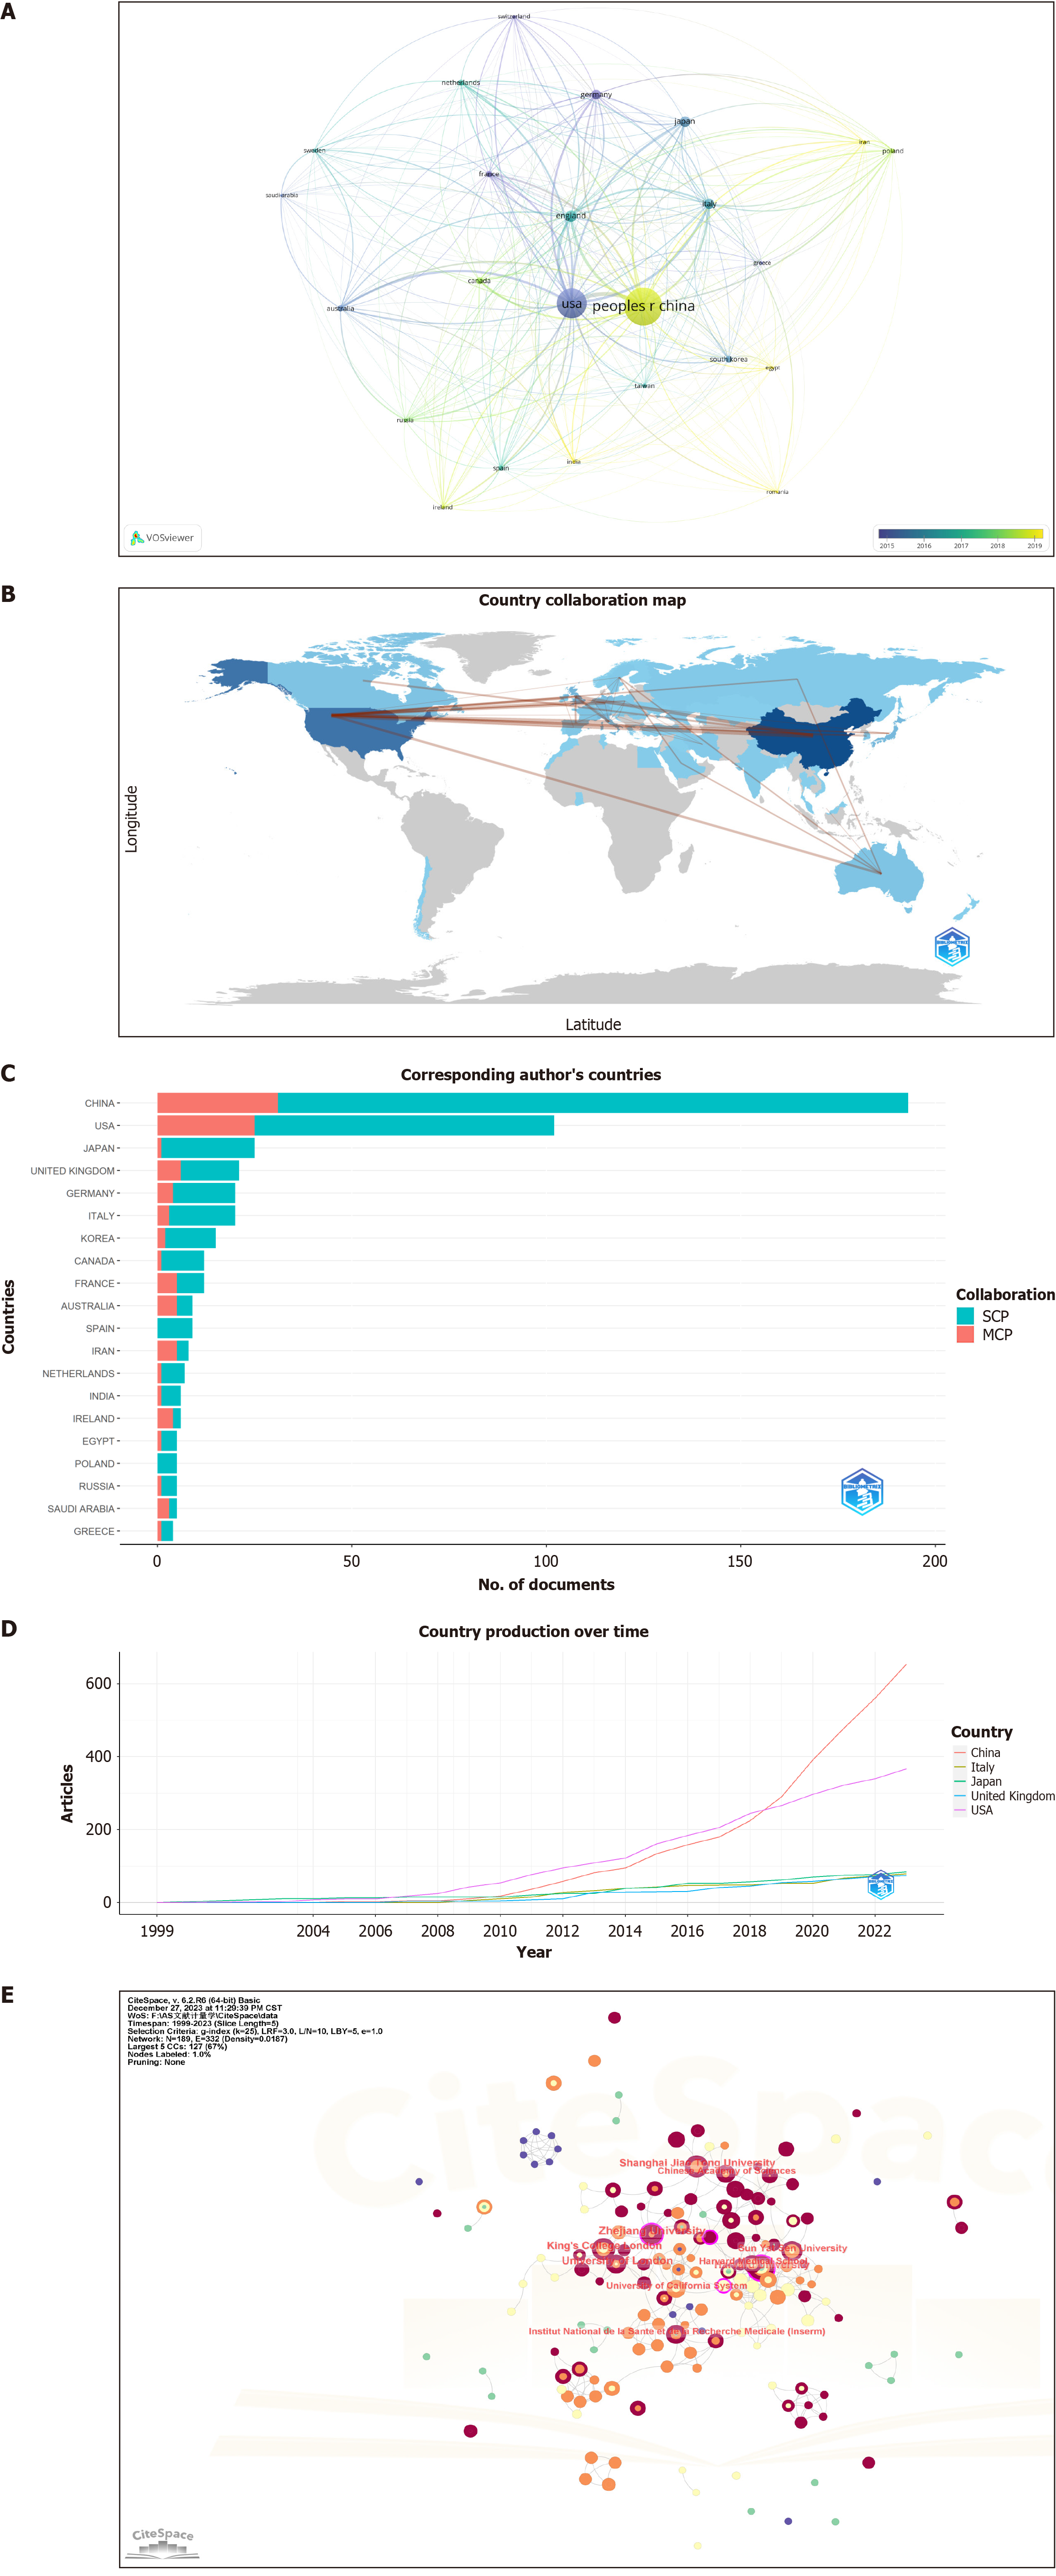
Figure 3 Visual analysis of countries/regions and institutions.
A: Network of countries/regions; B: Collaboration network of countries/regions; C: Corresponding authors’ nationality; D: Country production over time; E: Collaboration network of institutions. SCP: Single country publications; MCP: Multiple country publications.
Figure 4 Visual analysis of journals and co-cited journals.
A and B: Network of article source journals; C: Core sources according to Bradford’s law; D: Network of co-cited journals; E: Dual-map overlay of journals.
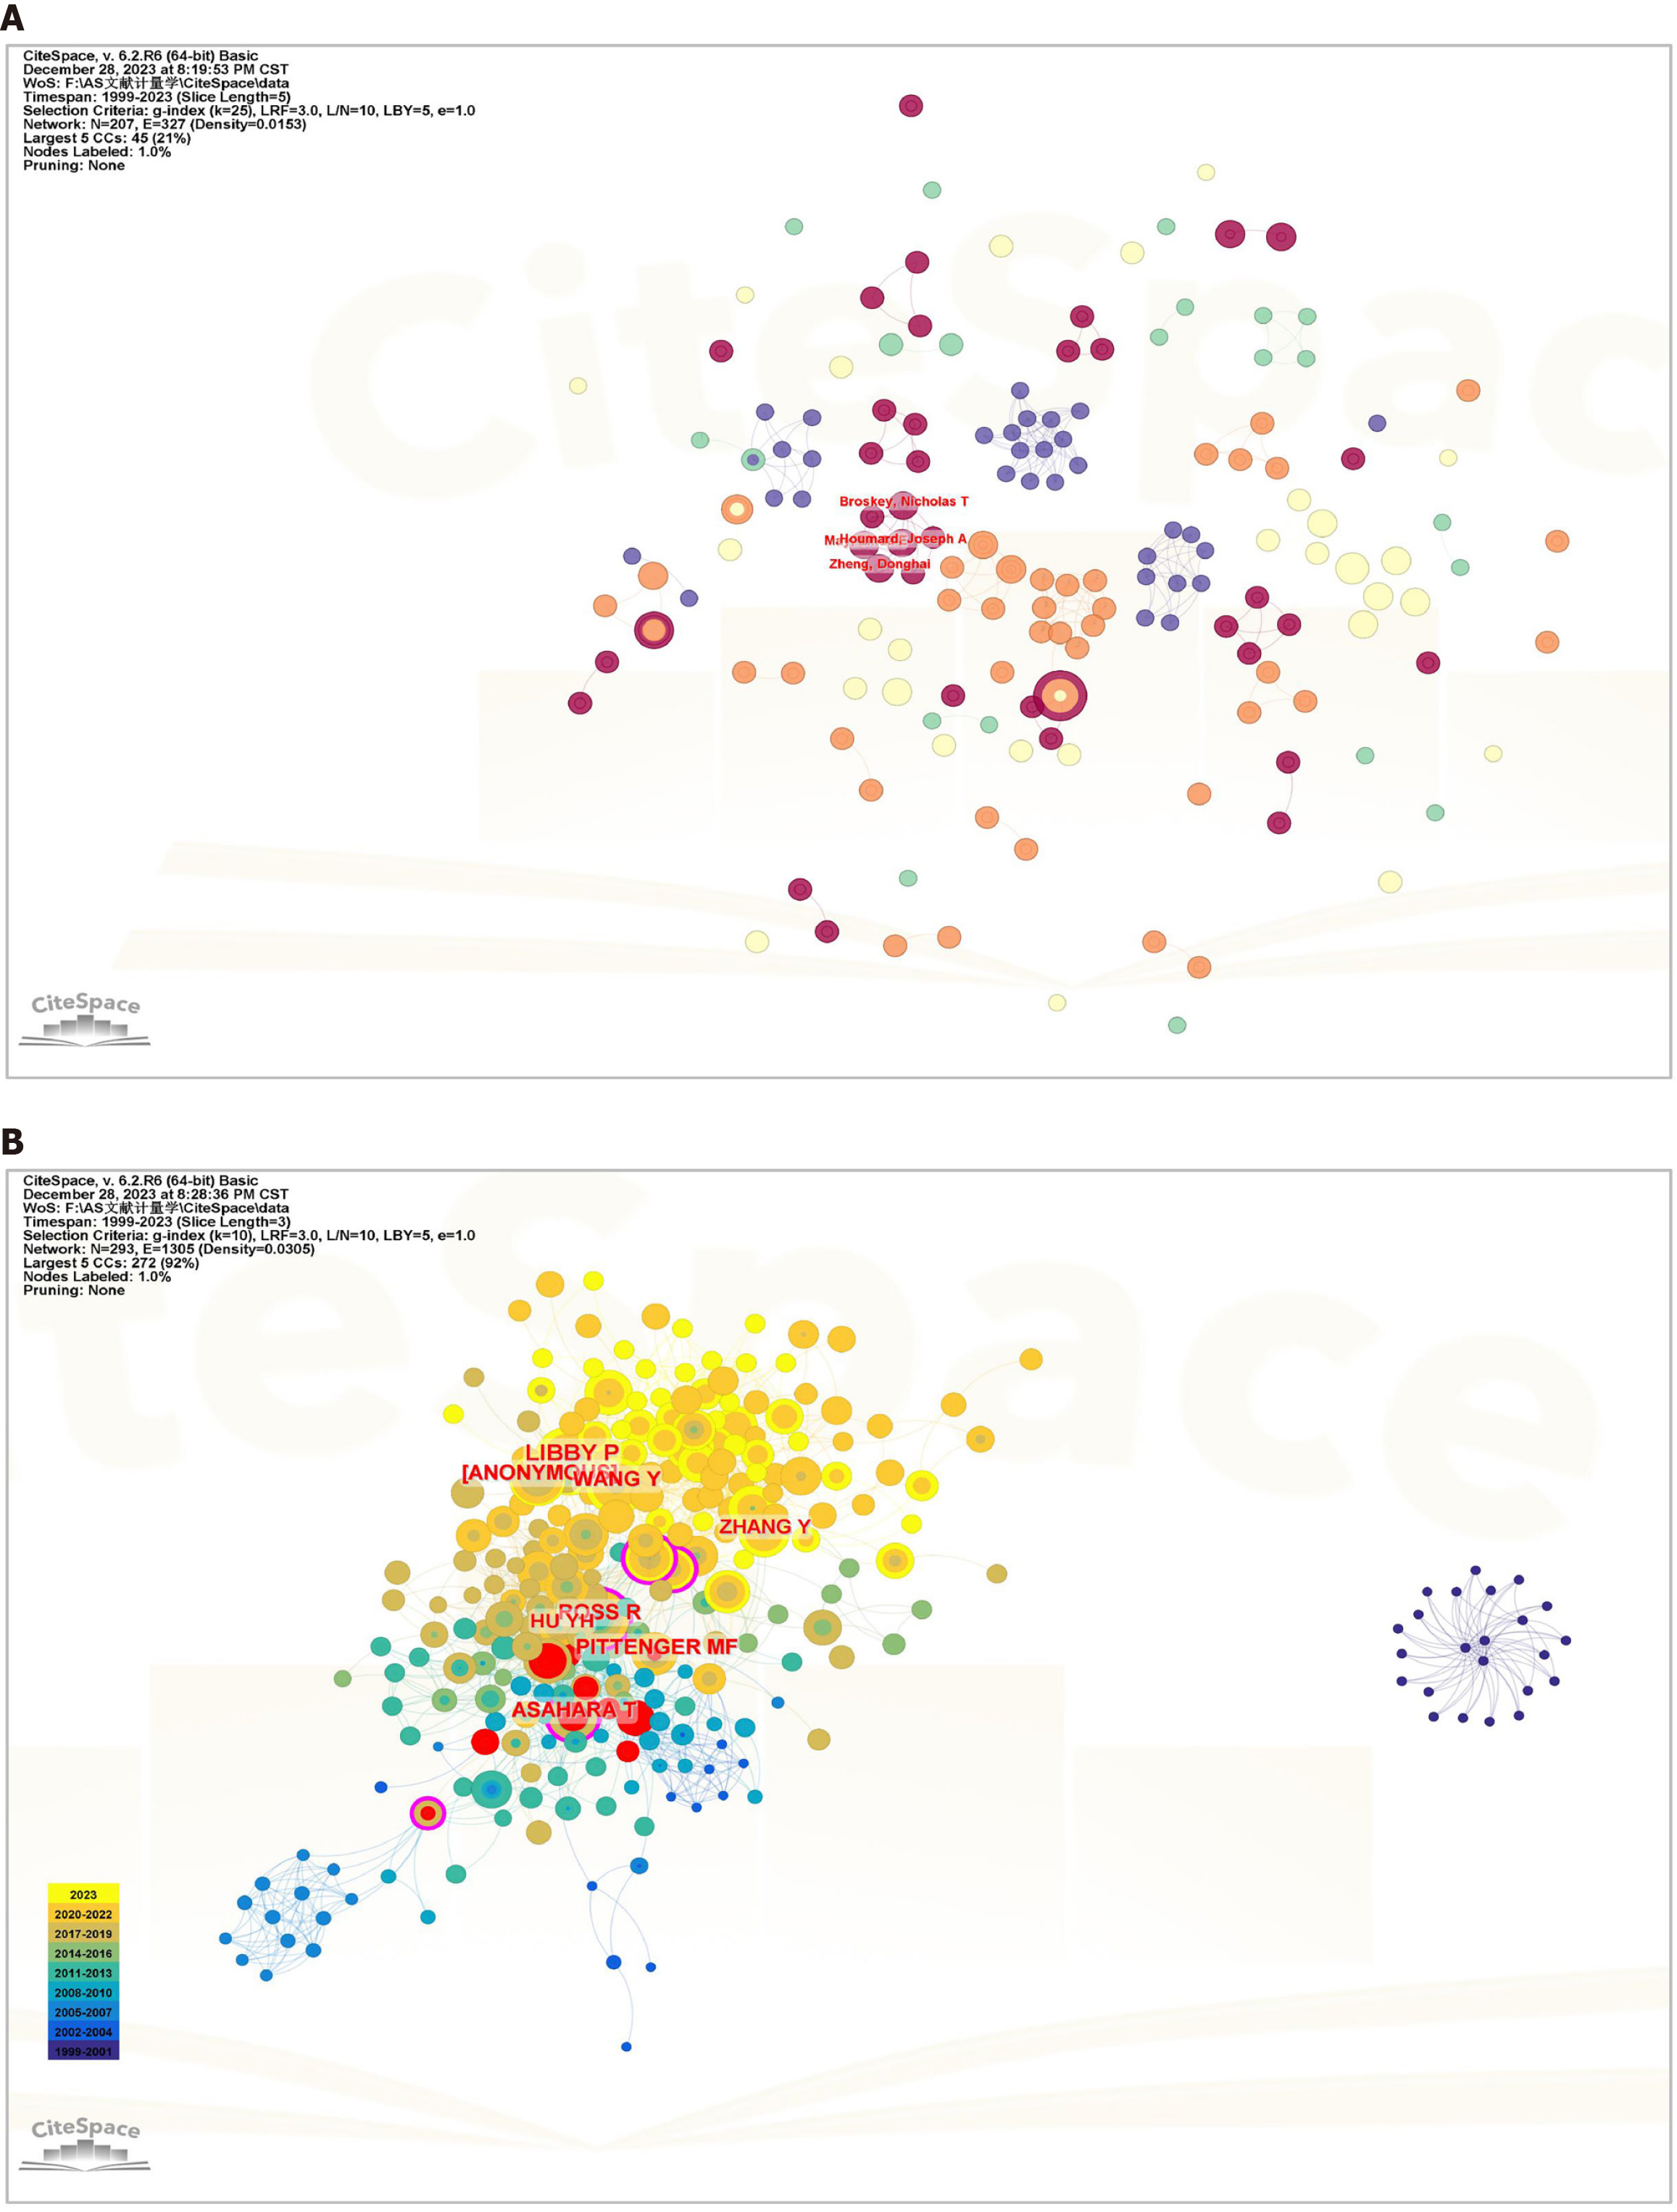
Figure 5 Visual analysis of authors and co-cited authors.
A: Collaboration network of authors; B: Collaboration network of co-cited authors.
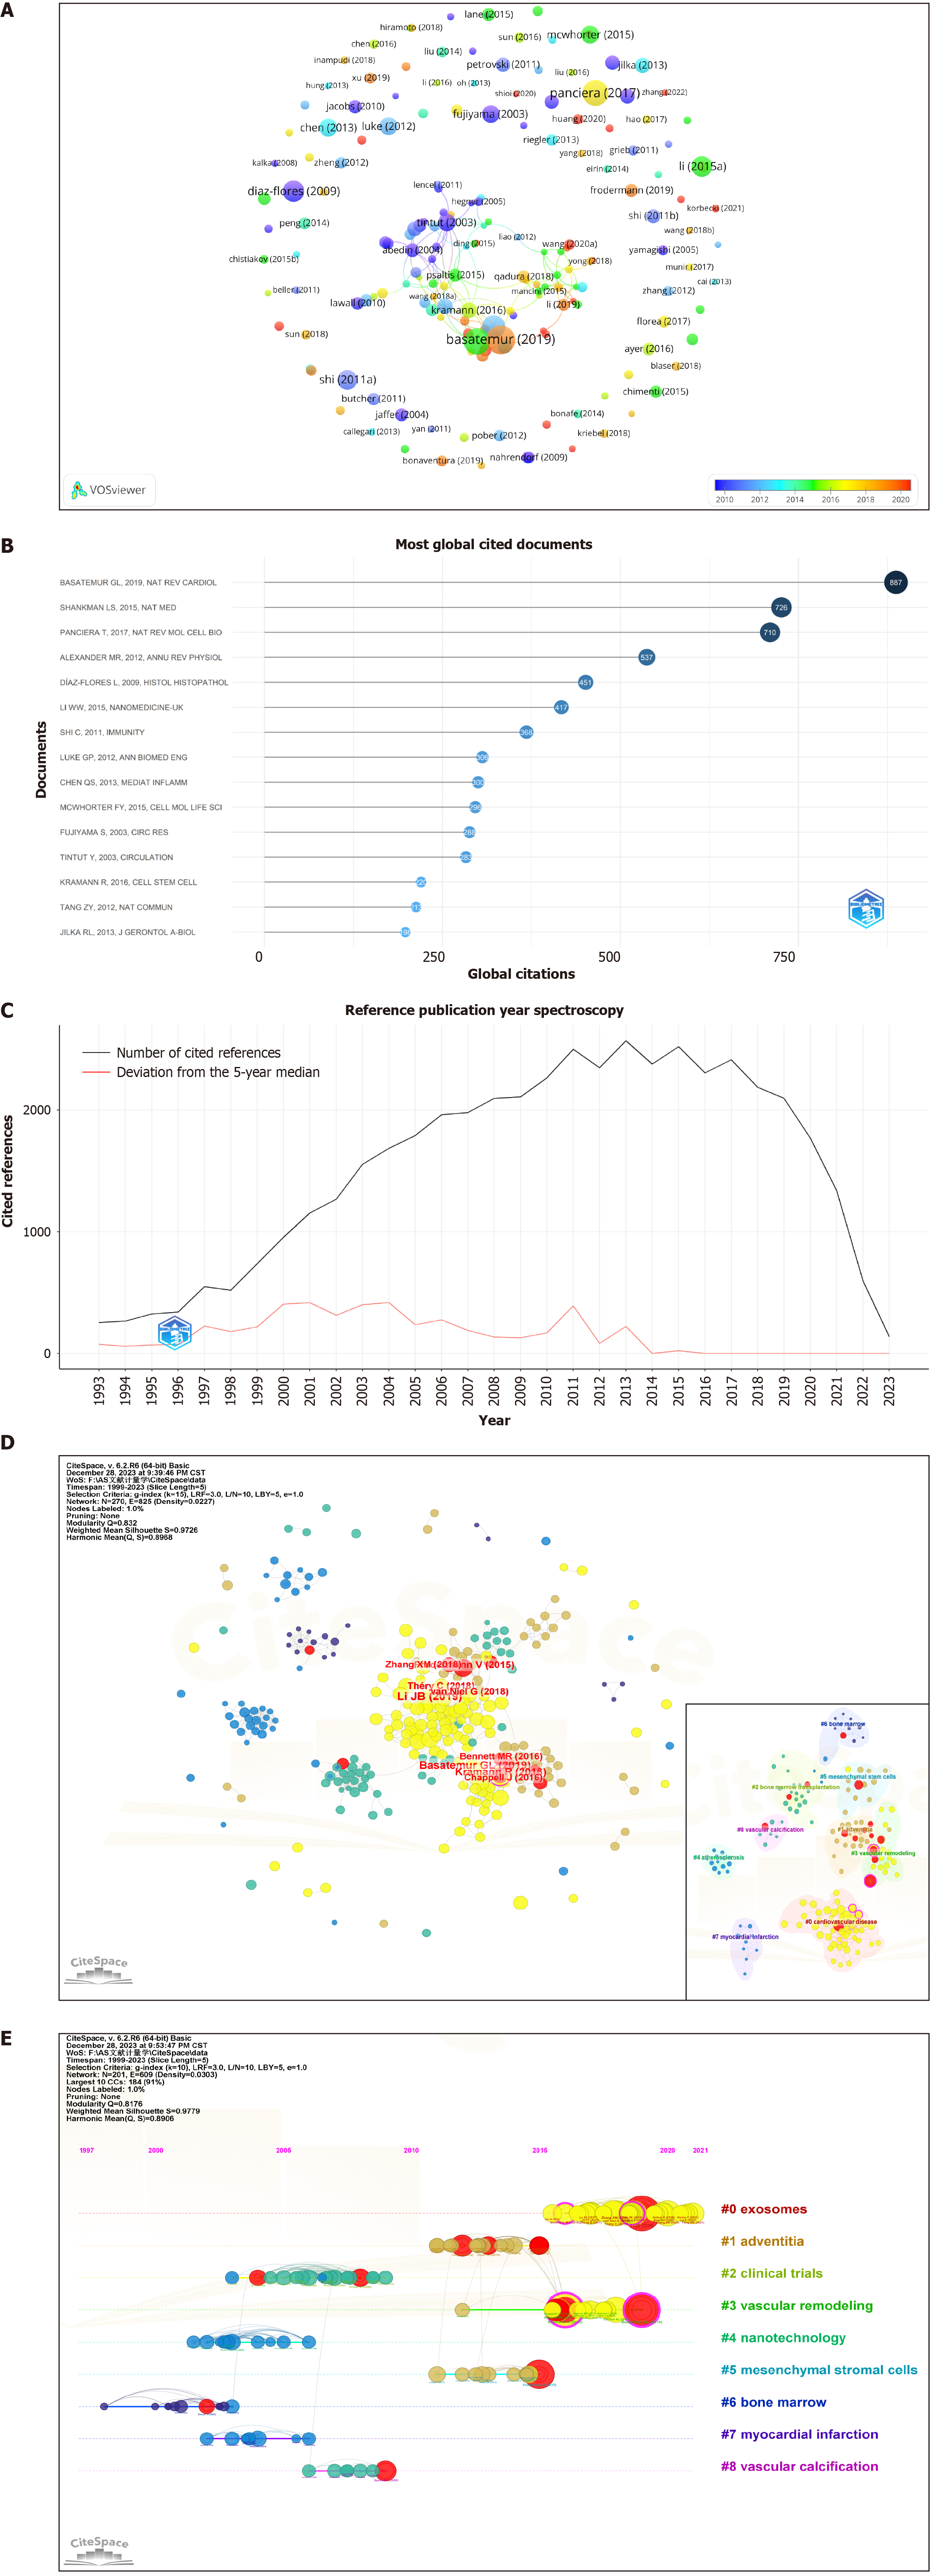
Figure 6 Visual analysis of publications and co-cited references.
A and B: Network of publications; C: Reference records for each year; D: Network and cluster analysis of co-cited references; E: Clustering timeline map of co-cited references.
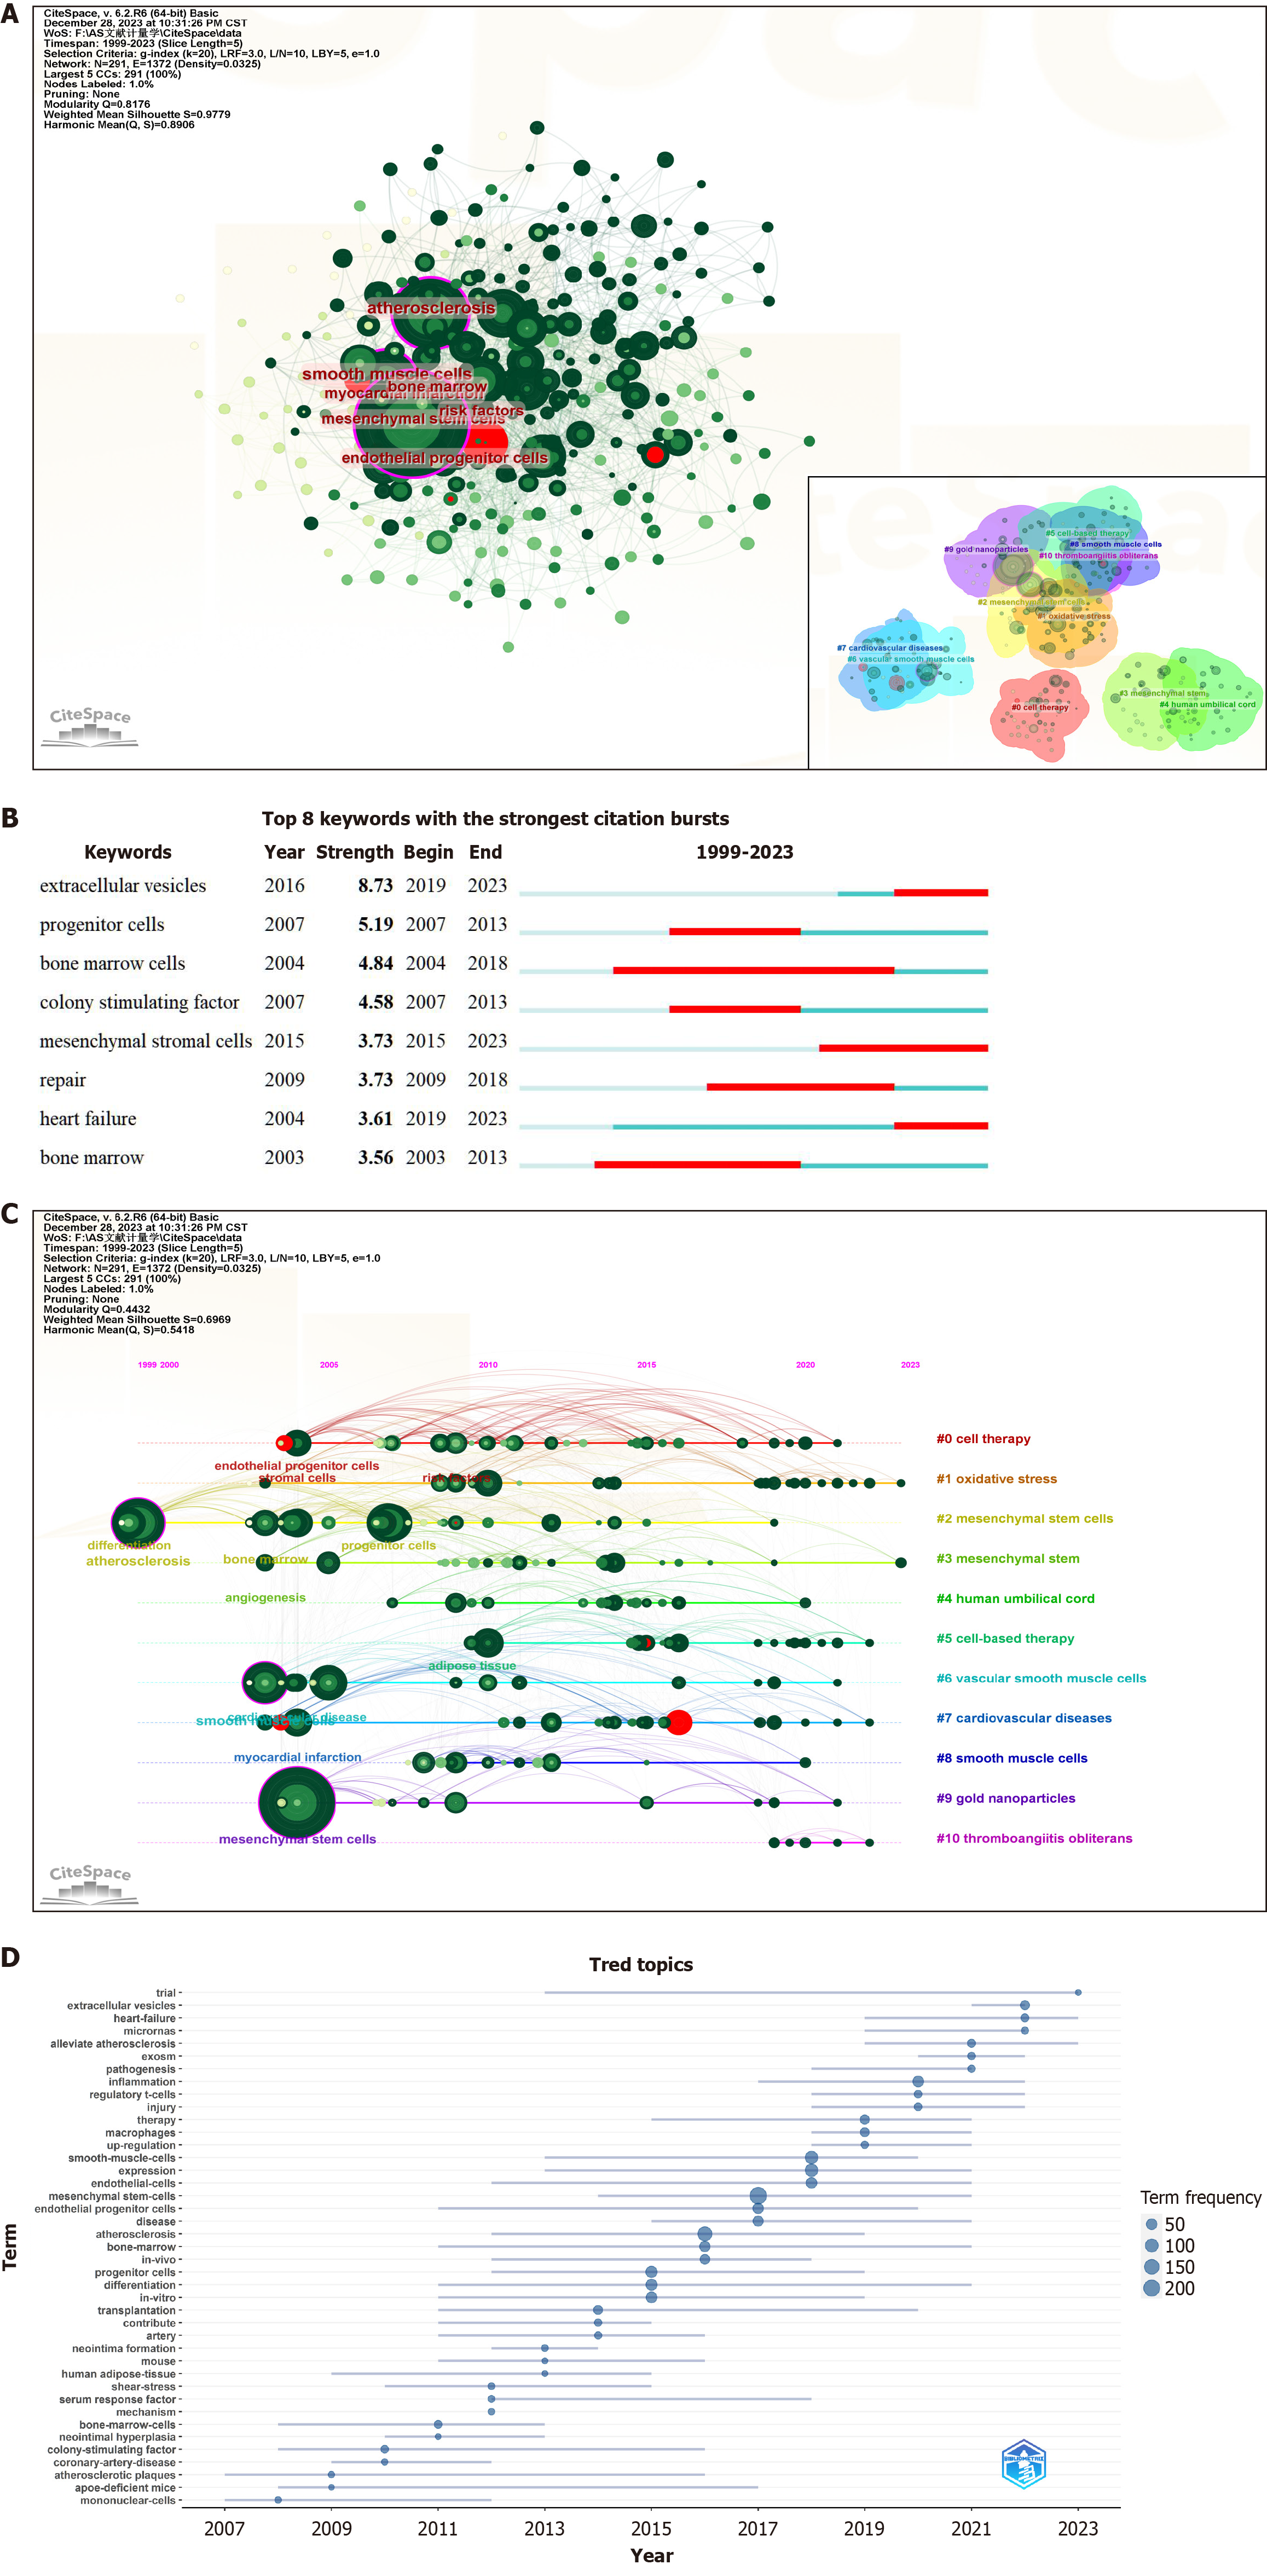
Figure 7 Visual analysis of keywords.
A: Network and cluster analysis of keywords; B: Top 8 keywords with the strongest citation bursts; C: Clustering timeline map of keywords; D: Thematic evolution of the field.
- Citation: Cheng X, Li YL, Wang H, Zhang RJ, Fan KY, Qi XT, Zheng GP, Dong HL. Mesenchymal stem cell therapy in atherosclerosis: A bibliometric and visual analysis. World J Stem Cells 2024; 16(12): 1062-1085
- URL: https://www.wjgnet.com/1948-0210/full/v16/i12/1062.htm
- DOI: https://dx.doi.org/10.4252/wjsc.v16.i12.1062


