Copyright
©The Author(s) 2023.
World J Stem Cells. Jun 26, 2023; 15(6): 589-606
Published online Jun 26, 2023. doi: 10.4252/wjsc.v15.i6.589
Published online Jun 26, 2023. doi: 10.4252/wjsc.v15.i6.589
Figure 1 Single cell RNA sequencing analysis of maxillary processes from wild-type and Cd271 knockout mice.
We identified 21 clusters of cells, and the single cell RNA sequencing data were characterized. A: Schematic representation of the experimental workflow. The Cd271 knockout and wild-type maxillary processes were collected from mouse embryos at 16.5 d. After genotyping, cells were suspended as single cells, and the cDNA library was constructed and sequenced; B: Cells extracted from the samples were subjected to Uniform Manifold Approximation and Projection hierarchical clustering and color-coded by cluster grouping, predominant cell type, and sample origin; C: Heatmap showing expression levels of differentially expressed genes in each cluster; D: Dot plot showing prominent marker genes for each cell type (mesenchymal cells, epithelial, muscle cell, macrophage, glial, T cell, endothelial, and perivascular); E: Pie chart showing the number of each cell type; F: Histogram showing the number and proportion of cells from wild-type and Cd271 knockout mice. UMAP: Uniform Manifold Approximation and Projection; KO: Knockout; WT: Wild-type.
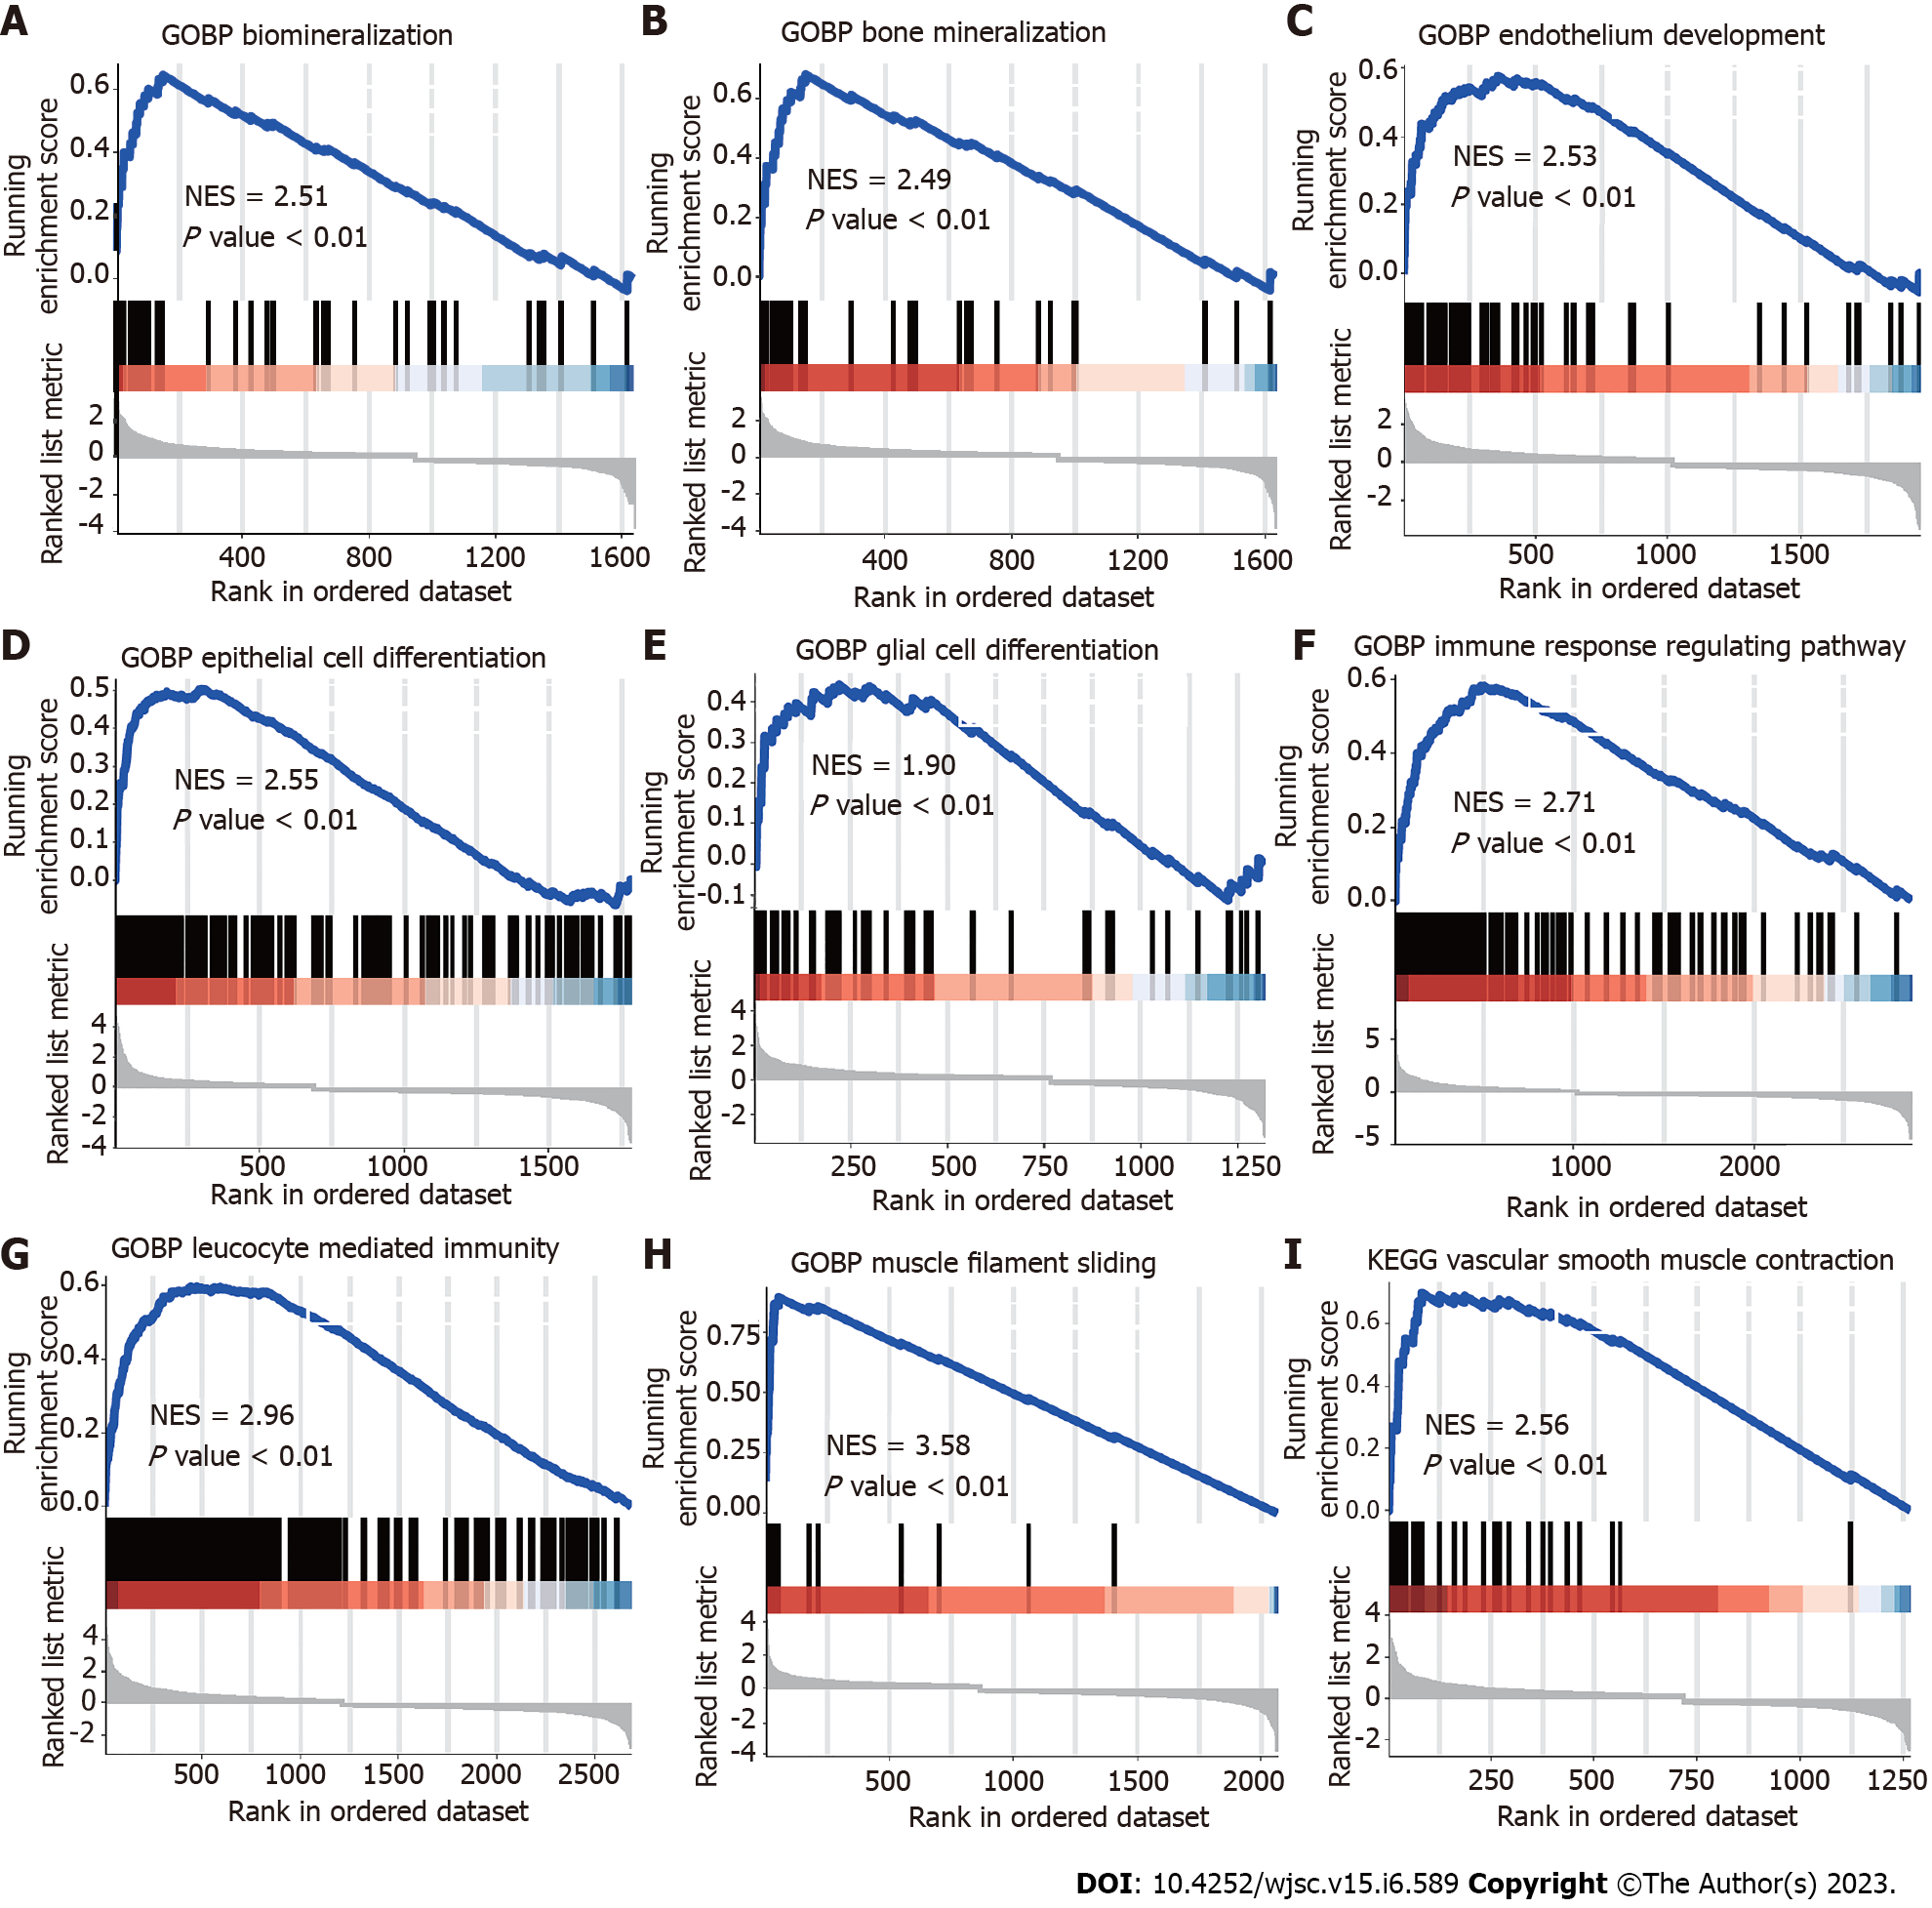
Figure 2 Gene set enrichment analysis plots for representative signaling pathways upregulated in maxillary process.
Gene set enrichment analysis enriched differentially expressed genes into multifunctional gene networks. A and B: Representative gene set enrichment analysis maps for mesenchymal stem cells; C: Endothelial cells; D: Epithelial cells; E: Glia; F: T cells; G: Macrophages; H: Muscle cells; I: Perivascular cells. Normalized enrichment score normalized enrichment score, corrected for multiple comparisons using false discovery rate method, P values shown in plots. NES: Normalized enrichment score.
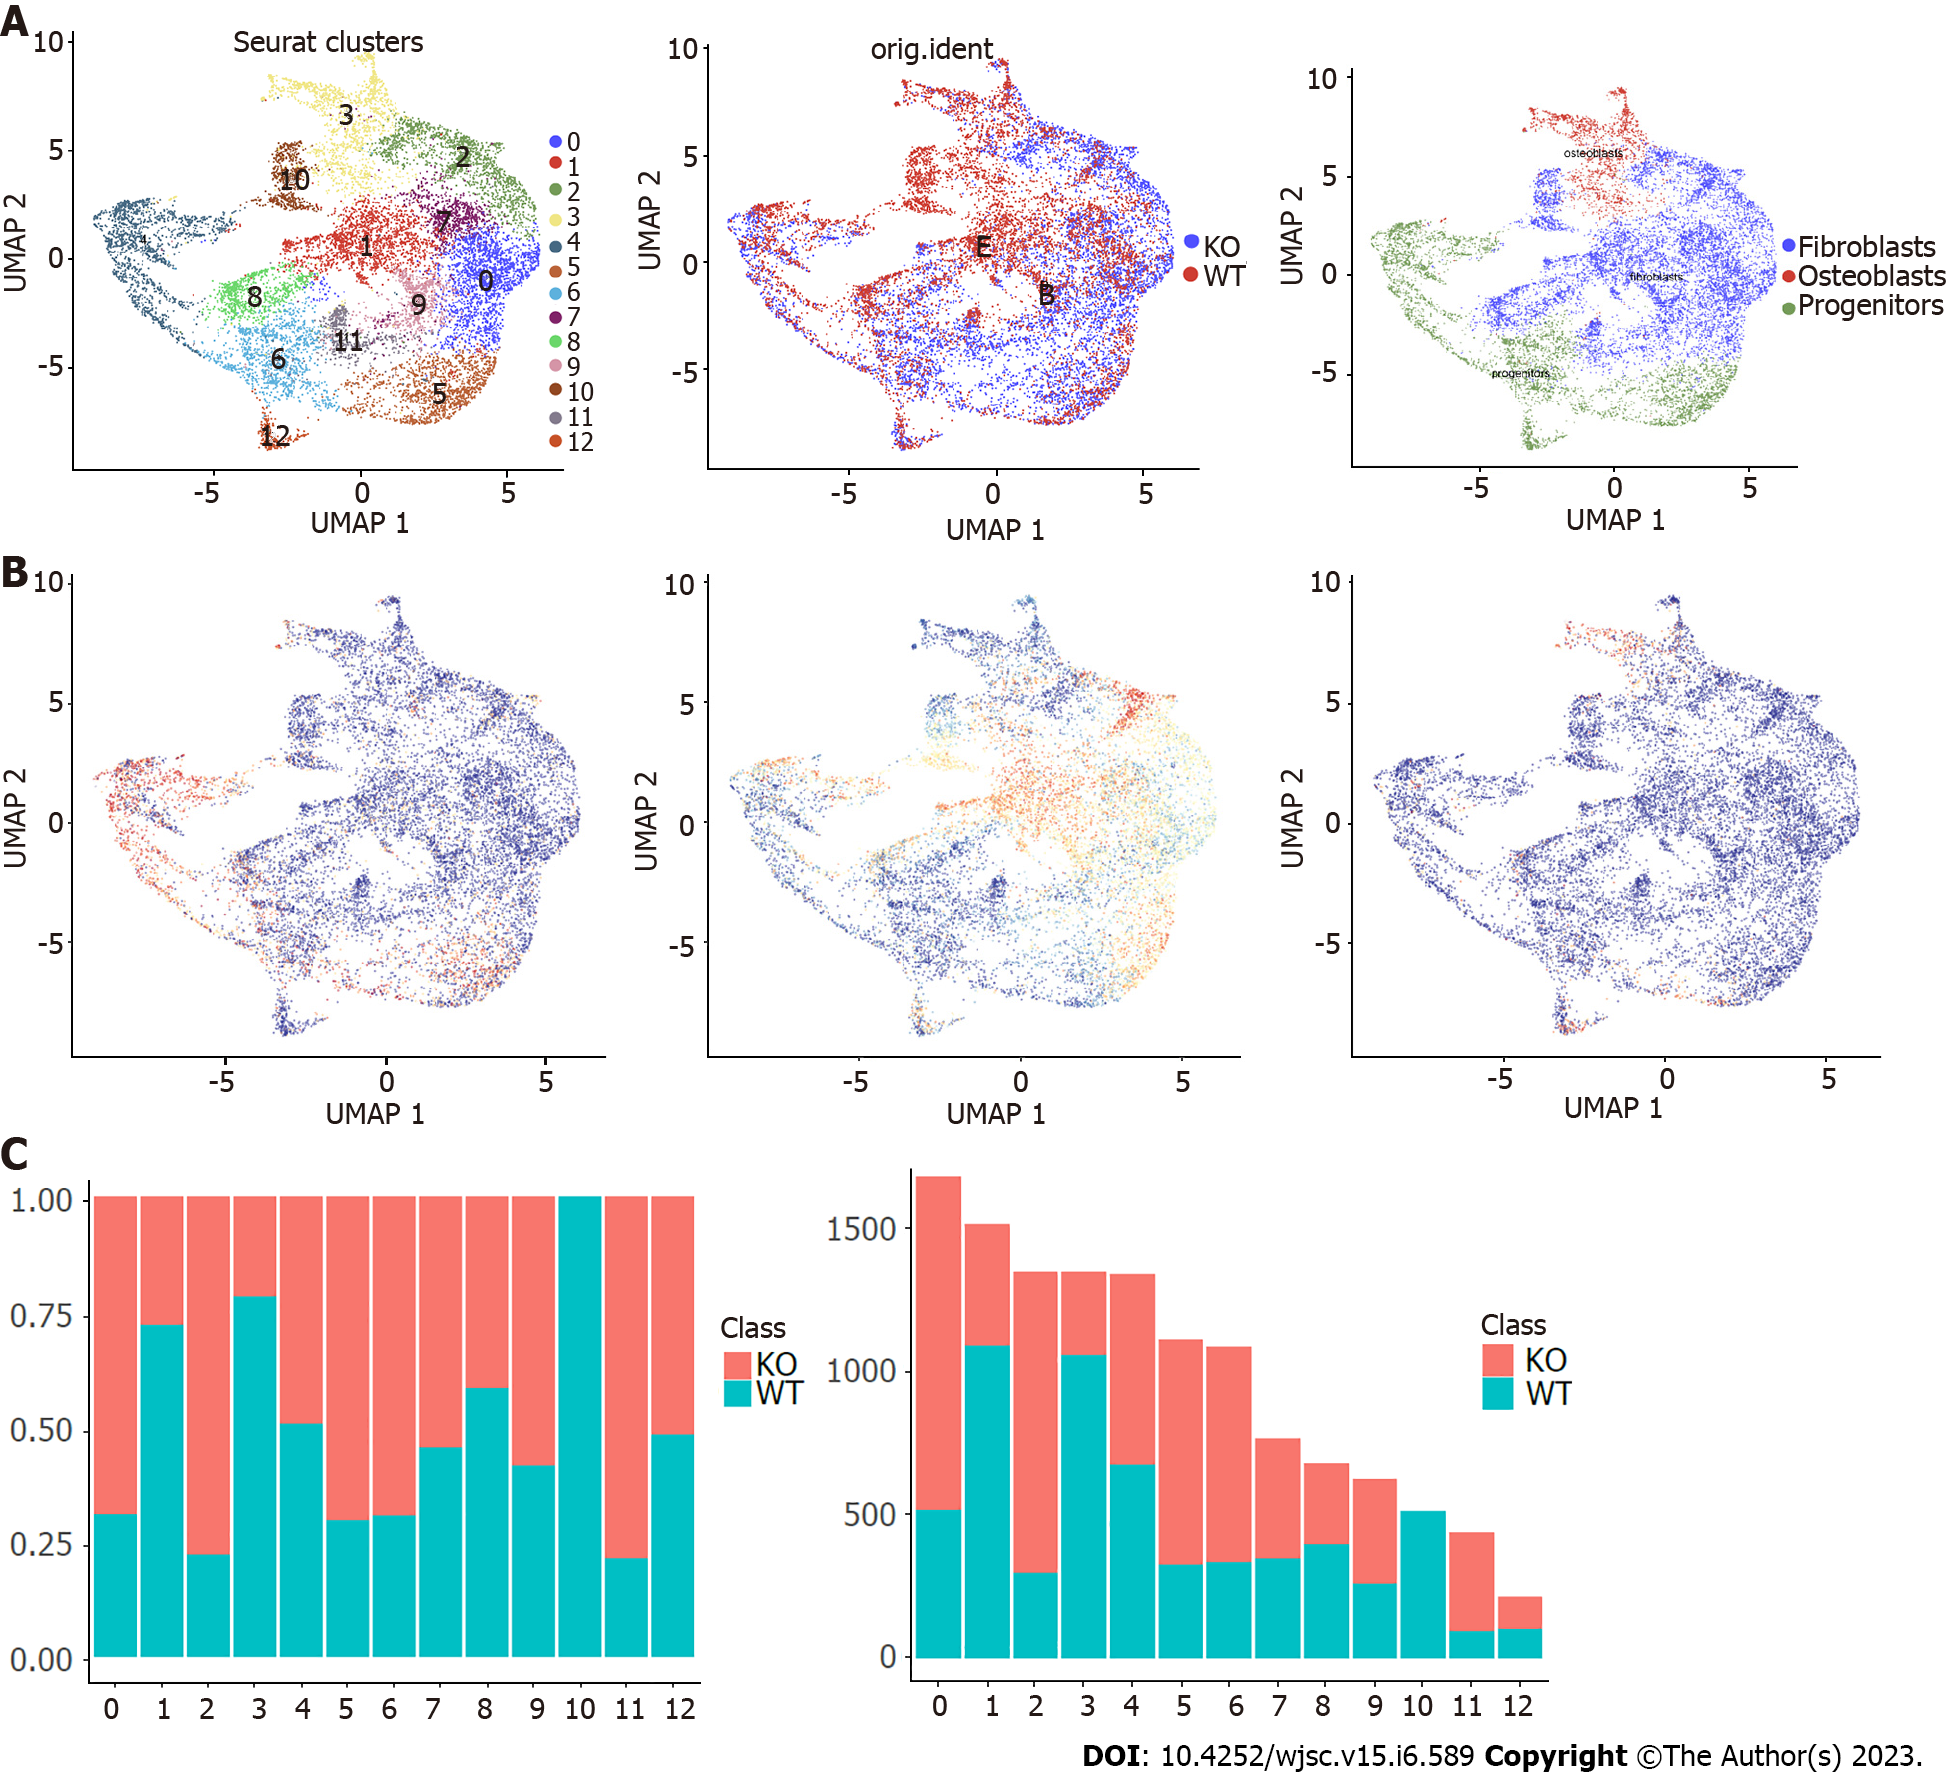
Figure 3 Further cluster analysis of mesenchymal stem cells.
A: Mesenchymal stem cells were reclustered and color-coded according to cluster, sample origin and cell type; B: Feature scores of progenitors, fibroblasts and osteoblasts marker genes were displayed in the Uniform Manifold Approximation and Projection plot; C: Histogram showing the proportion and the number of cells in each cluster of wild-type and Cd271 knockout mice. UMAP: Uniform Manifold Approximation and Projection; KO: Knockout; WT: Wild-type.
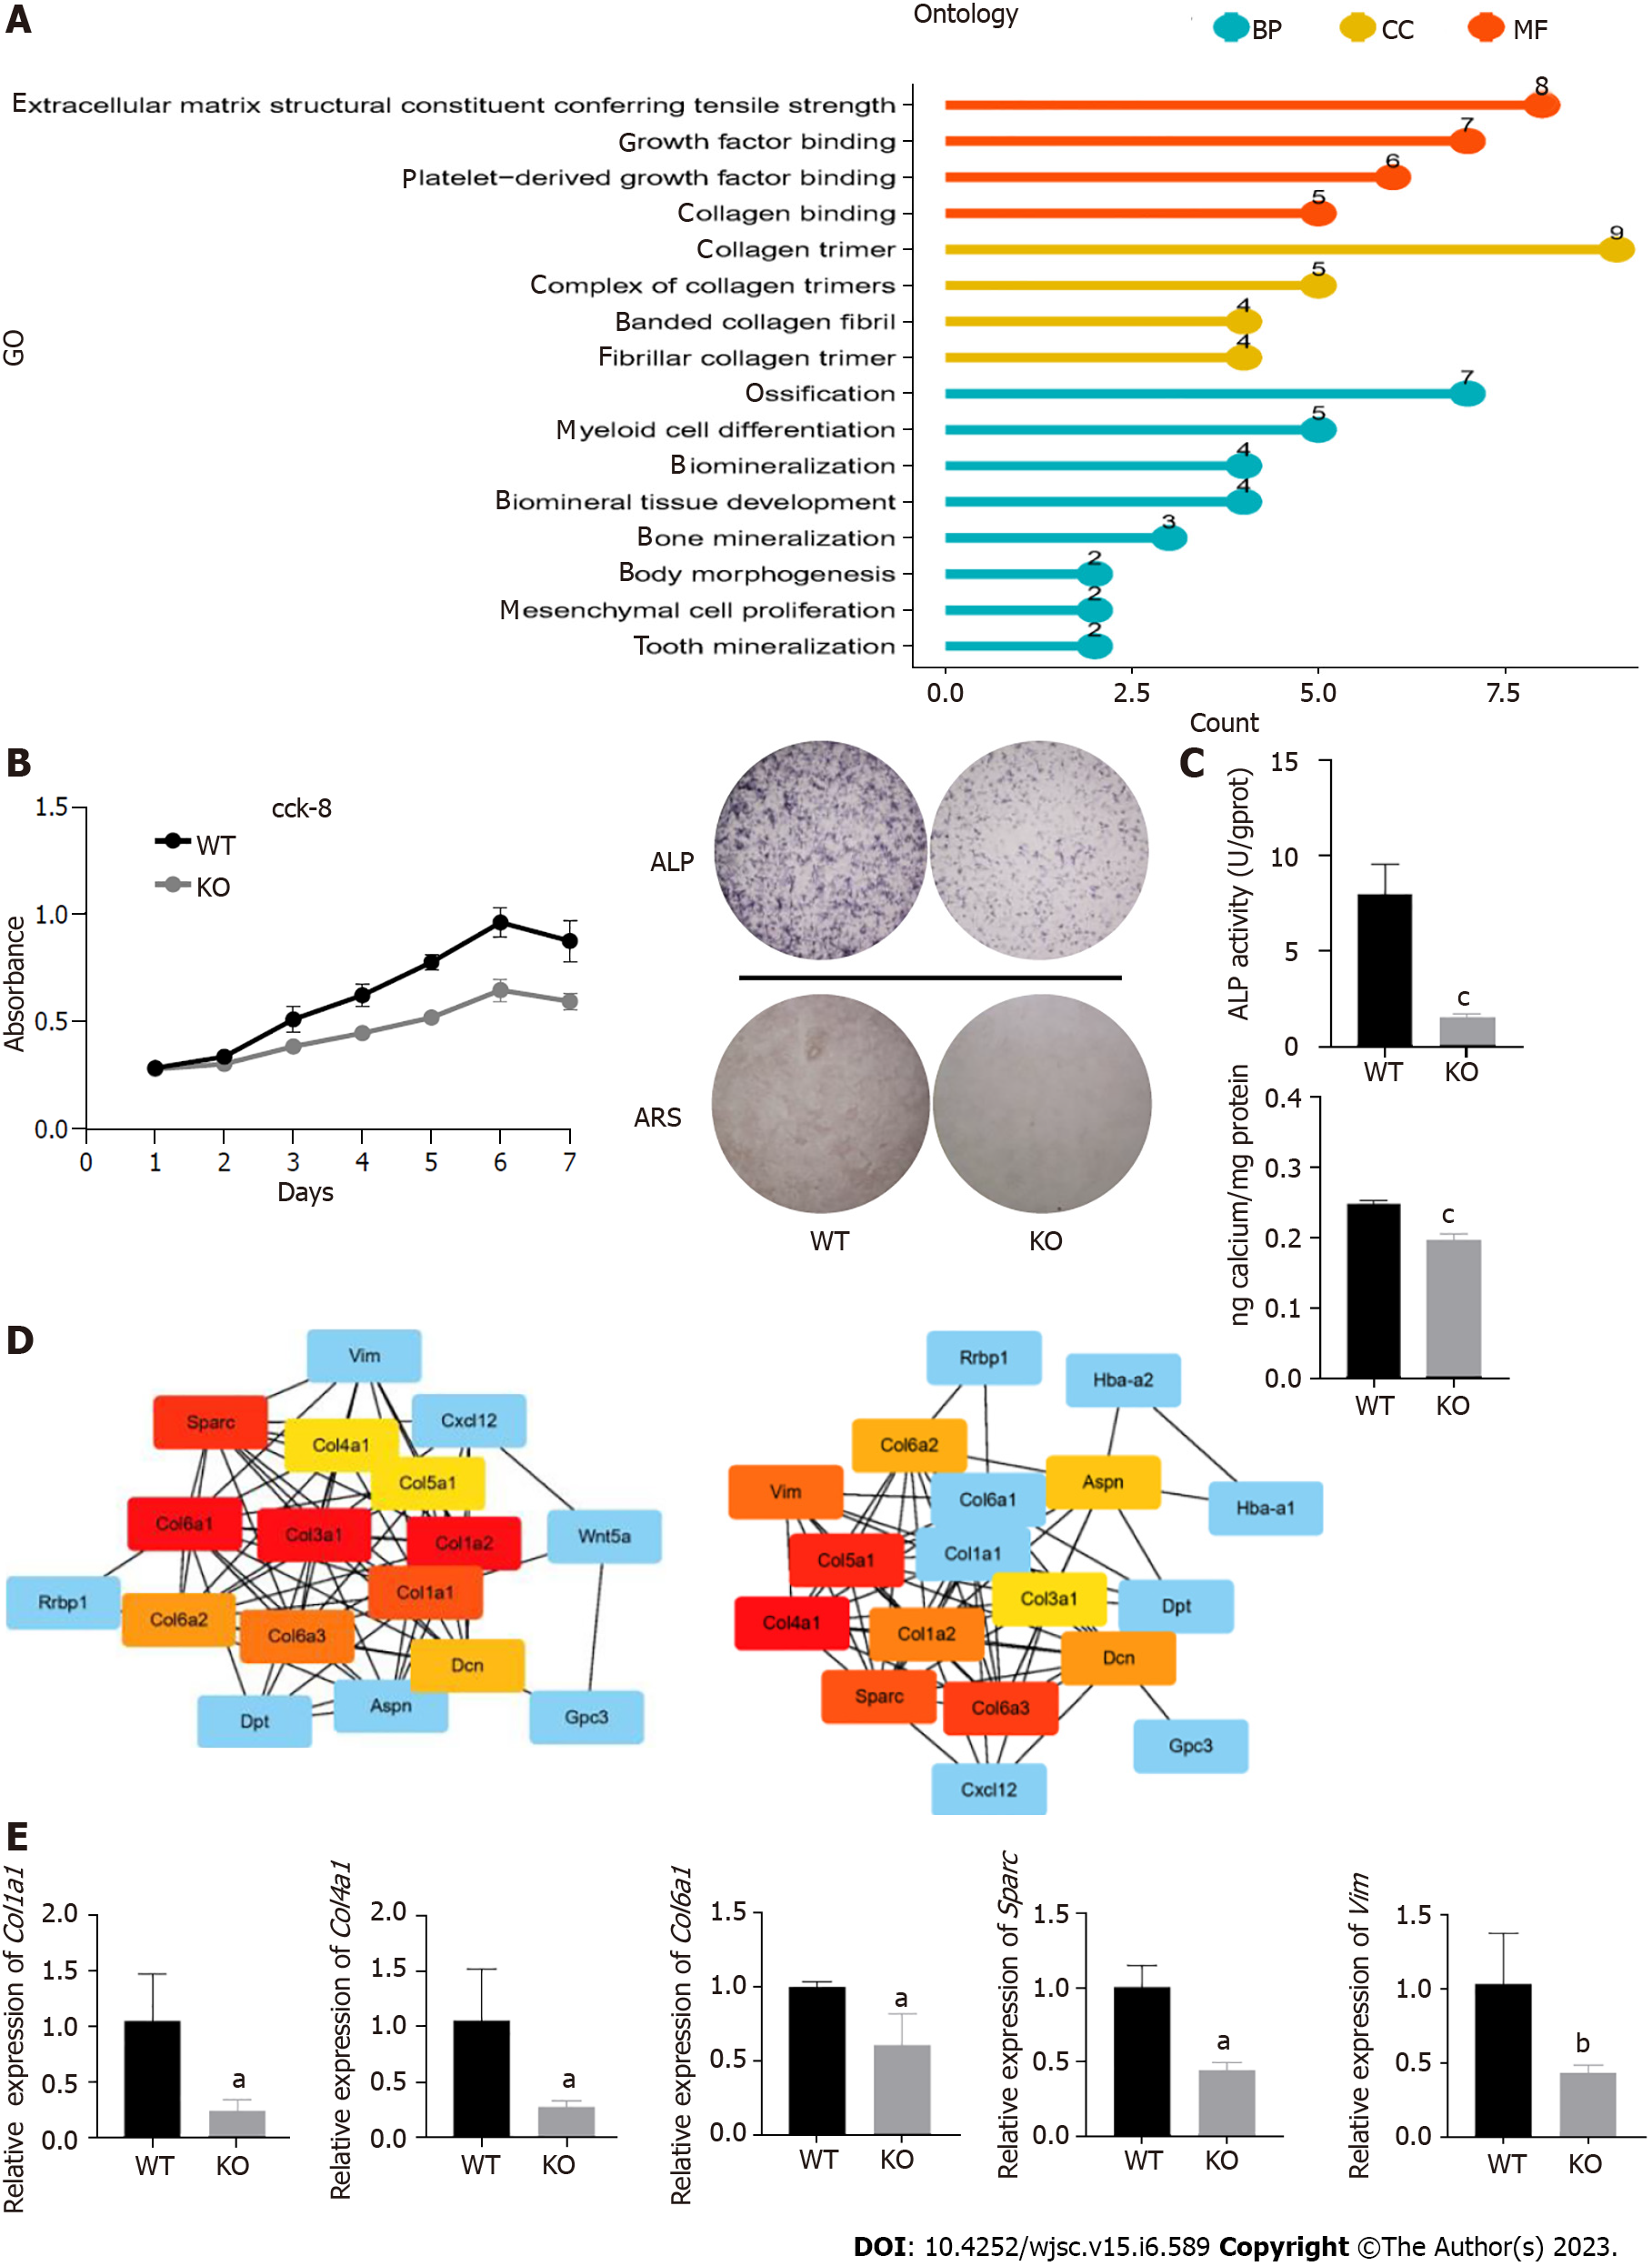
Figure 4 Cd271 knockout mesenchymal stem cells showed weaker proliferation and osteogenic differentiation potential.
A: Gene Ontology enrichment analysis of differentially expressed genes between Cd271 knockout and wild-type mesenchymal stem cells (MSCs); B: Growth curves of Cd271 knockout and wild-type MSCs; C: Mineralization assay of Cd271 knockout and wild-type MSCs. Alkaline phosphatase (ALP) and Alizarin red staining of Cd271 knockout MSCs was significantly lighter. ALP activity and calcium quantification were significantly lower in Cd271 knockout compared with wild-type MSCs; D: Protein–protein interaction network interaction analysis of wildtype vs Cd271 knockout differentially expressed genes; E: Quantitative real-time polymerase chain reaction assay of some differentially expressed genes in Cd271 knockout and wild-type MSCs. Data are presented as mean values ± SD (n = 3 biologically independent experiments. Two-sided unpaired t-test, aP < 0.05, bP < 0.01, cP < 0.001) BP: Biological Process; CC: Cell component; MF: Molecular function; ARS: Alizarin red S; ALP: Alkaline phosphatase; KO: Knockout; WT: Wild-type.
Figure 5 The potential developmental trajectories of mesenchymal stem cells by Monocle.
A: Pseudo-sequential diagram based on the differentiation process of mesenchymal stem cell (MSC) subpopulations; B: Pseudo-sequence plot of MSCs colored by cluster classification; C: Pseudo-sequential diagram of MSCs drawn with timeline coloring; D: Heatmap of differentially expressed genes in pseudotemporal analysis. The differentially expressed genes were divided into three gene clusters and gene ontology biological process enrichment analysis was performed.
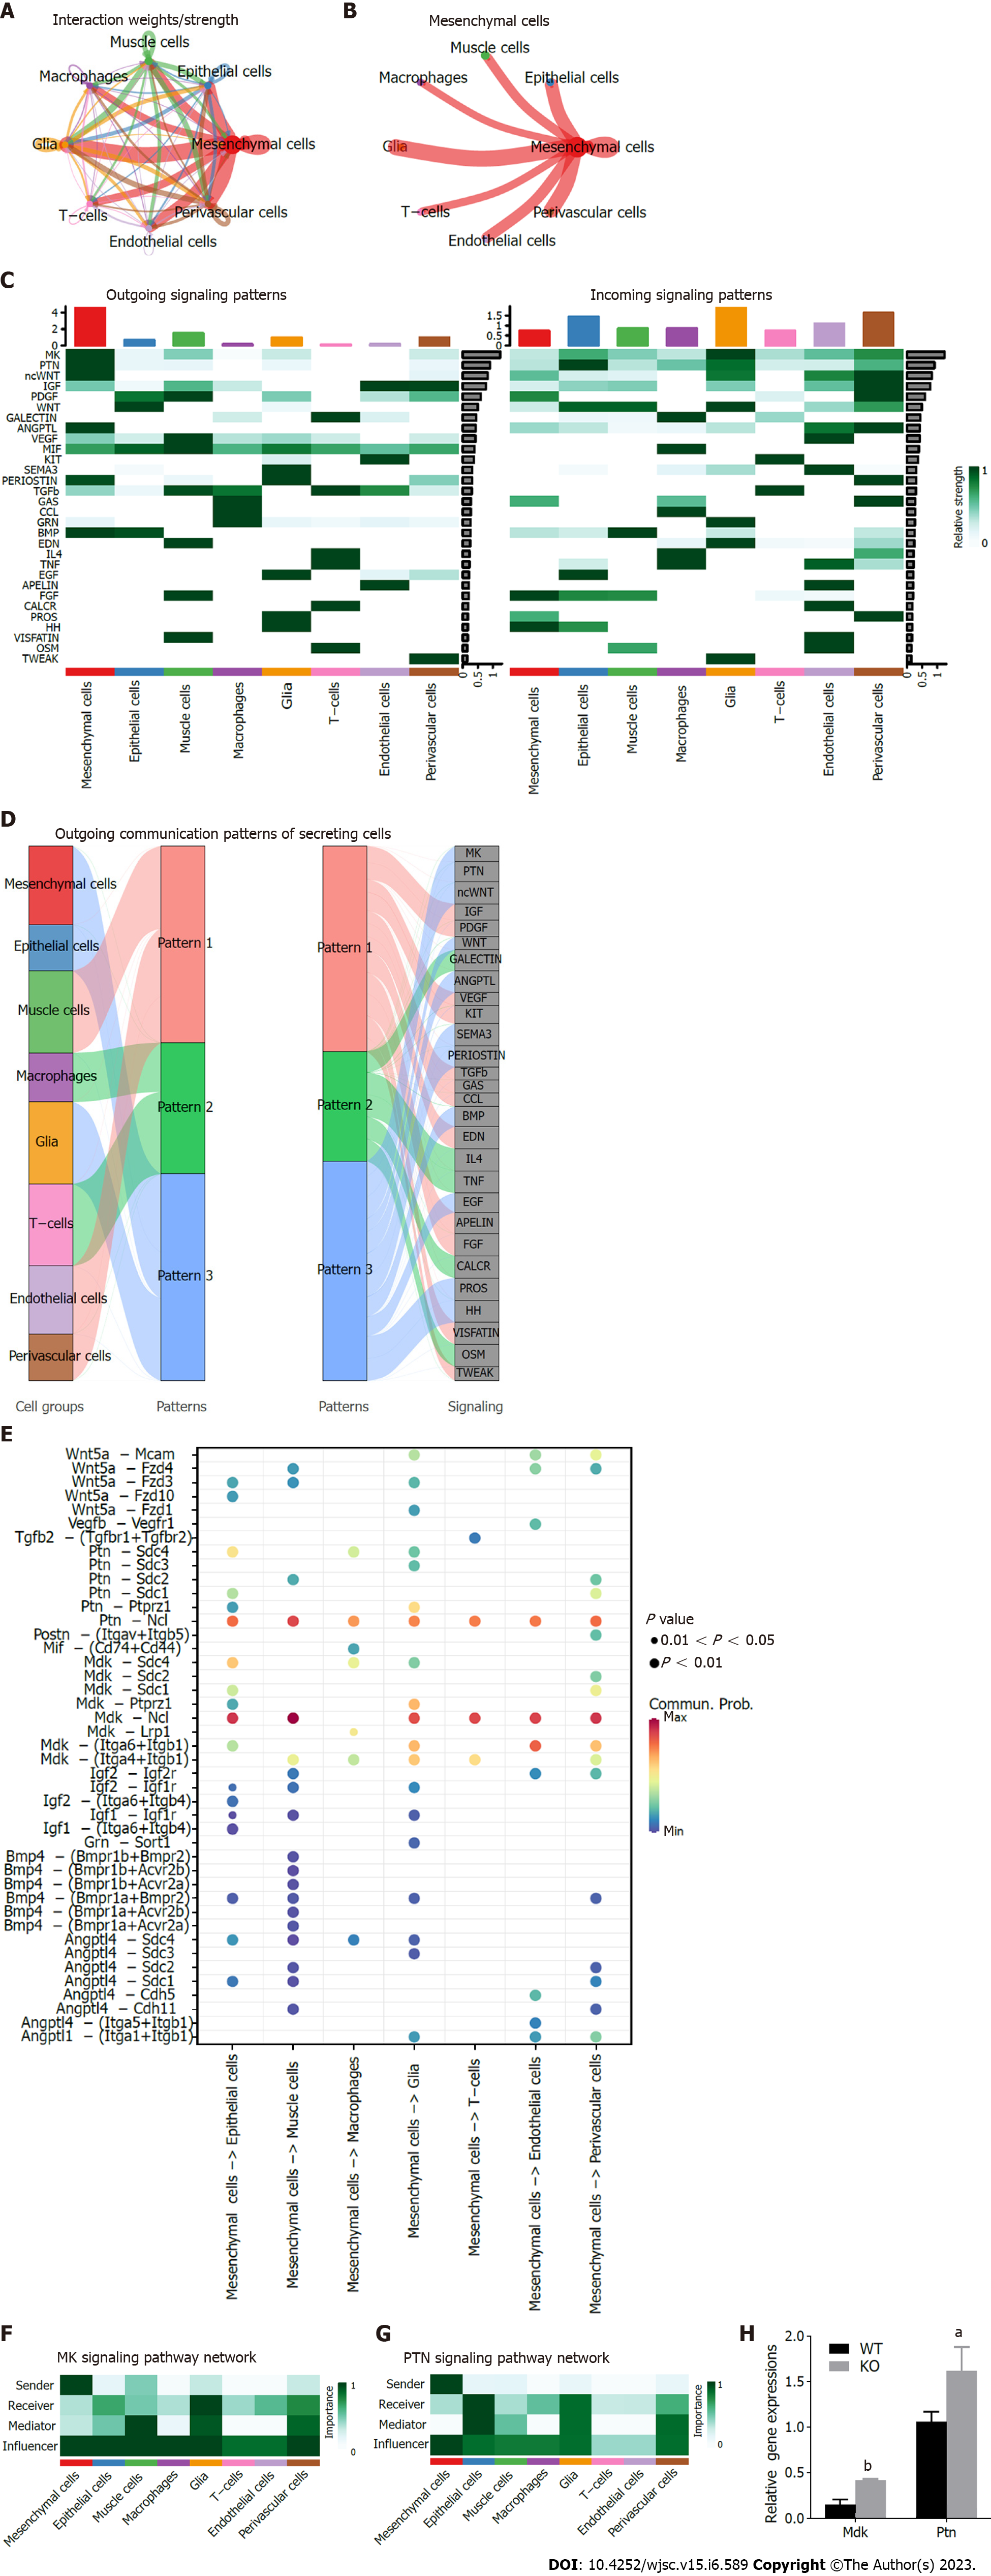
Figure 6 Inference, analysis and visualization of cellular communication networks from a single dataset via CellChat.
A: Interaction intensity plot between cells in single cell sequence profiling; B: Interaction intensity map between mesenchymal stem cells (MSCs) and other cell types; C: Contribution map of 30 signaling pathways detected by CellChat to intercellular efferent (or afferent) signaling; D: Alluvial plot of cell outgoing signaling patterns, showing the correspondence between cell populations and signaling pathways; E: Important ligand–receptor pairs for MSCs sending signals to other cell types. F and G: Contribution of efferent (or afferent) signals between cells, the MK signaling pathway (F) and PTN signaling pathway (G) were selected for visualization of network centrality scores; H: Expression of Mdk and Ptn in Cd271 knockout and wild-type MSCs was analyzed by quantitative real-time polymerase chain reaction. Data are presented as mean values ± SD (n = 3 biologically independent experiments. Two-sided unpaired t-test, aP < 0.05, bP < 0.01). KO: Knockout; WT: Wild-type.
- Citation: Zhang YY, Li F, Zeng XK, Zou YH, Zhu BB, Ye JJ, Zhang YX, Jin Q, Nie X. Single cell RNA sequencing reveals mesenchymal heterogeneity and critical functions of Cd271 in tooth development. World J Stem Cells 2023; 15(6): 589-606
- URL: https://www.wjgnet.com/1948-0210/full/v15/i6/589.htm
- DOI: https://dx.doi.org/10.4252/wjsc.v15.i6.589


