Copyright
©The Author(s) 2022.
World J Stem Cells. Mar 26, 2022; 14(3): 245-263
Published online Mar 26, 2022. doi: 10.4252/wjsc.v14.i3.245
Published online Mar 26, 2022. doi: 10.4252/wjsc.v14.i3.245
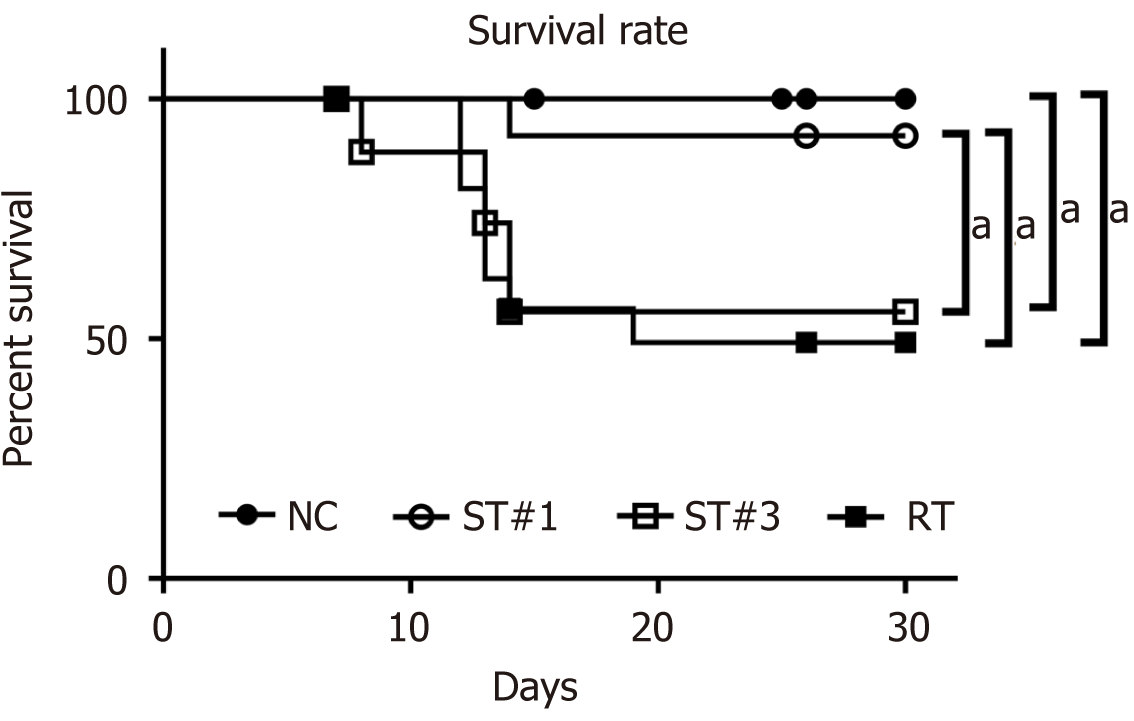
Figure 1 Survival curves of normal control, stem cell-treated, and irradiated mice.
Mice were irradiated with a single dose of 900 cGy. After irradiation, mouse adipose tissue-derived stem cells (mADSCs) were transplanted intraperitoneally once (#1) or three times (#3) on days 1, 5, and 12. The irradiated (RT) group was injected intraperitoneally with the same volume of saline. The survival rates are presented as Kaplan-Meier plots. The stem cell-treated (ST) group that received one transplant (ST#1) showed higher survival than the RT group. There was no difference in survival between the ST#3 and RT groups. aP < 0.05. NC: Normal control; ST: Stem cell-treated; RT: Irradiated.
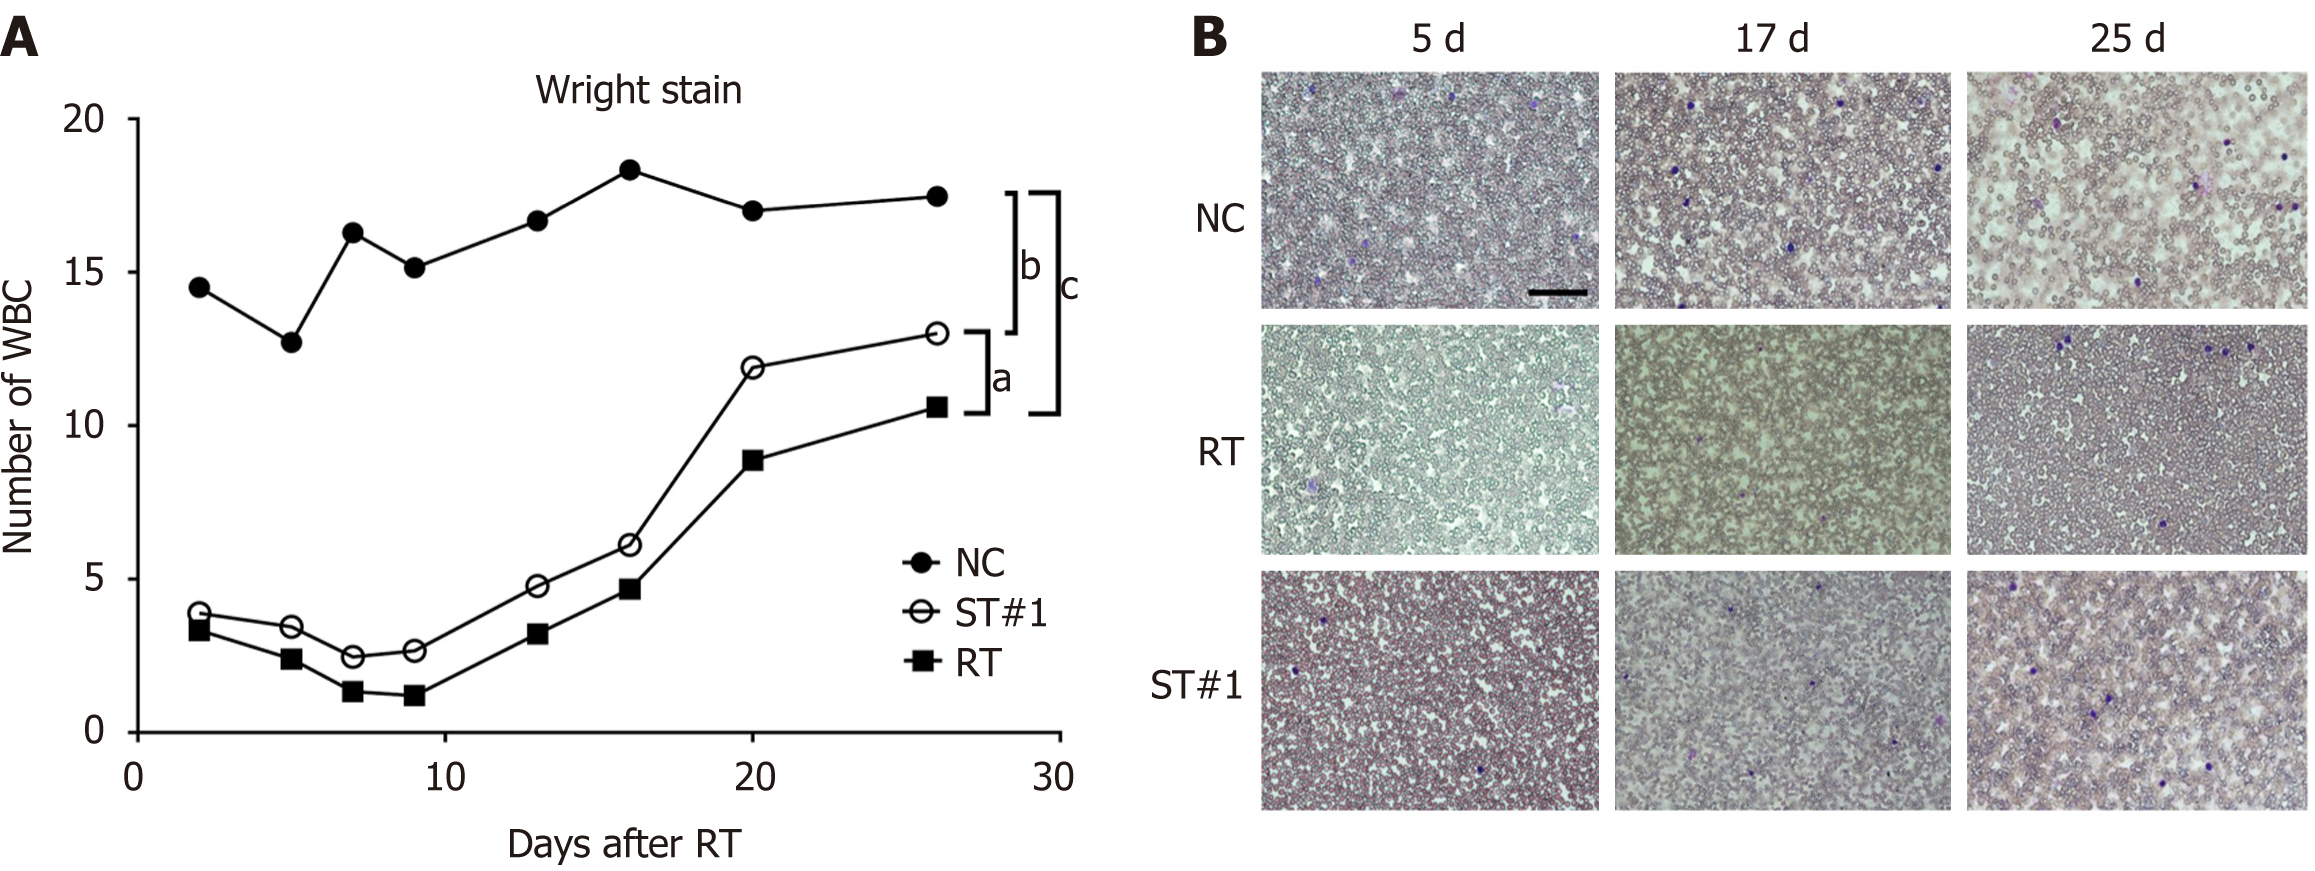
Figure 2 Evaluation of white blood cell count in peripheral blood using Wright staining.
A: The number of white blood cells were compared between the normal control NC, stem cell-treated, and irradiated groups; B: Representative images of the cells harvested on days 5, 17, and 25 after 9 Gy whole-body irradiation. Magnification 200 ×; scale bar: 20 μm; aP < 0.01, bP < 0.001, and cP < 0.0001 vs controls, as indicated. NC: Normal control; ST: Stem cell-treated; RT: Irradiated; WBC: White blood cell.
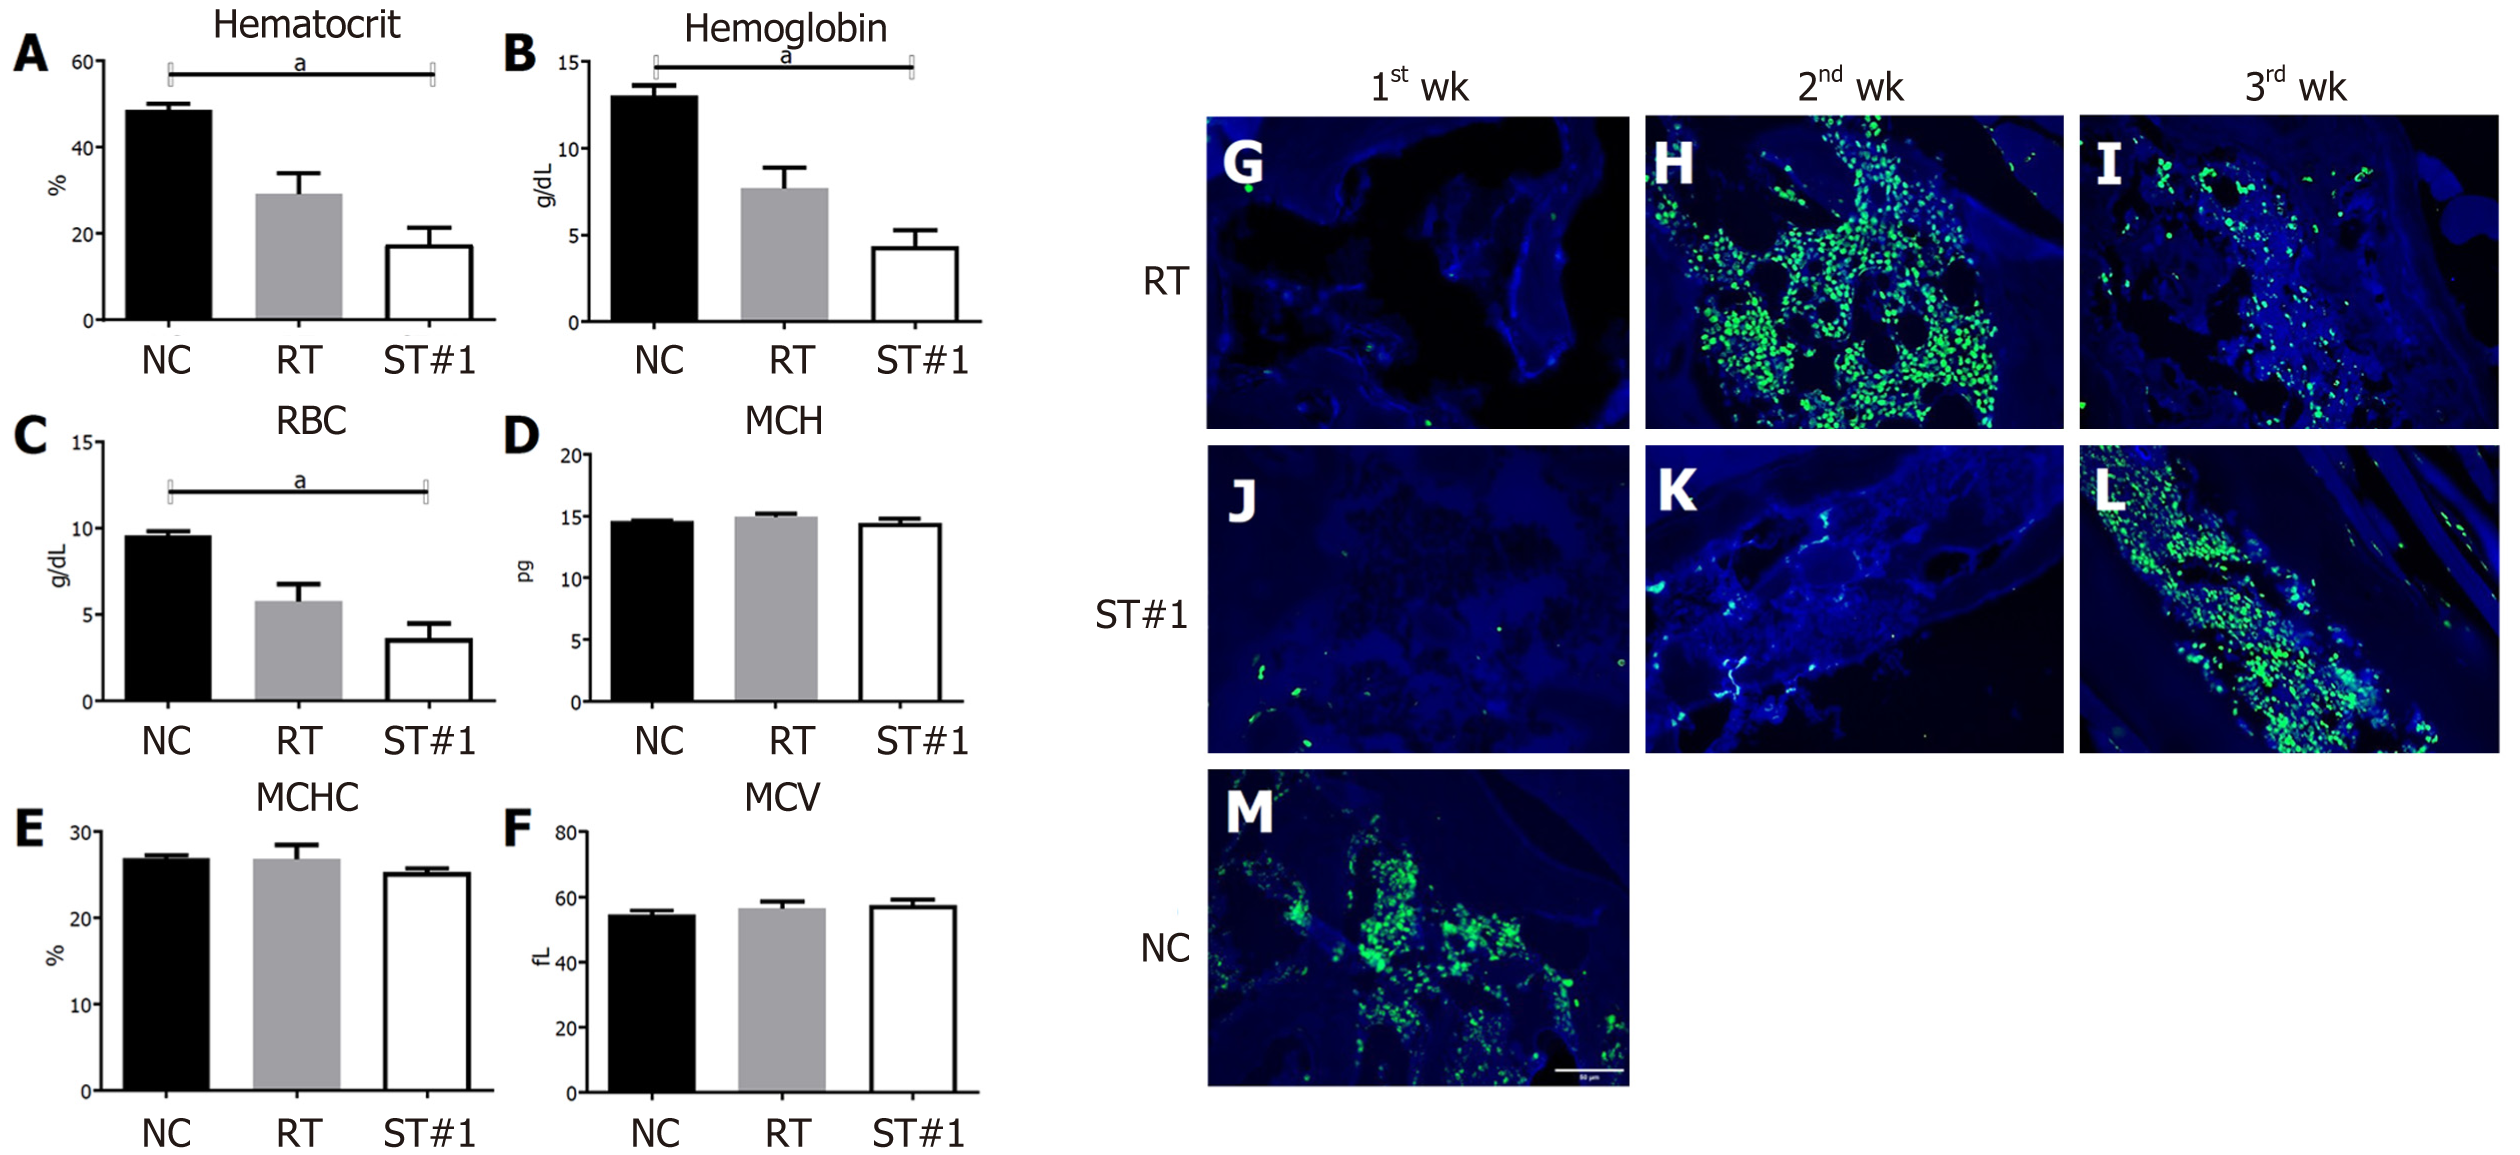
Figure 3 Characterization of red blood cell parameters in peripheral blood and CD34+ hematopoietic stem cells in the bone marrow.
A-C: Hematocrit level, hemoglobin level, and red blood cells count in the control, irradiated (RT), and stem cell-treated (ST)#1 groups at three weeks post-whole-body irradiation (WBI); D-F: Mean corpuscular hemoglobin, mean corpuscular hemoglobin concentration, and mean corpuscular volume for the control, RT, and ST#1 groups at three weeks post-WBI; G-M: Immunohistochemistry for CD34+ hematopoietic cells (green) in bone marrow; nuclei were counterstained with 4’,6-diamidino-2-phenylindole (blue). Magnification 400 ×; scale bar 50 μm; aP < 0.01 vs controls. RBC: Red blood cell; MCH: Mean corpuscular hemoglobin; MCHC: Mean corpuscular hemoglobin concentration; MCV: Mean corpuscular volume; NC: Normal control; ST: Stem cell-treated; RT: Irradiated.
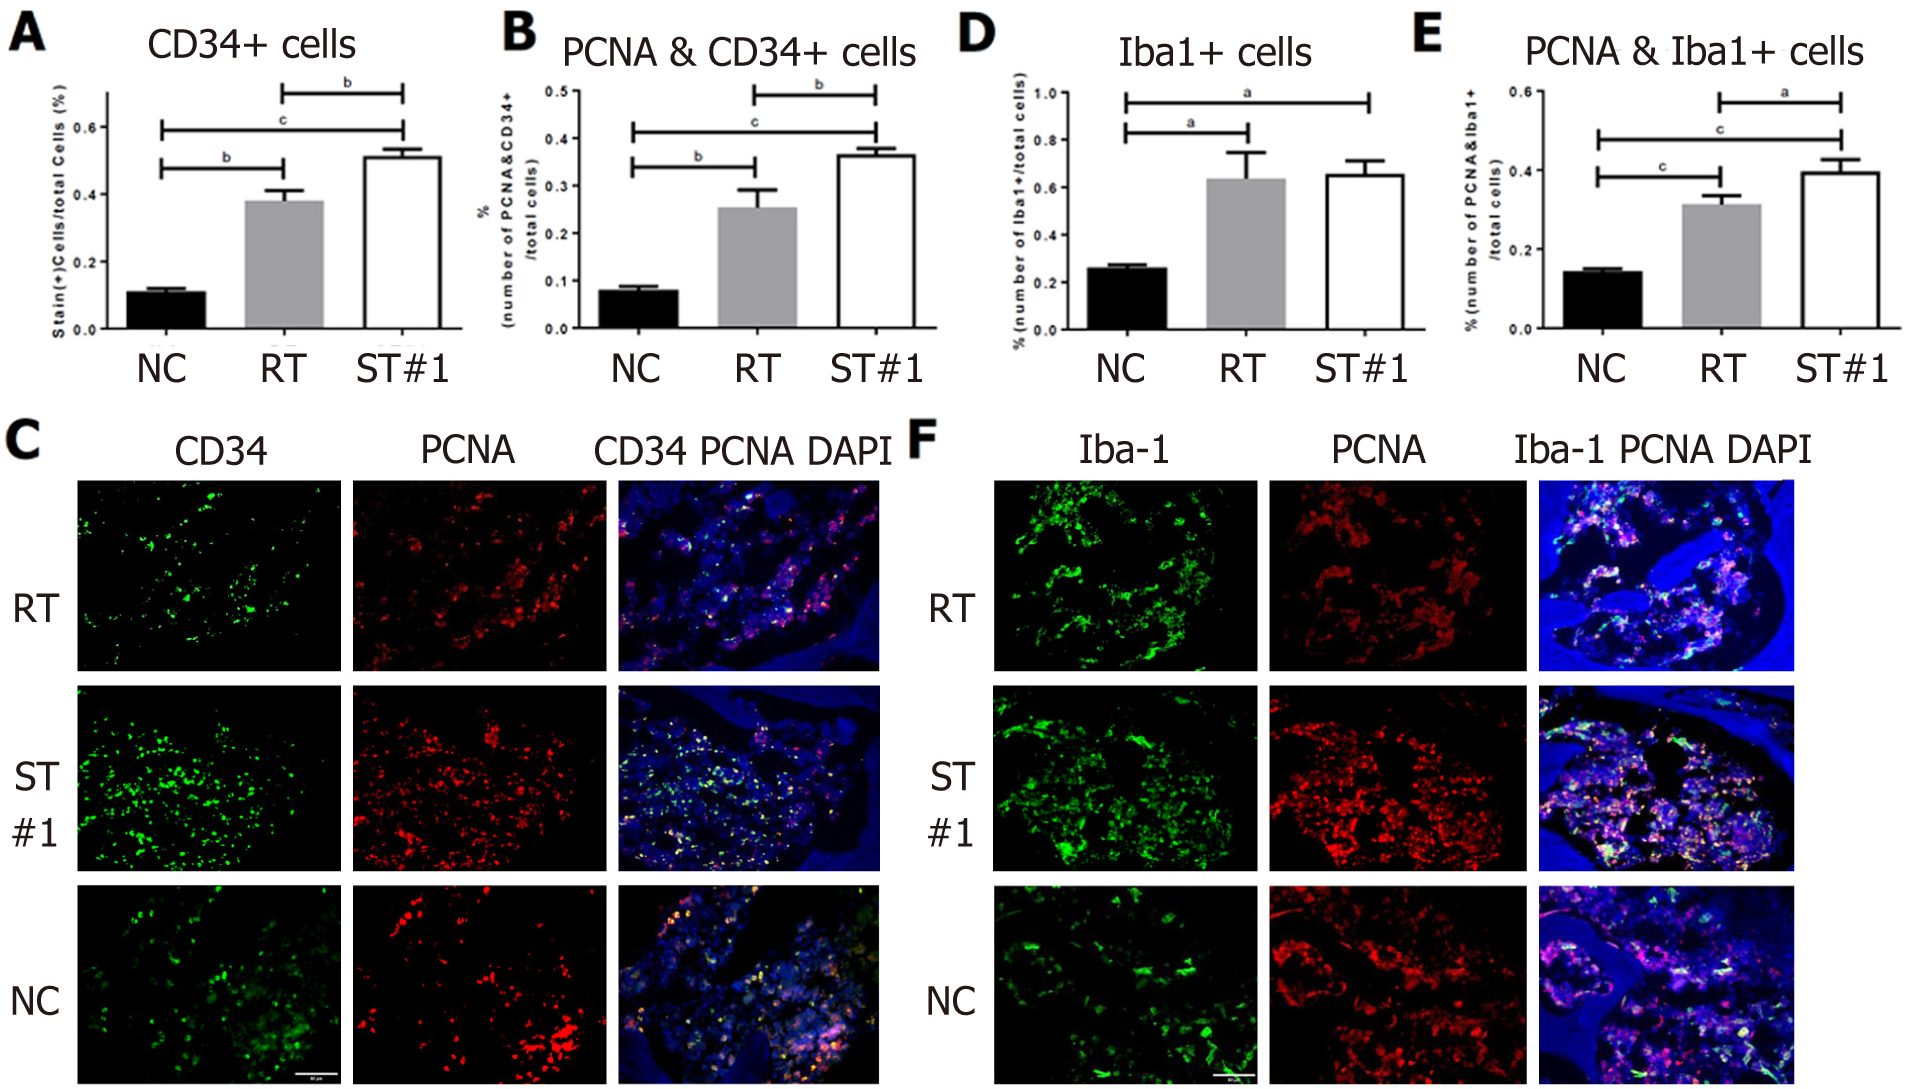
Figure 4 Immunohistochemical assessment of CD34, proliferating cell nuclear antigen, and ionized calcium-binding adaptor molecule-1 expression in bone marrow.
Three weeks following whole-body irradiation, mouse femurs were fixed, decalcified, and embedded in paraffin wax. The sections were deparaffinized, stained with antibodies, and imaged under 400 × magnification. A-C: The number of CD34+ cells in the stem cell-treated (ST)#1 group was higher than that in the irradiated (RT) group. The number of proliferating cell nuclear antigen (PCNA)+ cells in CD34+ hematopoietic stem cells was significantly higher in the ST#1 group than in the RT group; D-F: The number of ionized calcium-binding adaptor molecule-1 (Iba-1+) cells, a marker of monoblastic cells, was similar between the ST and RT groups; however, the number of cells expressing both PCNA and Iba-1 was significantly higher in the ST group. Magnification 400 ×; scale bar: 50 μm; aP < 0.001, bP < 0.001, and cP < 0.0001 vs controls. NC: Normal control; ST: Stem cell-treated; RT: Irradiated; CD: Cluster of differentiation; PCNA: Proliferating cell nuclear antigen; Iba-1: Ionized calcium-binding adaptor molecule-1; DAPI: 4′,6-diamidino-2-phenylindole.
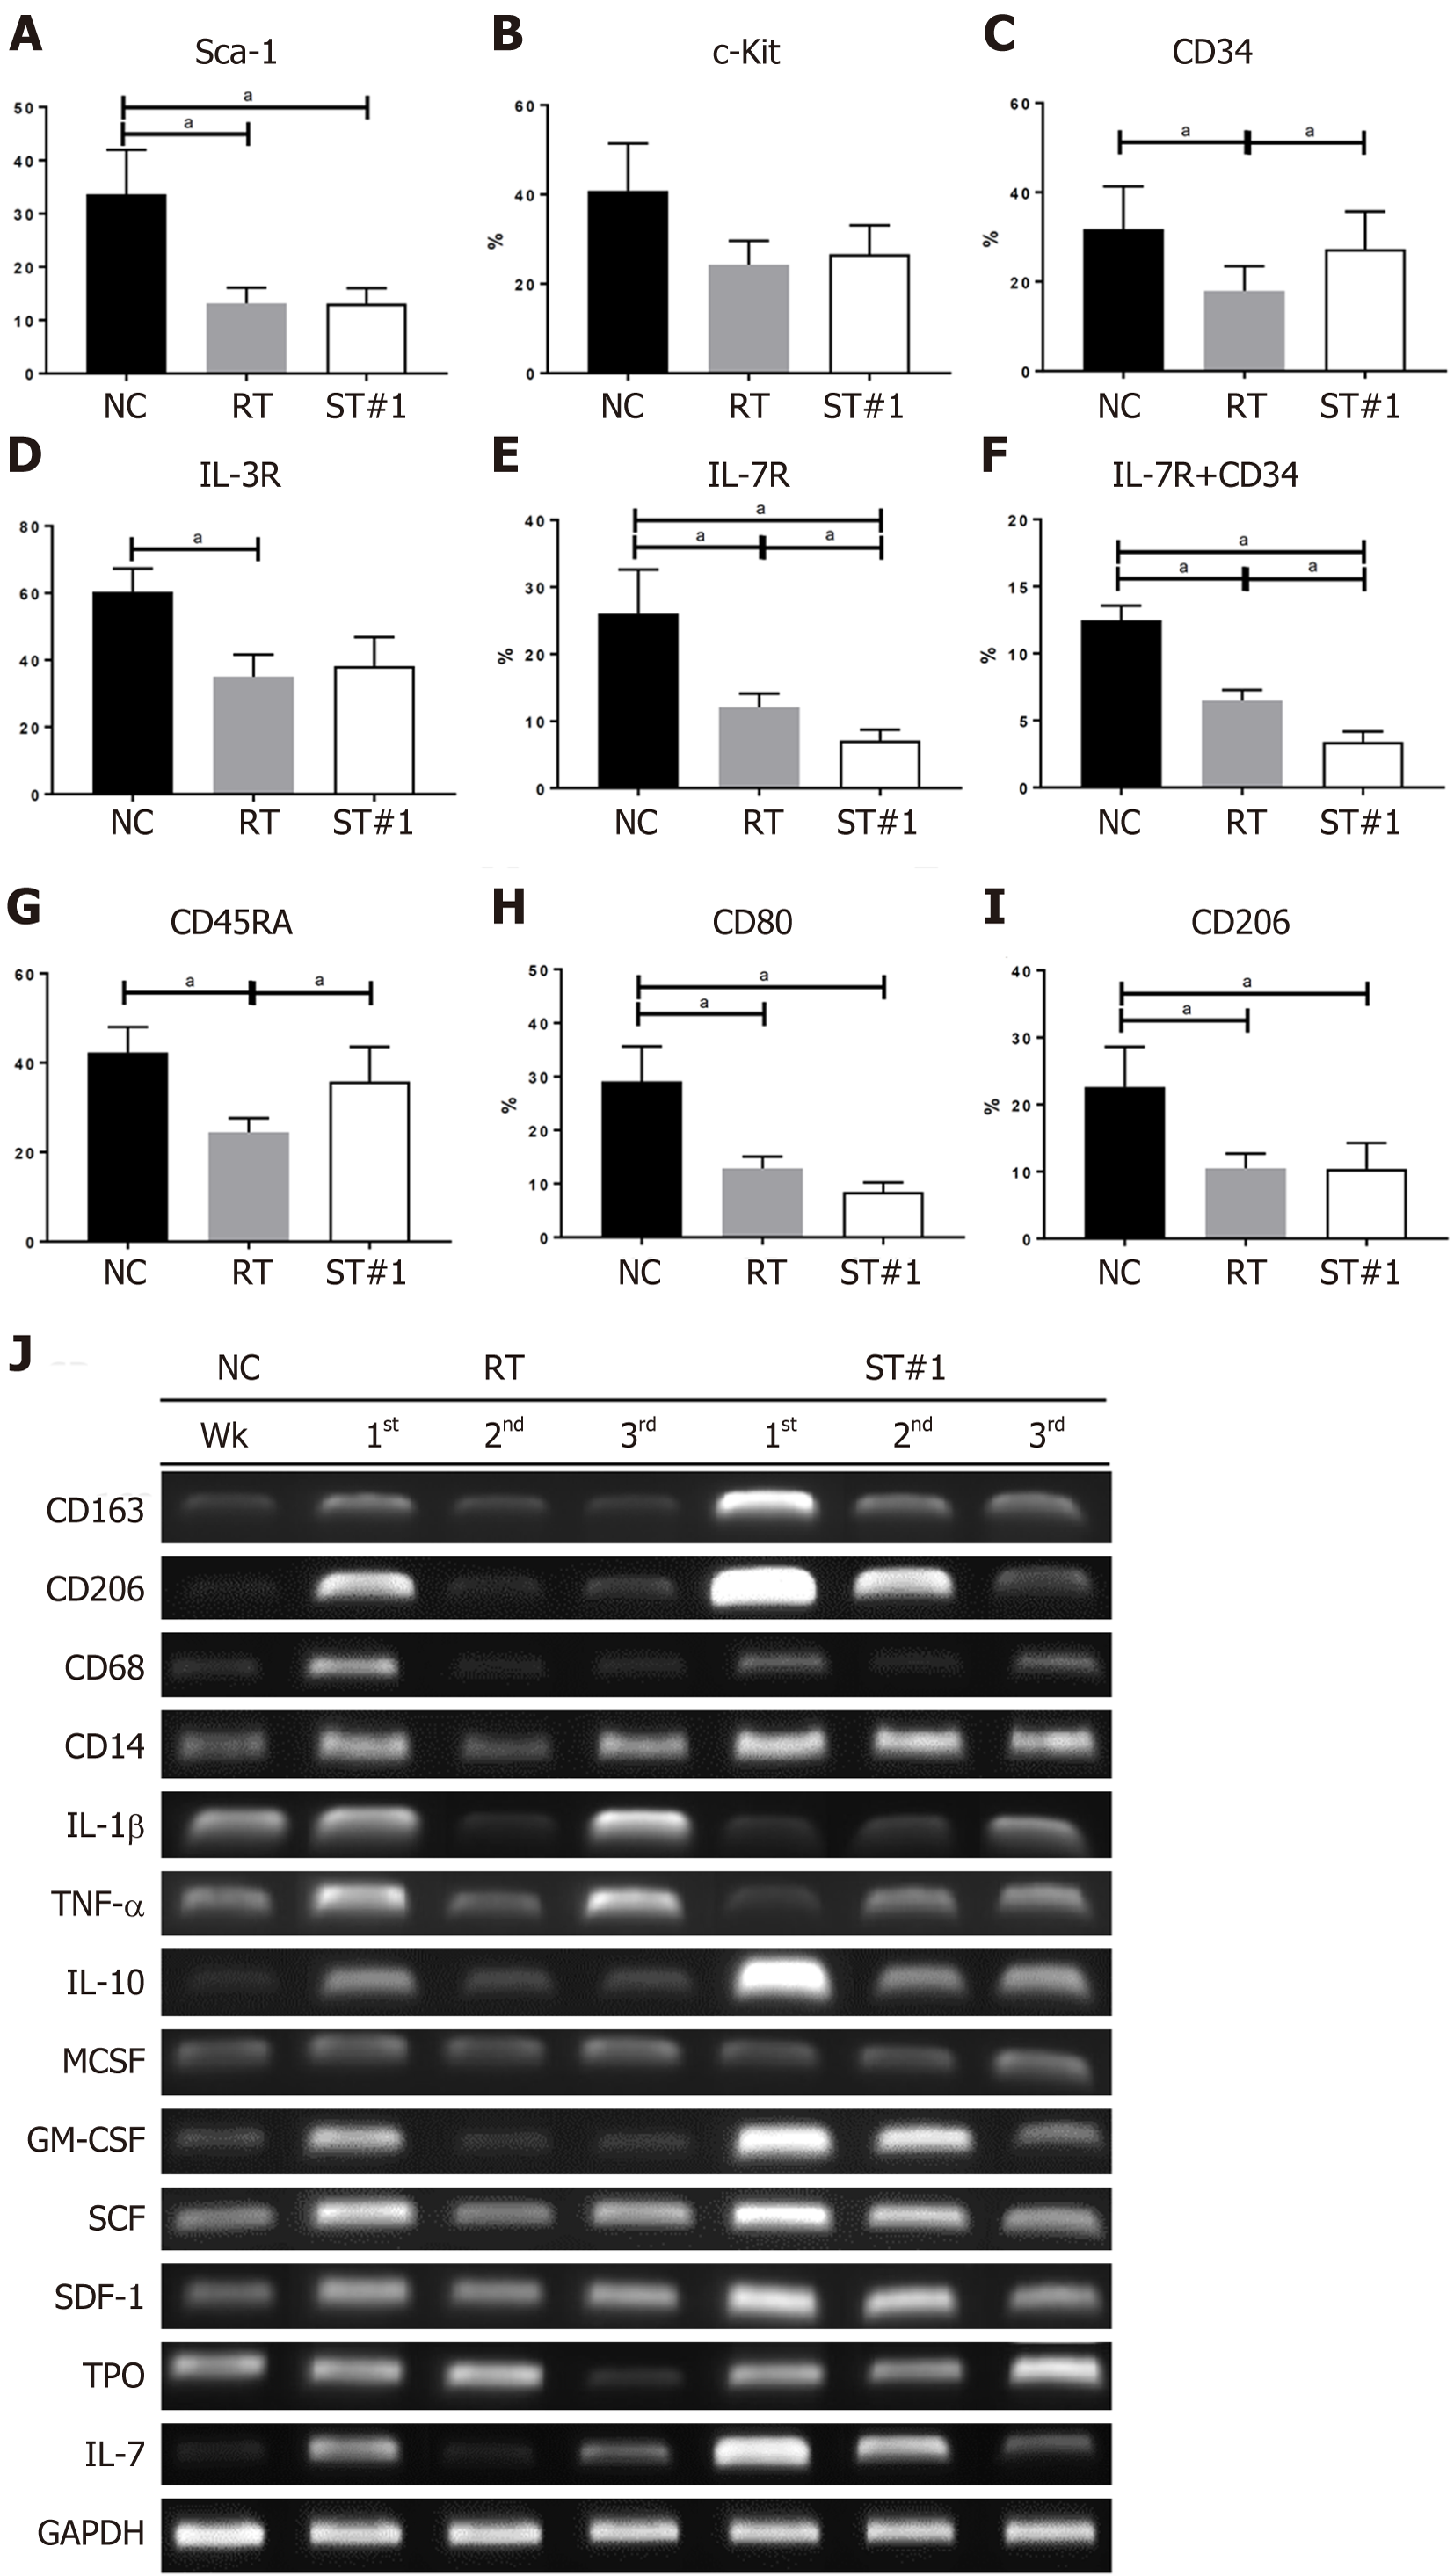
Figure 5 Characterization of repopulated bone marrow post-whole-body irradiation in the normal control, irradiated, and stem cell-treated groups.
A-I: The expression levels of Sca-1, c-Kit, CD34, interleukin (IL)-3R, IL-7R, CD45RA, CD80, and CD206 in the bone marrow (BM) at 3 wk after post-whole-body irradiation (WBI) was examined using flow cytometry; J: mRNA expression in the BM at weeks 1, 2, and 3 post-WBI was evaluated using reverse transcription PCR. aP < 0.05 vs controls, as indicated. NC: Normal control; ST: Stem cell-treated; RT: Irradiated; Sca-1: Stem cells antigen-1; c-KIT: Tyrosine-protein kinase KIT; CD: Cluster of differentiation; IL: Interleukin; TNF-α: Tumor necrotic factor-a; M-CSF: Macrophage colony-stimulating factor; GM-CSF: Granulocyte-macrophage colony-stimulating factor; SCF: Stem cell factor; SDF-1: Stromal cell-derived factor 1; TPO: Thrombopoietic growth factor; GAPDH: Glyceraldehyde 3-phosphate dehydrogenase.
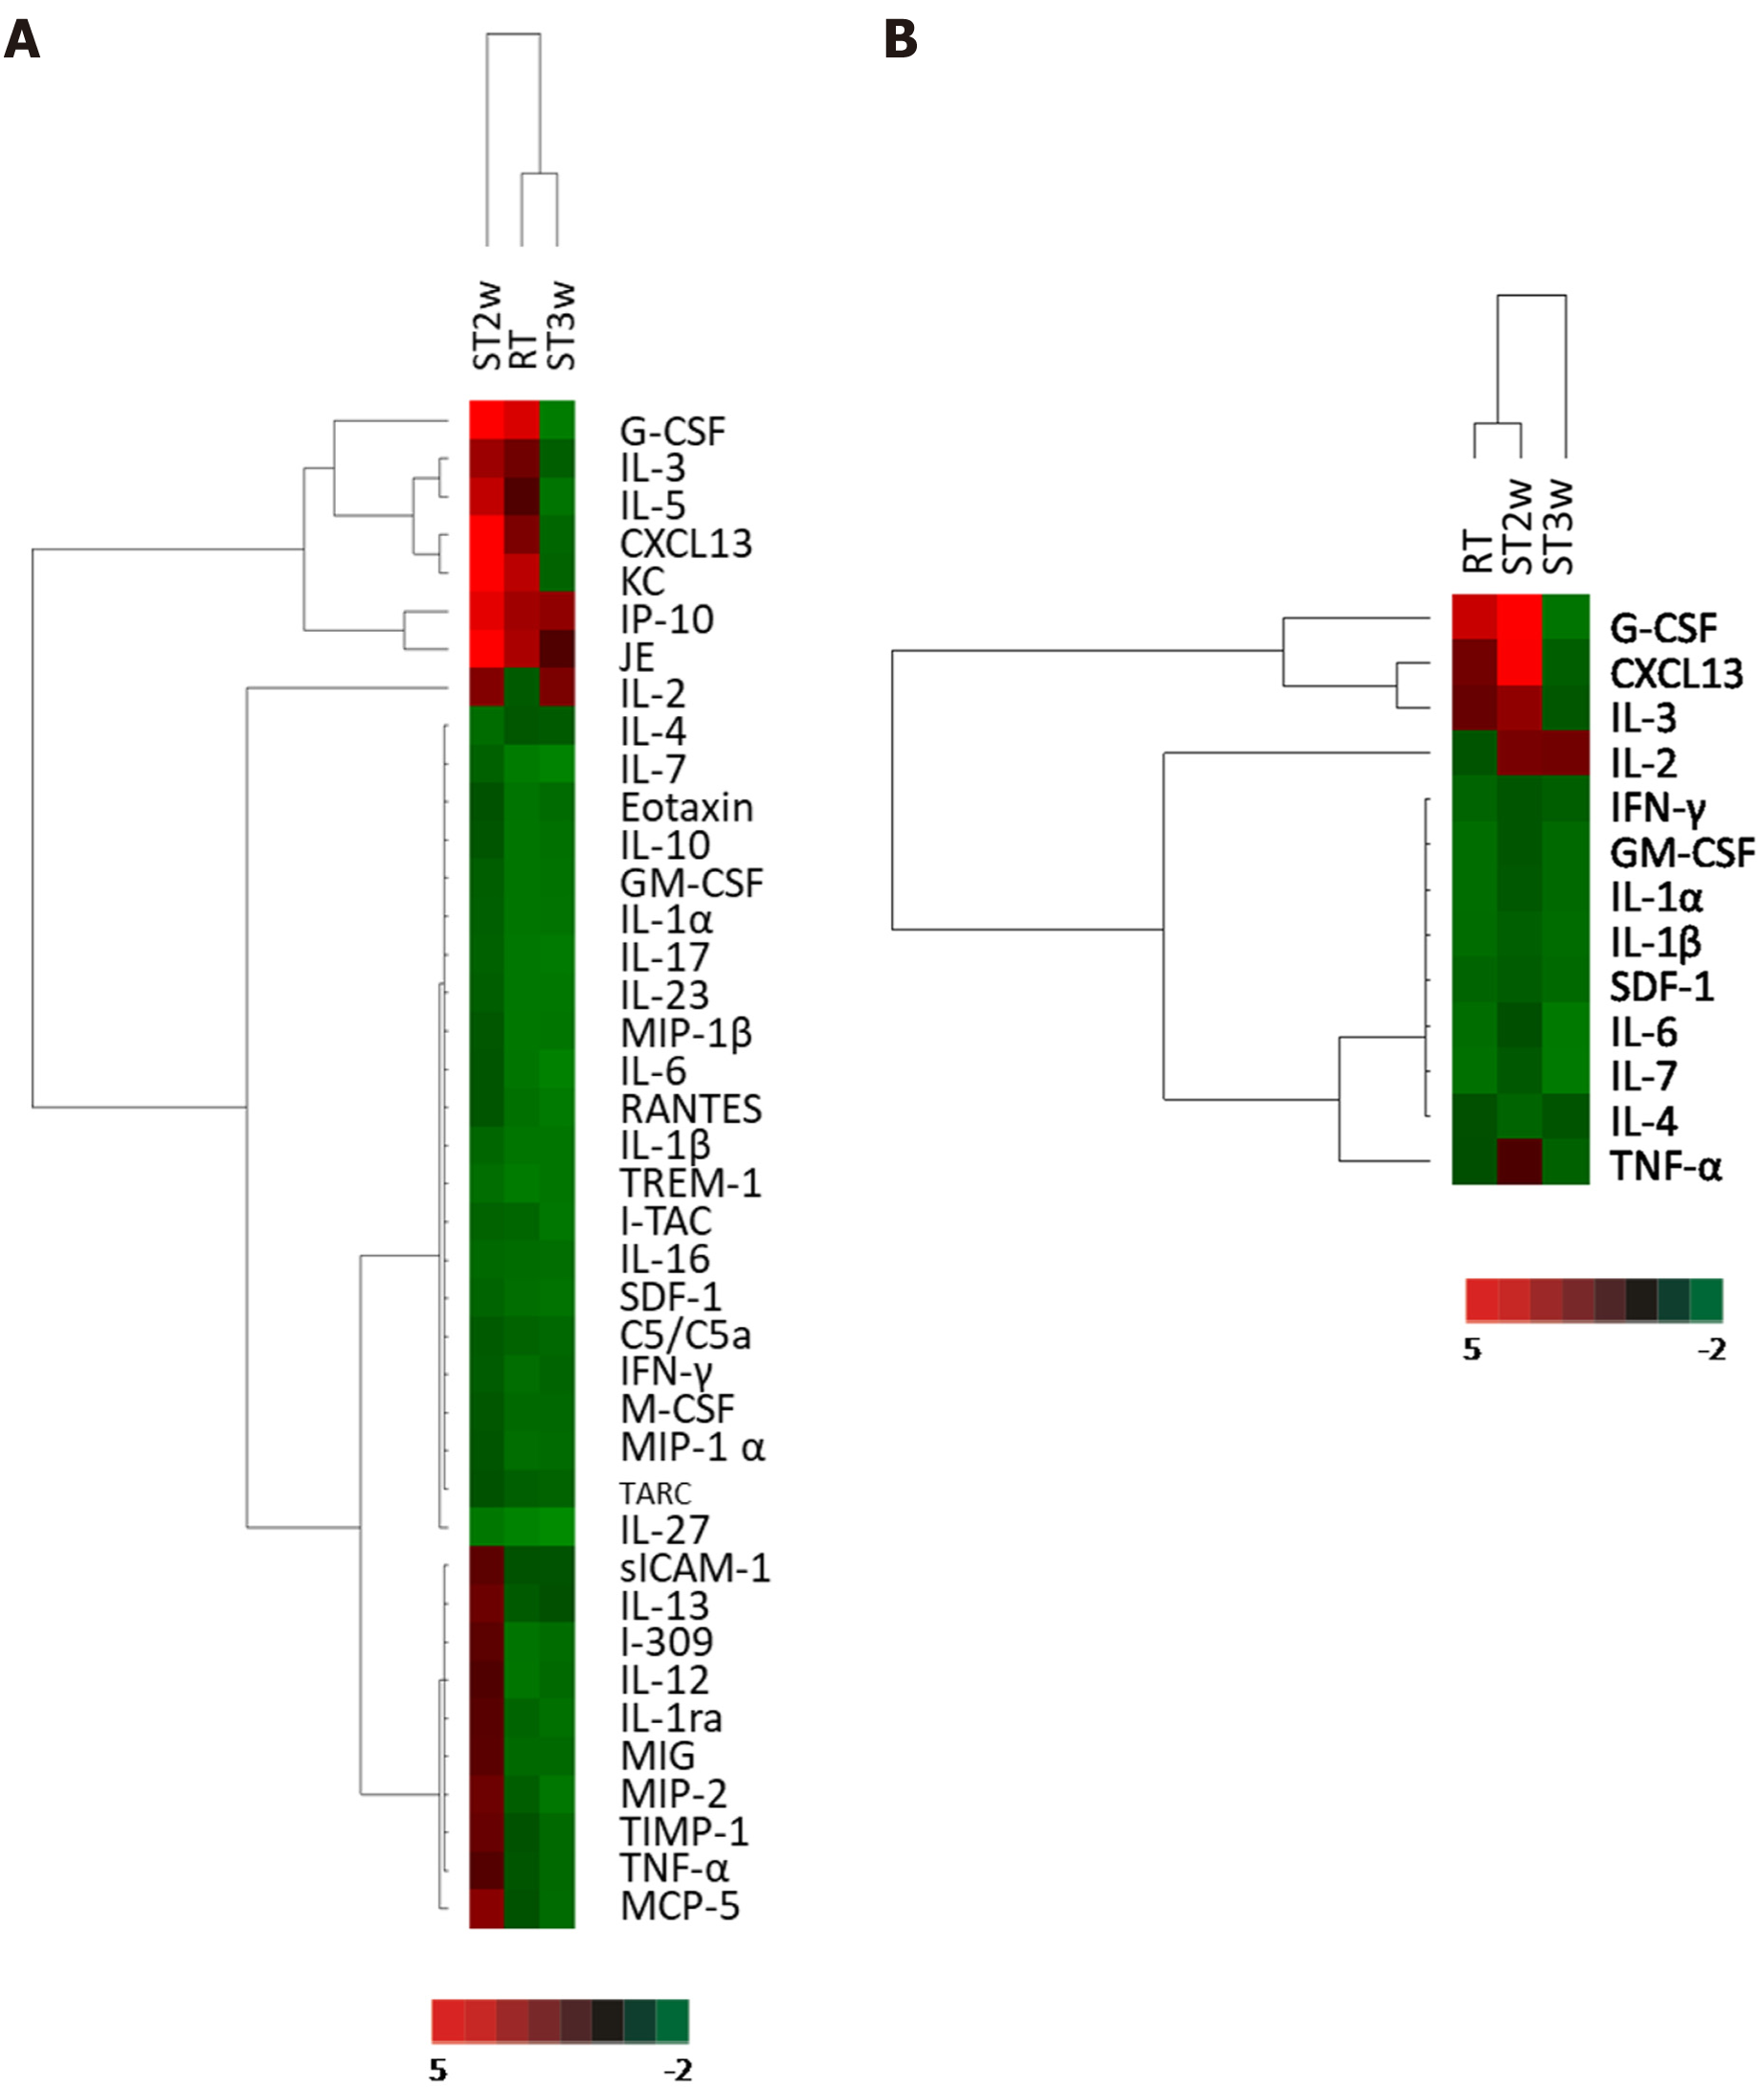
Figure 6 Clustering analysis of cytokine array from plasma samples.
A: Thirty-nine proteins in the plasma were investigated in normal control (NC) and irradiated (RT) groups at week 2 and the stem cell-treated (ST) group at weeks 2 and 3 (ST2w and ST3w, respectively). Proteins in the plasma of RT and ST groups were normalized to the NC group before comparison; B: The proteins with 1.5-fold higher expression in the three groups than in the NC group were selected and compared. NC: Normal control; ST: Stem cell-treated; RT: Irradiated; IL: Interleukin; TNF-α: Tumor necrotic factor-α; GM-CSF: Granulocyte-macrophage colony-stimulating factor; SDF-1: Stromal cell-derived factor 1; IFN: Interferon.
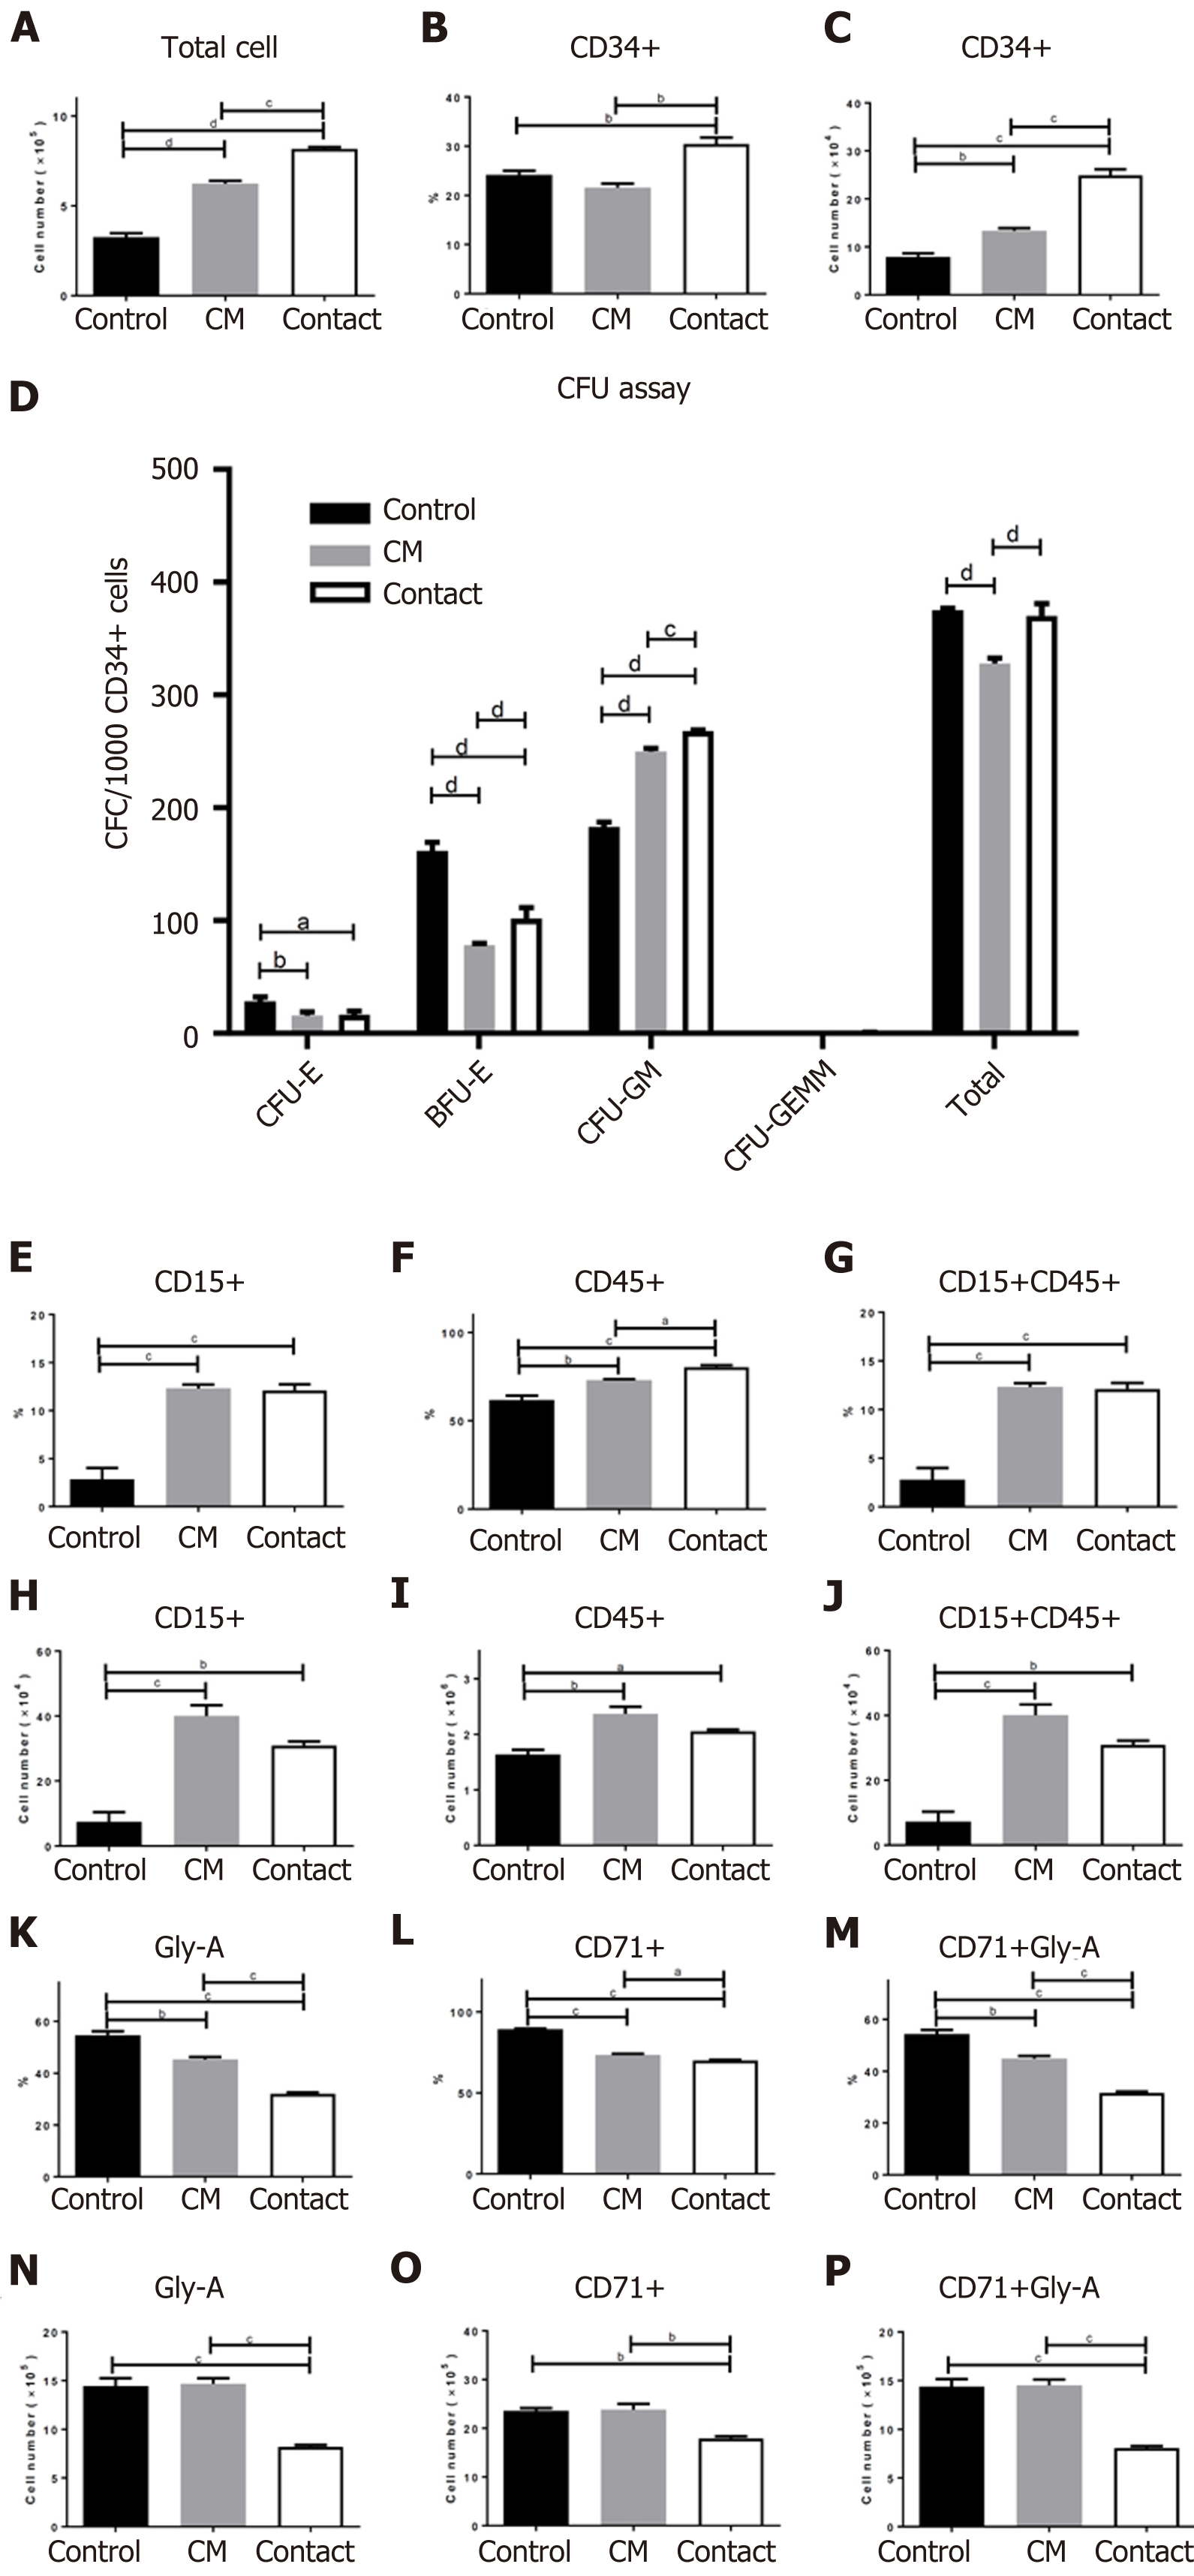
Figure 7 Effect of co-culture on CD34+ cell fate.
CD34+ cells were incubated in the absence (control group) or presence of human adipose tissue-derived stem cells (hADSCs) conditioned medium (CM group) or directly on a hADSC layer (contact group). A: Total cell number; B: Percentage of CD34+ cells; C: The number of CD34+ cells were determined after 7 d of incubation; D: Colony-forming unit assays were performed using MethoCult™ by plating an equal number of CD34+ cells. The number of colonies was counted after 14 d of incubation; E-P: Differentiation assays of bone marrow CD34+ cells in liquid cultures, in the absence (control group) or presence of hADSC CM group or directly on a hADSC layer (contact group). The percentage of each surface marker was analyzed using flow cytometry (upper panel) and the marker-positive cell numbers were calculated (lower panel). aP < 0.05, bP < 0.01, cP < 0.001, and dP < 0.0001 vs controls. CFU: Colony-forming unit; CM: Conditioned media; CFU-E: Colony-forming unit erythroid; BFU-E: Burst-forming unit erythroid.
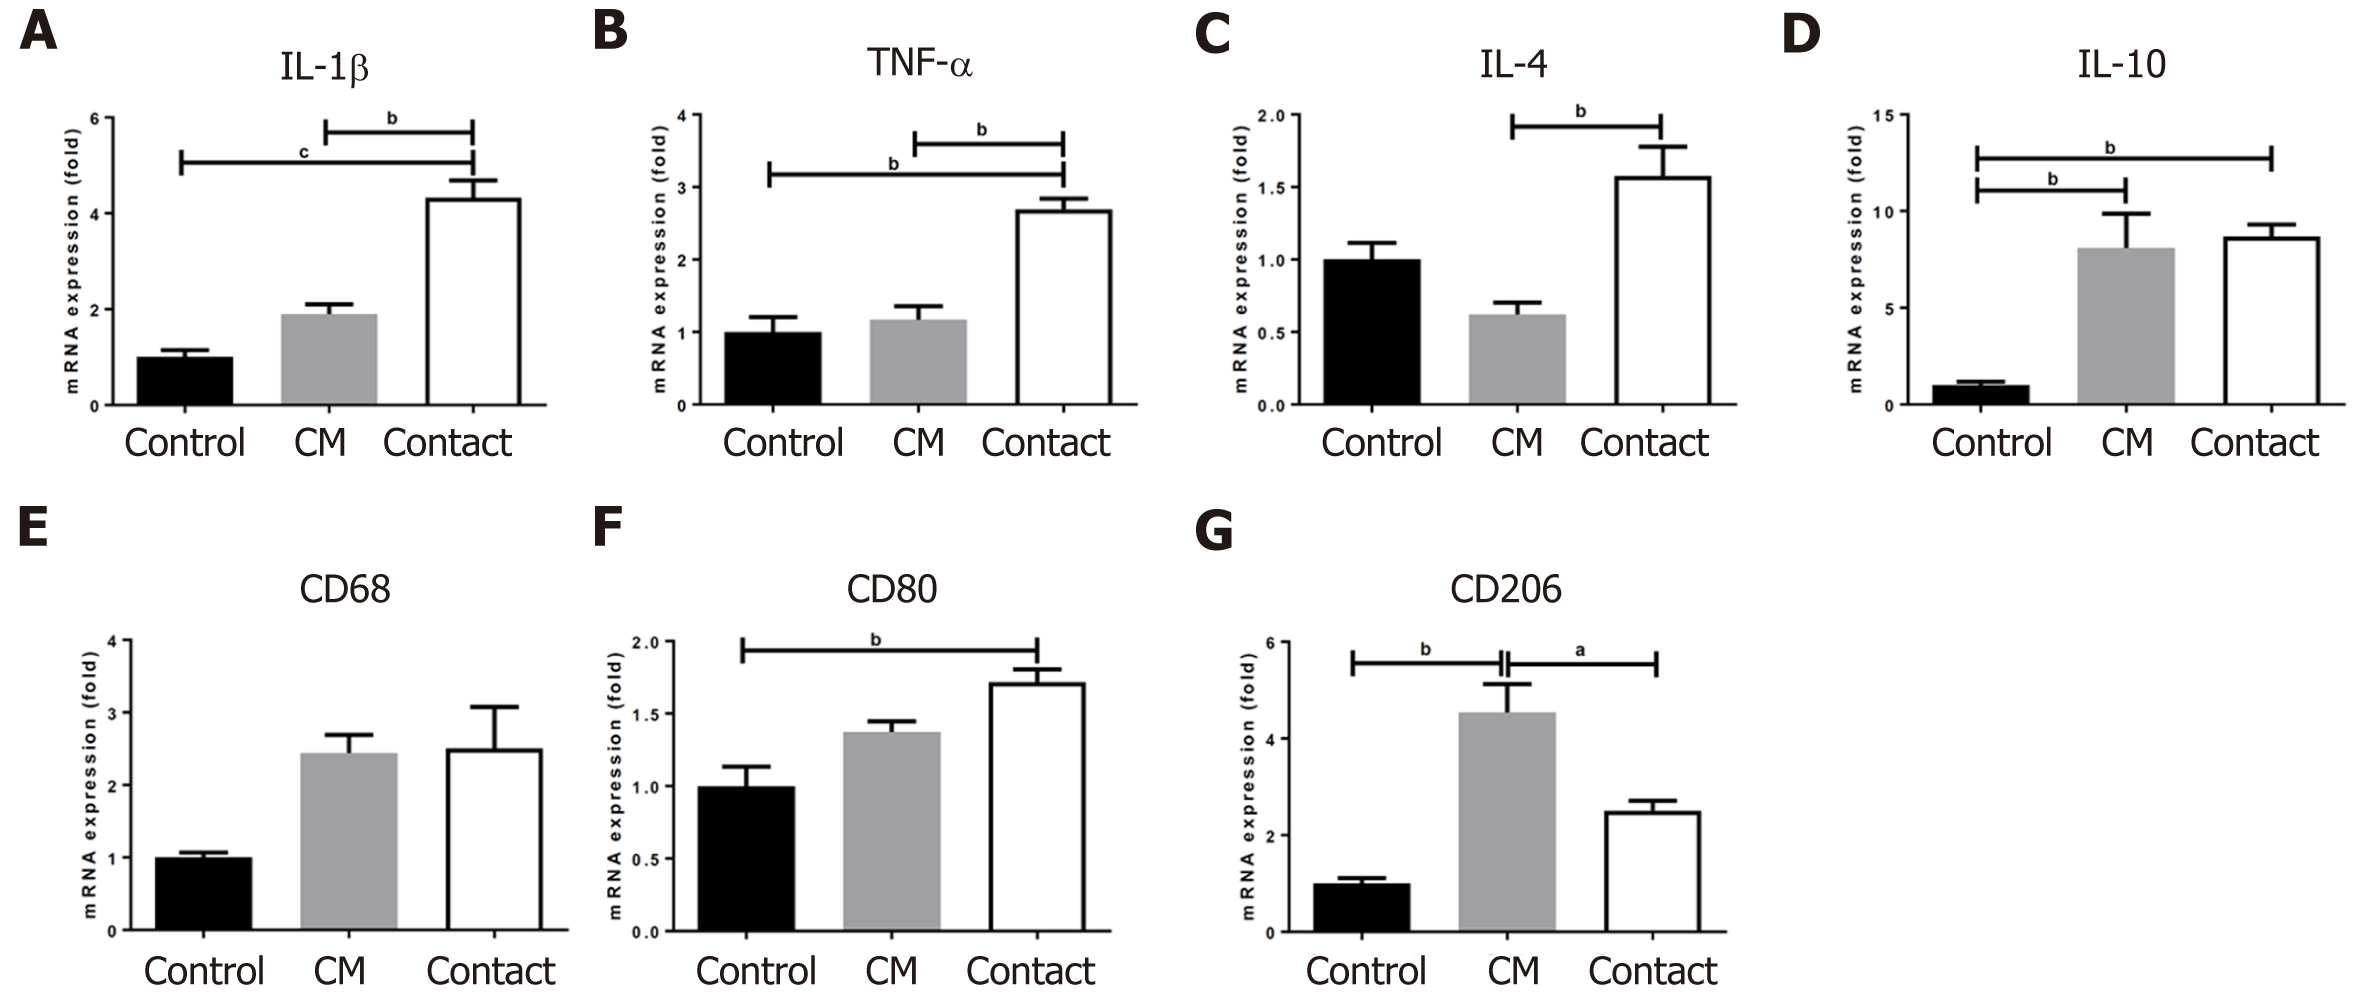
Figure 8 Gene expression analysis of bone marrow CD34+ cells cultured in the absence (control) or presence of human adipose tissue-derived stem cell conditioned medium or directly on a human adipose tissue-derived stem cell layer (contact).
Relative expression levels of the indicated genes were determined using qRT-PCR. aP < 0.05, bP < 0.01, and cP < 0.001 vs controls. CM: Conditioned media; IL: Interleukin; TNF-α: Tumor necrotic factor-α.
- Citation: Kim MJ, Moon W, Heo J, Lim S, Lee SH, Jeong JY, Lee SJ. Optimization of adipose tissue-derived mesenchymal stromal cells transplantation for bone marrow repopulation following irradiation. World J Stem Cells 2022; 14(3): 245-263
- URL: https://www.wjgnet.com/1948-0210/full/v14/i3/245.htm
- DOI: https://dx.doi.org/10.4252/wjsc.v14.i3.245


