©The Author(s) 2019.
World J Stem Cells. Mar 26, 2019; 11(3): 180-195
Published online Mar 26, 2019. doi: 10.4252/wjsc.v11.i3.180
Published online Mar 26, 2019. doi: 10.4252/wjsc.v11.i3.180
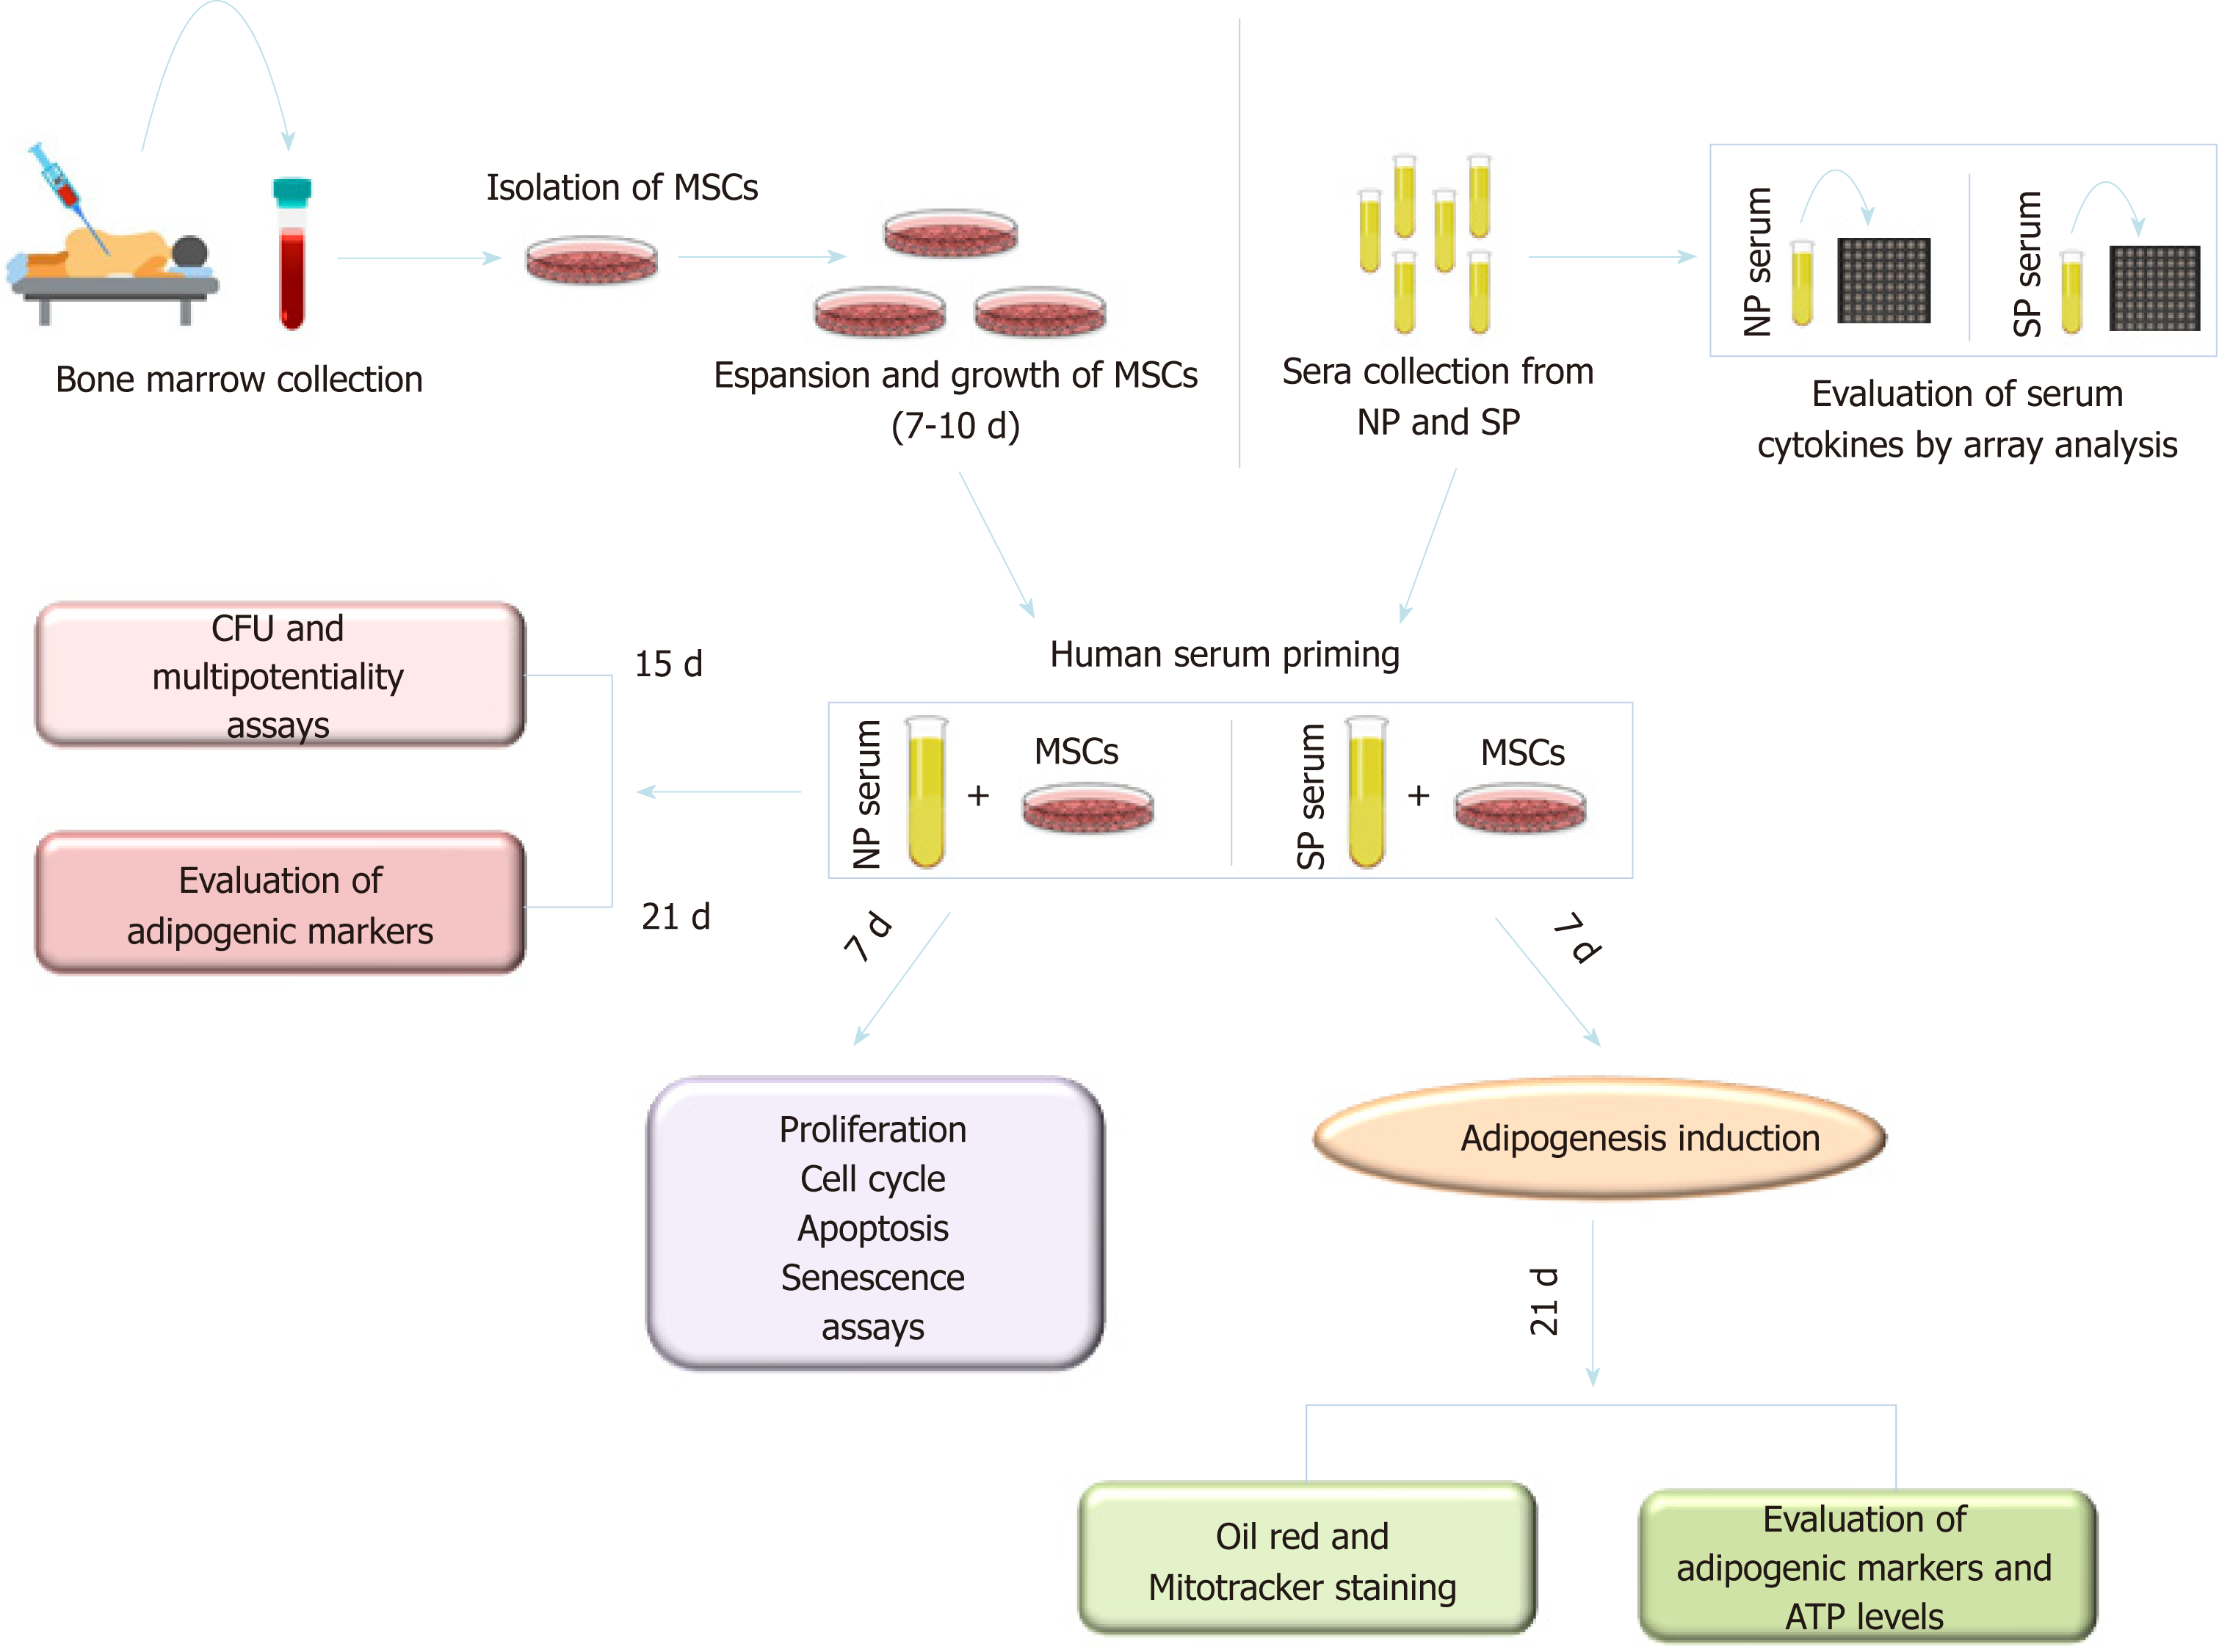
Figure 1 Experimental plan.
Mesenchymal stromal cells (MSCs) were isolated from bone marrow of healthy donors and were expanded in vitro for 7–10 d. Cultures were then incubated for 7 d (priming) with sera obtained from normal or skinny people [normal people (NP) or skinny people (SP)]. Cyotokine content of NP and SP sera was evalauted by array analysis. Following priming, several biological and biochemical assay assays were carried out on MSC cultures as depicted. MSCs: Mesenchymal stromal cells; NP: Normal people; SP: Skinny people; CFU: Colony Forming Units.
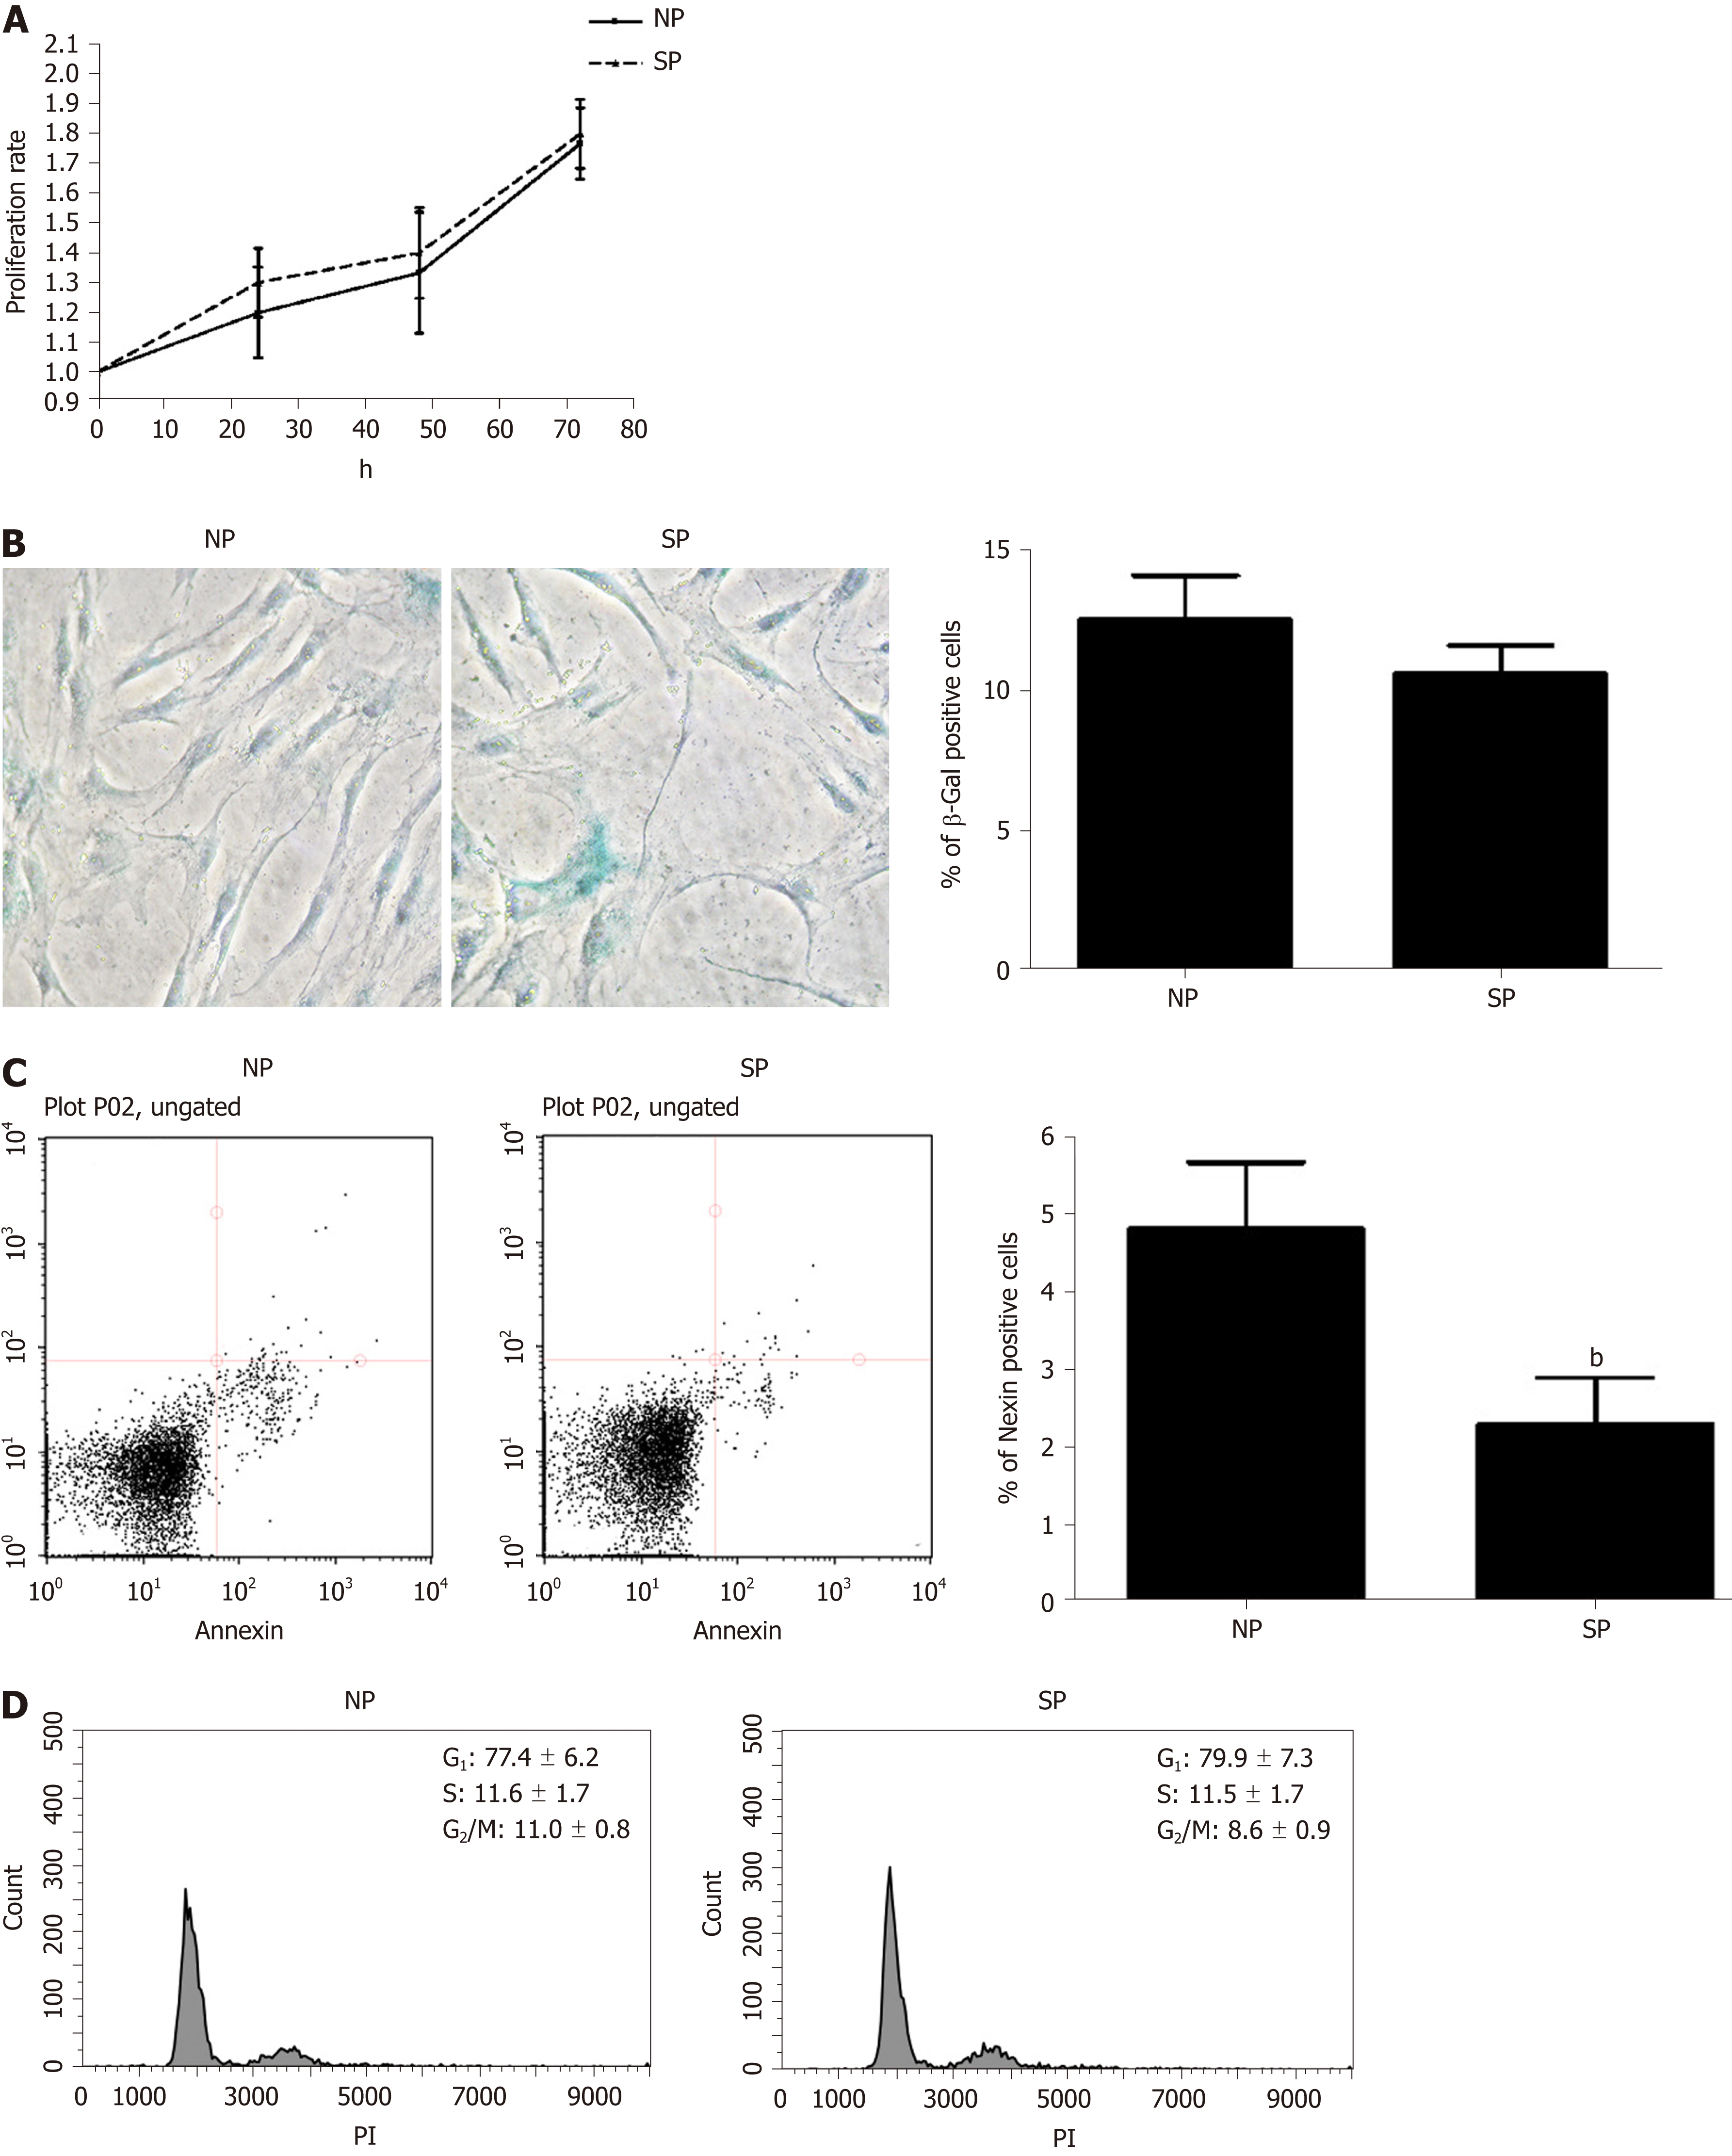
Figure 2 Mesenchymal stromal cell proliferation, cell cycle analysis, apoptosis, and senescence, following treatment with skinny people and normal people sera.
A: Cell proliferation of mesenchymal stromal cells (MSCs) was evaluated by a Quick Cell Proliferation Assay Kit II (Biovision, CA, United States) after treatment with normal people (NP) and skinny people (SP) serum; B: Senescence in MSC cultures. Representative microscopic fields of acid beta-galactosidase positive cells (blue) in NP- and SP-serum treated cultures. In the same panel, the graph shows mean percentage value of senescent cells (± SD, n = 3); C: Representative FACS analysis of MSC apoptosis. The experiments were carried out one week after treatment with sera. The assay allows the identification of early (Annexin V + and 7ADD −) and late apoptosis (Annexin V + and 7ADD +). Nevertheless, apoptosis is a continuous process and we calculated the percentage of apoptosis as the sum of early and late apoptotic cells, to avoid a discretional separation between early and late apoptosis. The histogram show the global percentage of Annexin V-positive cells. Data are expressed with standard deviation (n = 3, bP < 0.01); D: Representative Cell cycle FACS analysis of MSCs treted with NP and SP serum. Data are expressed with SD (n = 3). MSCs: Mesenchymal stromal cells; NP: Normal people; SP: Skinny people.
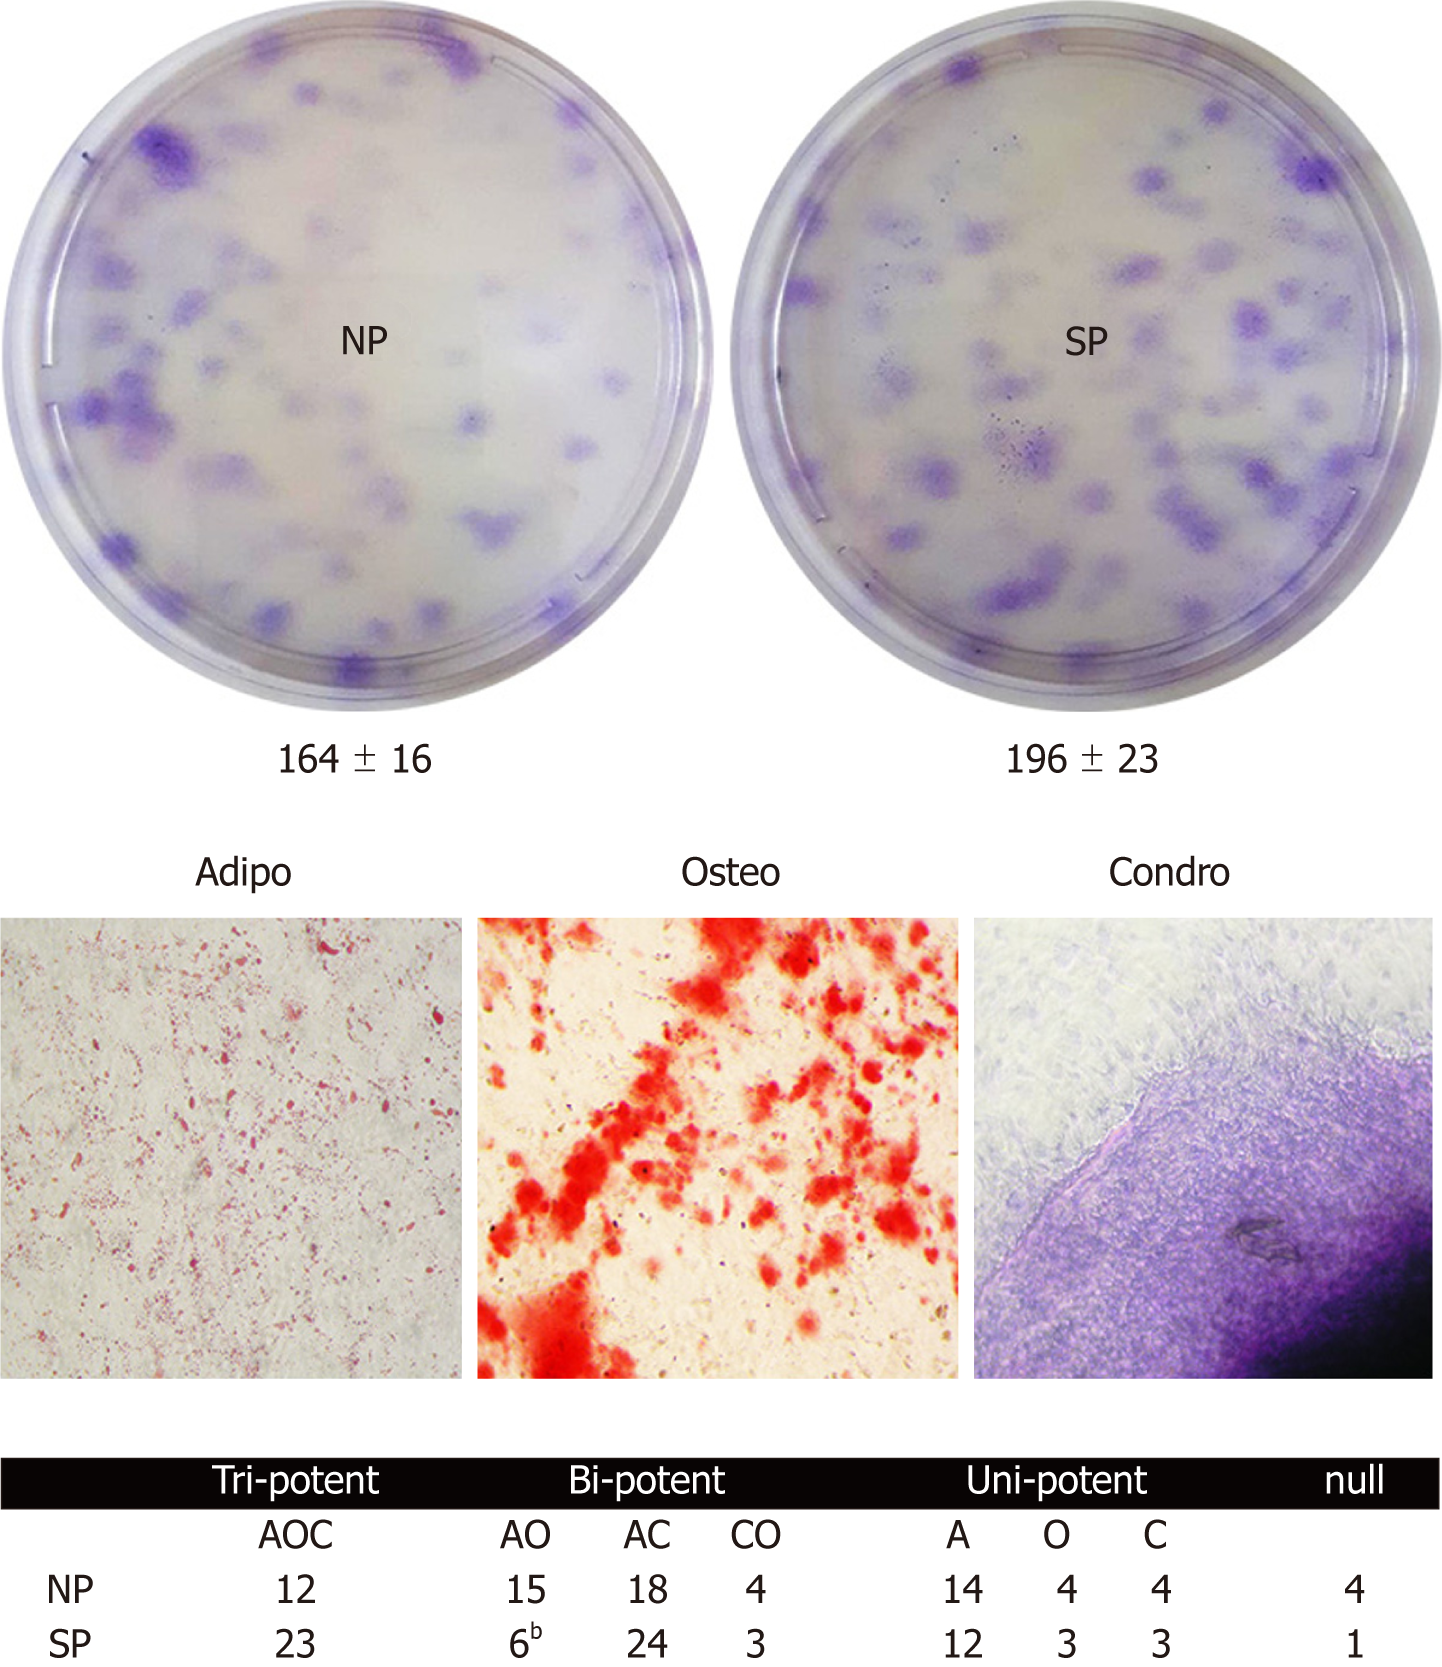
Figure 3 Colony Forming Units assay to evaluate the effect of sera on mesenchymal stromal cell stemness.
The upper picture shows representative crystal violet staining of clones obtained after treatment of mesenchymal stromal cells (MSCs) with normal people or skinny people sera. The numbers below culture plates indicate the MSC colonies identified in the two experimental conditions (n = 3, data are expressed ± SD). The lower pictures show representative adipo-osteo and chondro-staining to analyze MSC clonal differentiation process. The table reports the result of the clonal differentiation assay, which shows clones with tri-, bi-, and unipotent ability. Data are expressed with SD (bP < 0.01). NP: Normal people; SP: Skinny people; A: Adipogenic phenotype; O: Osteogenic phenotype; C: Chondrogenic phenotype.
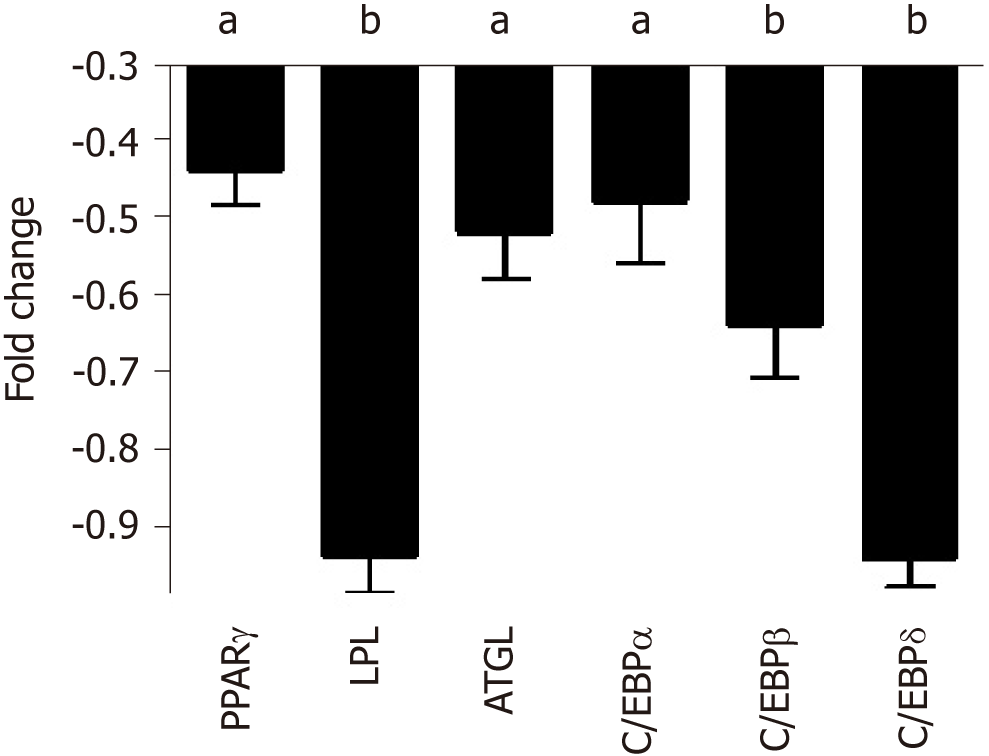
Figure 4 qRT-PCR analysis of adipocyte differentiation markers in mesenchymal stromal cell cultures treated with either normal people or skinny people.
The histogram shows the changes in mRNA expression levels of early and late adipocyte differentiation markers in mesenchymal stromal cells after 7 d priming with skinny people (SP) or normal people (NP) sera and further cultivation for 21 d in media with DMEM and 10% fetal bovine serum. Early genes (C/EBPß and C/EBPδ) are used to identify committed adipocyte progenitors, while late genes (PPARγ, C/EBPα, LPL, and ATGL) are expressed in terminally differentiated adipocytes. mRNA levels were normalized with respect to GAPDH, which was chosen as an internal control. Each experiment was repeated at least three times. Data are expressed as fold change in SP vs NP (aP < 0.05; bP < 0.01). NP: Normal people; SP: Skinny people; ATGL: Adipose triglyceride lipase.
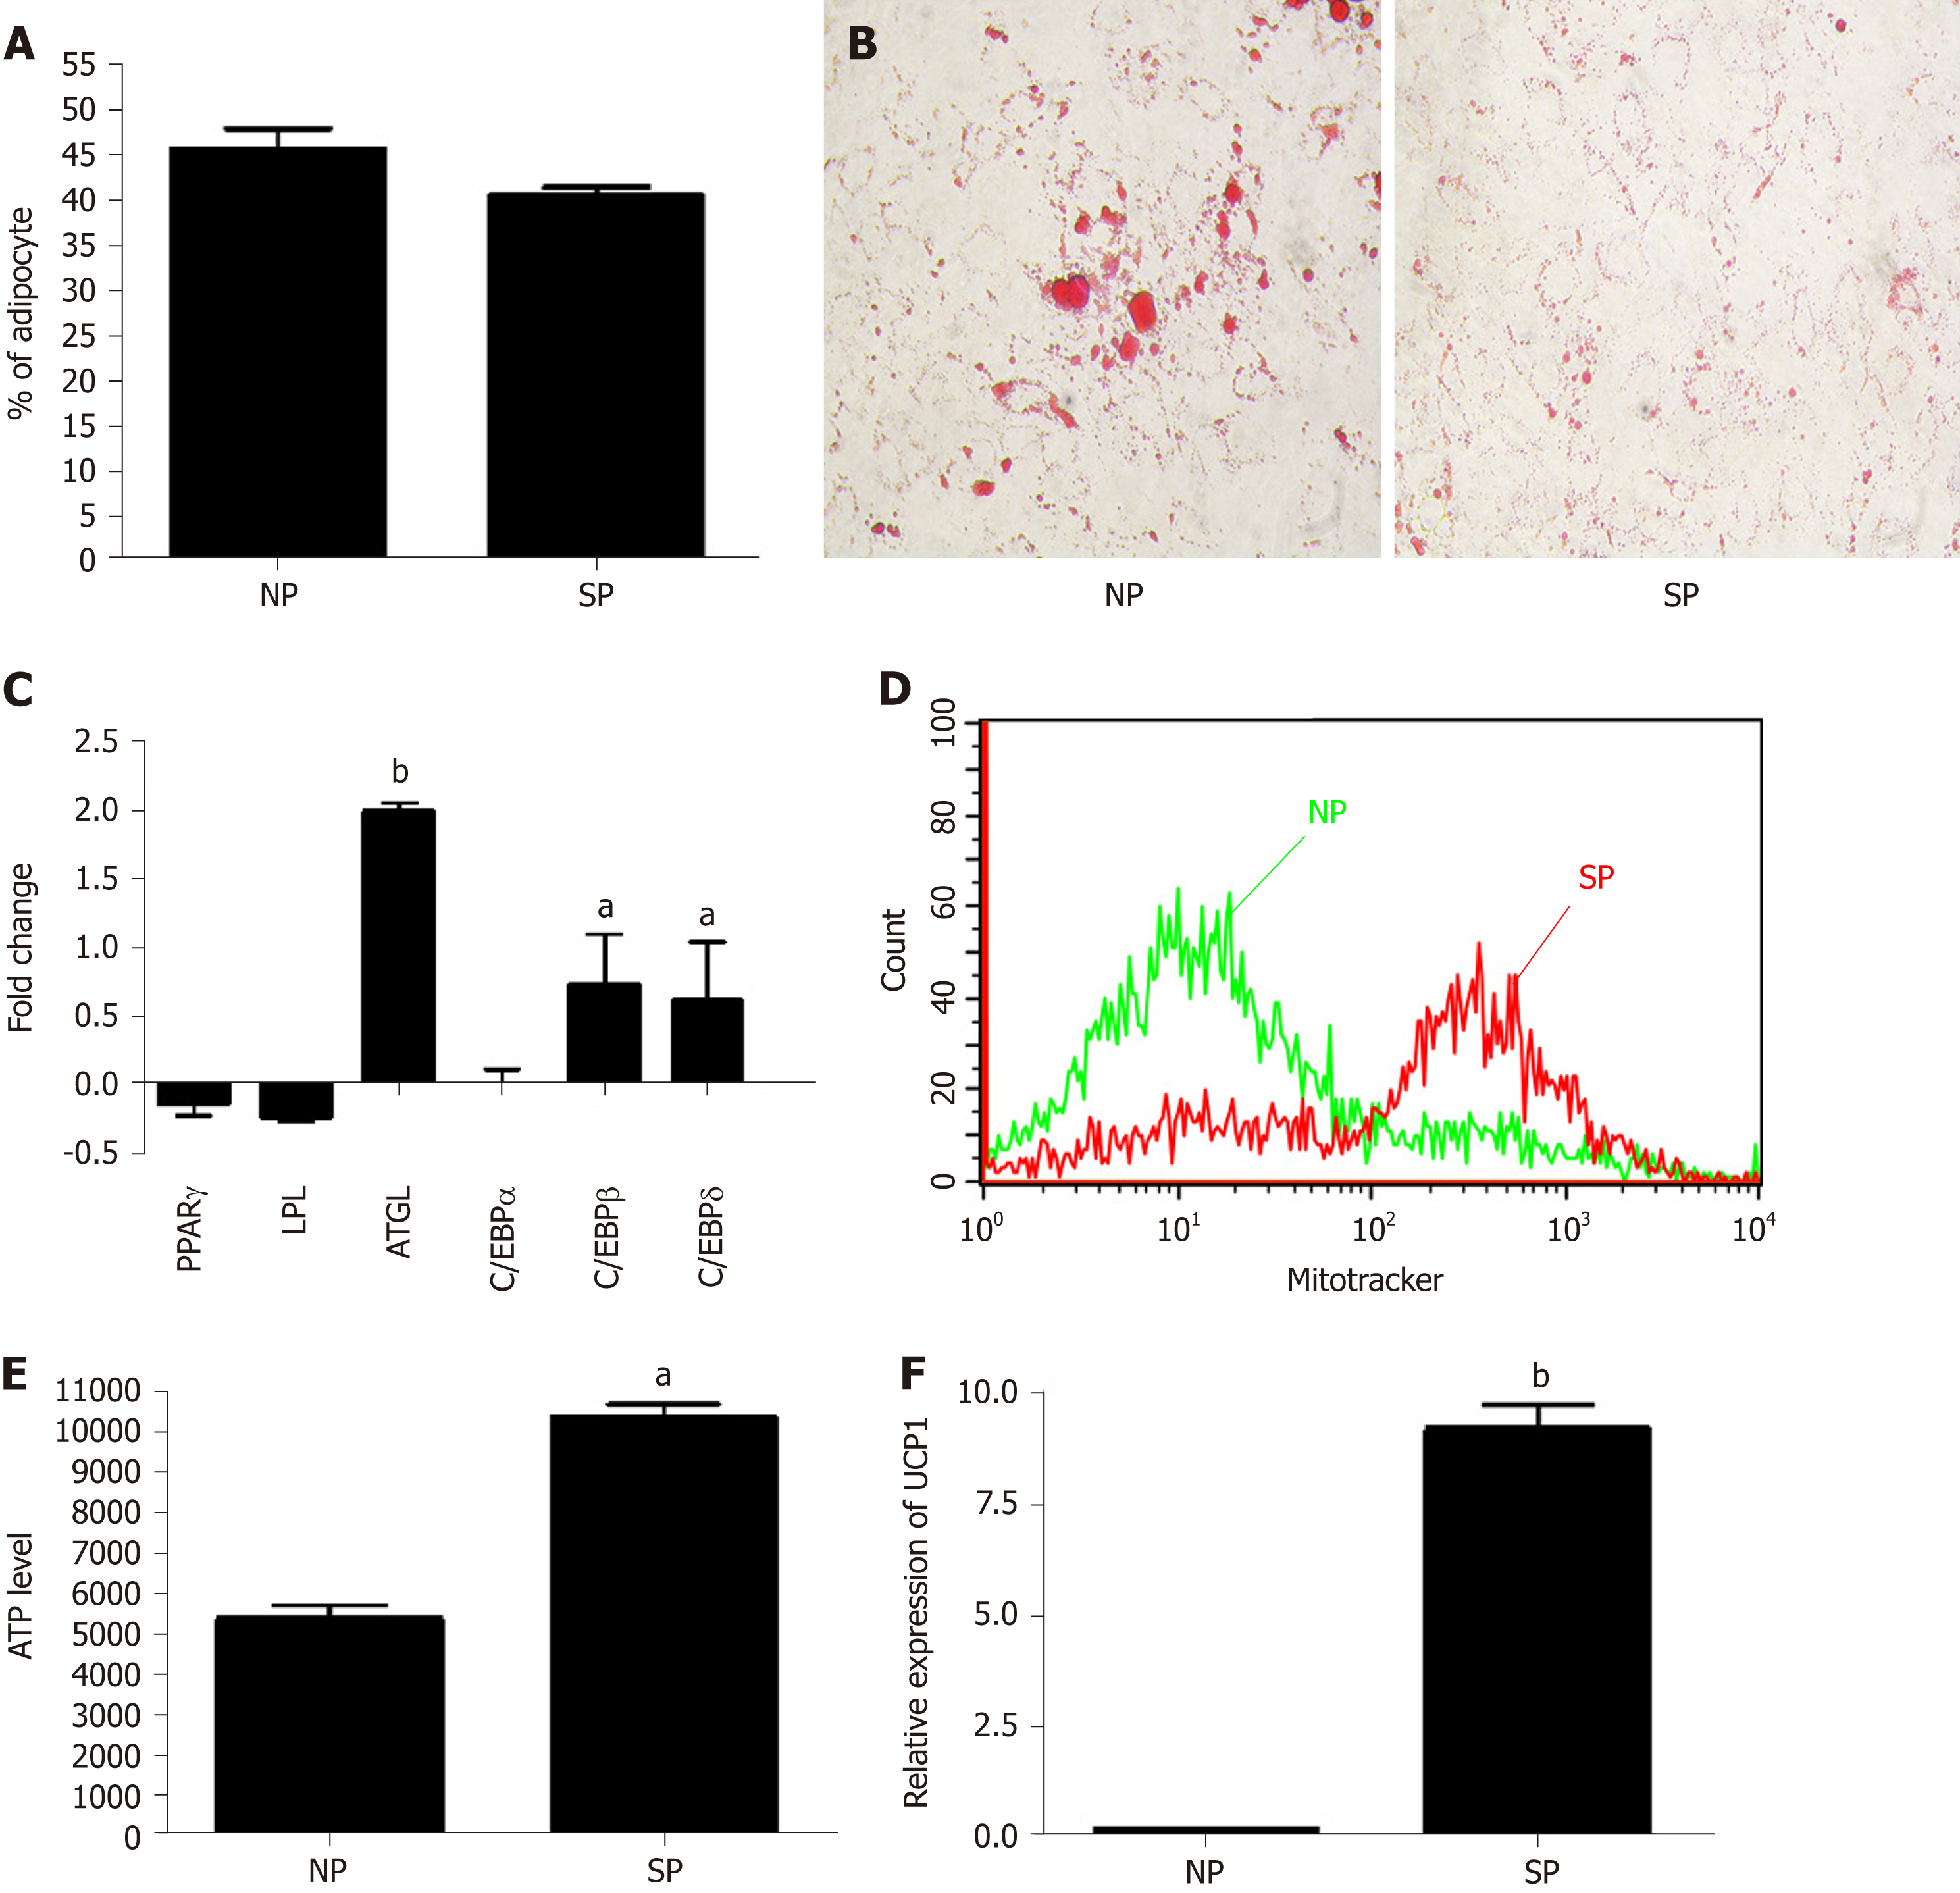
Figure 5 Analysis of mesenchymal stromal cell induced adipocyte differentiation after initial priming of 7 d with skinny people sera and subsequently treated with adipogenic differentation medium.
A: Percentage of adipocytes, as detected by Oil Red O staining; B: Evaluation of lipid droplets size by Oil Red O staining in mesenchymal stromal cells (MSCs); C: mRNA expression levels of early and late adipocyte differentiation markers. Early genes (C/EBPß and C/EBPδ) are used to identify committed adipocyte progenitors, while late genes (PPARγ, C/EBPα, LPL, and ATGL) are expressed in terminally differentiated adipocytes. The mRNA levels were normalized with respect to GAPDH, which was chosen as an internal control. Each experiment was repeated at least three times. Data are expressed as fold change in skinny people (SP) vs normal people (NP) (bP < 0.01); D: MitoTracker probes to label the mitochondria in MSC cultures. Data were acquired by Guava EasyCyte flow cytometer. The graph shows the mitochondria staining per cell. The medium stain intensity (X axis) is lower in NP-primed samples compared with SP samples; E: ATP level measured by ATP Colorimetric/Fluorometric Assay Kit in MSCs treated with NP and SP sera and then incubated in minimal medium without energetic supplements (amino acids, carbohydrates, lipids). Data are expressed as arbitrary units (n = 3 ± SD, aP < 0.05); F: mRNA expression levels of UCP1 in SP- and NP-primed cultures. The mRNA levels were normalized with respect to GAPDH and data are expressed as arbitrary units (n = 3 ± SD, bP < 0.01). NP: Normal people; SP: Skinny people; ATGL: Adipose triglyceride lipase.
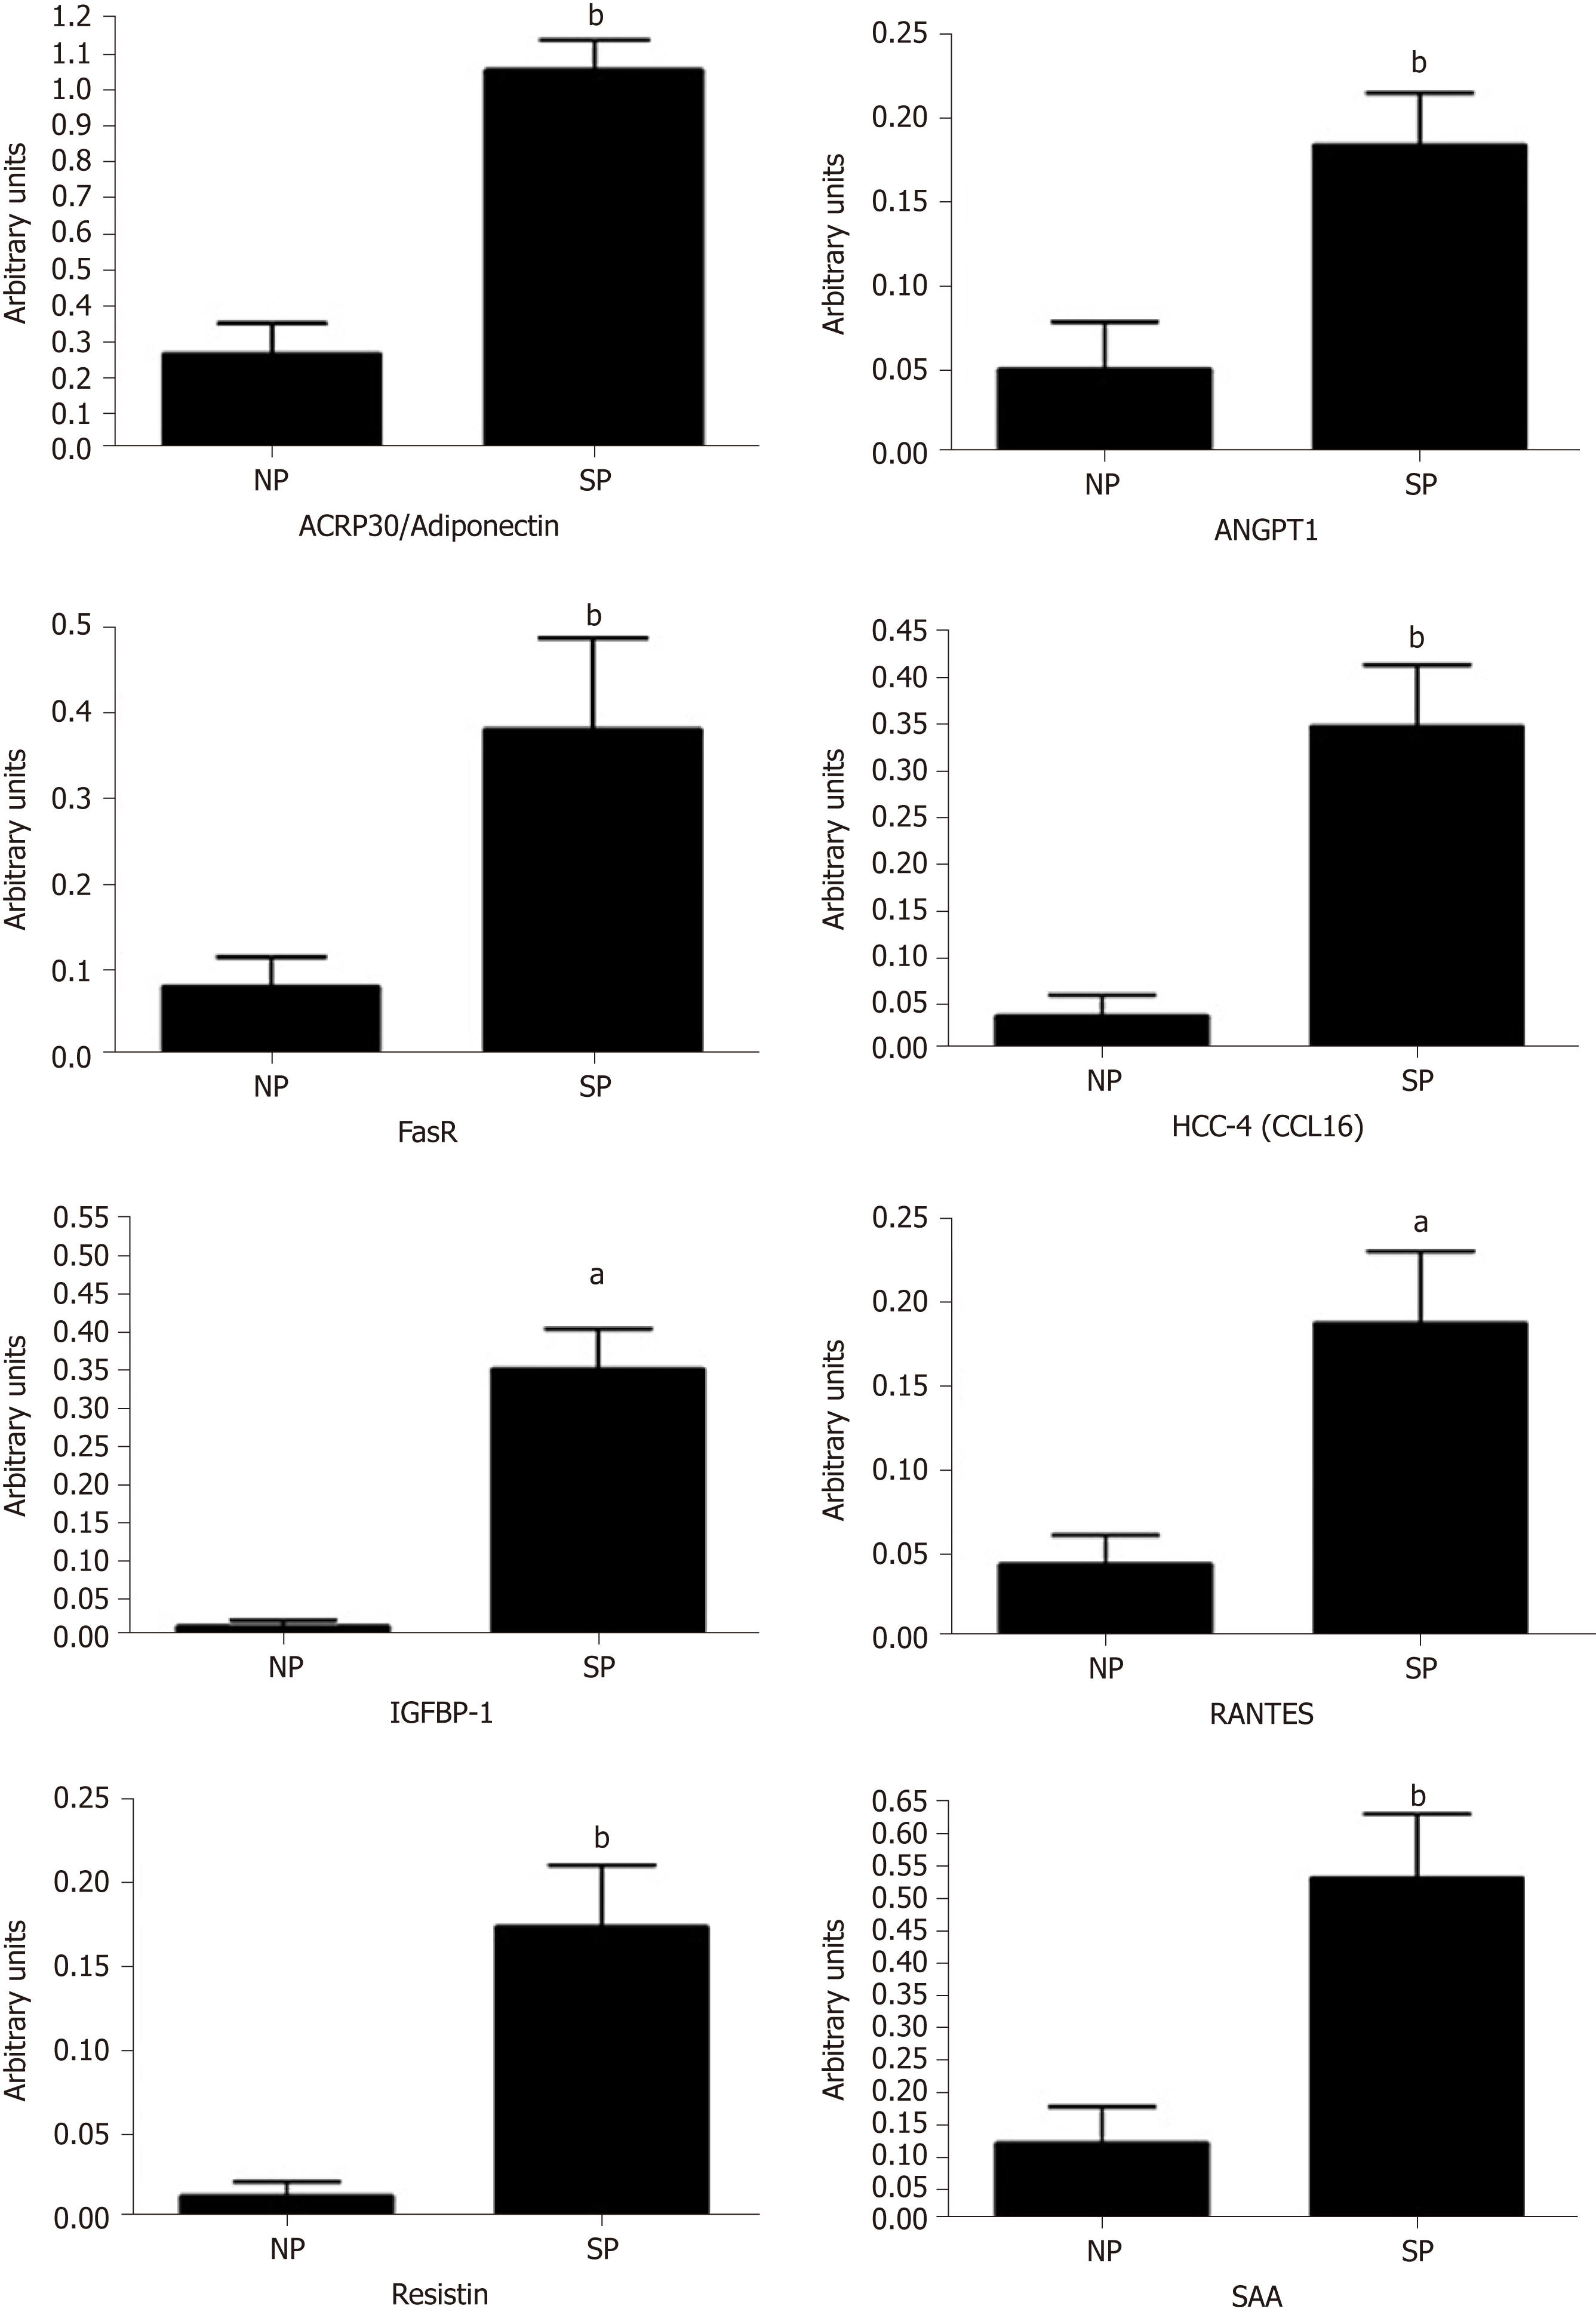
Figure 6 Cytokines detection in sera.
The histogram shows the cytokines on the Human Obesity Antibody Array C1 (RayBiotech, Norcross, GA United States) that were detected in SP and NP sera. Array signals were acquired using the Chemidoc system (Bio-Rad) and the associated software QuantityOne. Data are expressed as arbitrary units (n = 3 ± SD, aP < 0.05, bP < 0.01). The picture shows only the cytokines whose expression was above the limit of quantification. NP: Normal people; SP: Skinny people; SAA: Serum amyloid A; RANTES: CCL5; IGFBP-1: Insulin-like growth-factor-binding protein-1.
- Citation: Alessio N, Squillaro T, Monda V, Peluso G, Monda M, Melone MA, Galderisi U, Di Bernardo G. Circulating factors present in the sera of naturally skinny people may influence cell commitment and adipocyte differentiation of mesenchymal stromal cells. World J Stem Cells 2019; 11(3): 180-195
- URL: https://www.wjgnet.com/1948-0210/full/v11/i3/180.htm
- DOI: https://dx.doi.org/10.4252/wjsc.v11.i3.180


