Copyright
©The Author(s) 2025.
World J Gastroenterol. Nov 21, 2025; 31(43): 111494
Published online Nov 21, 2025. doi: 10.3748/wjg.v31.i43.111494
Published online Nov 21, 2025. doi: 10.3748/wjg.v31.i43.111494
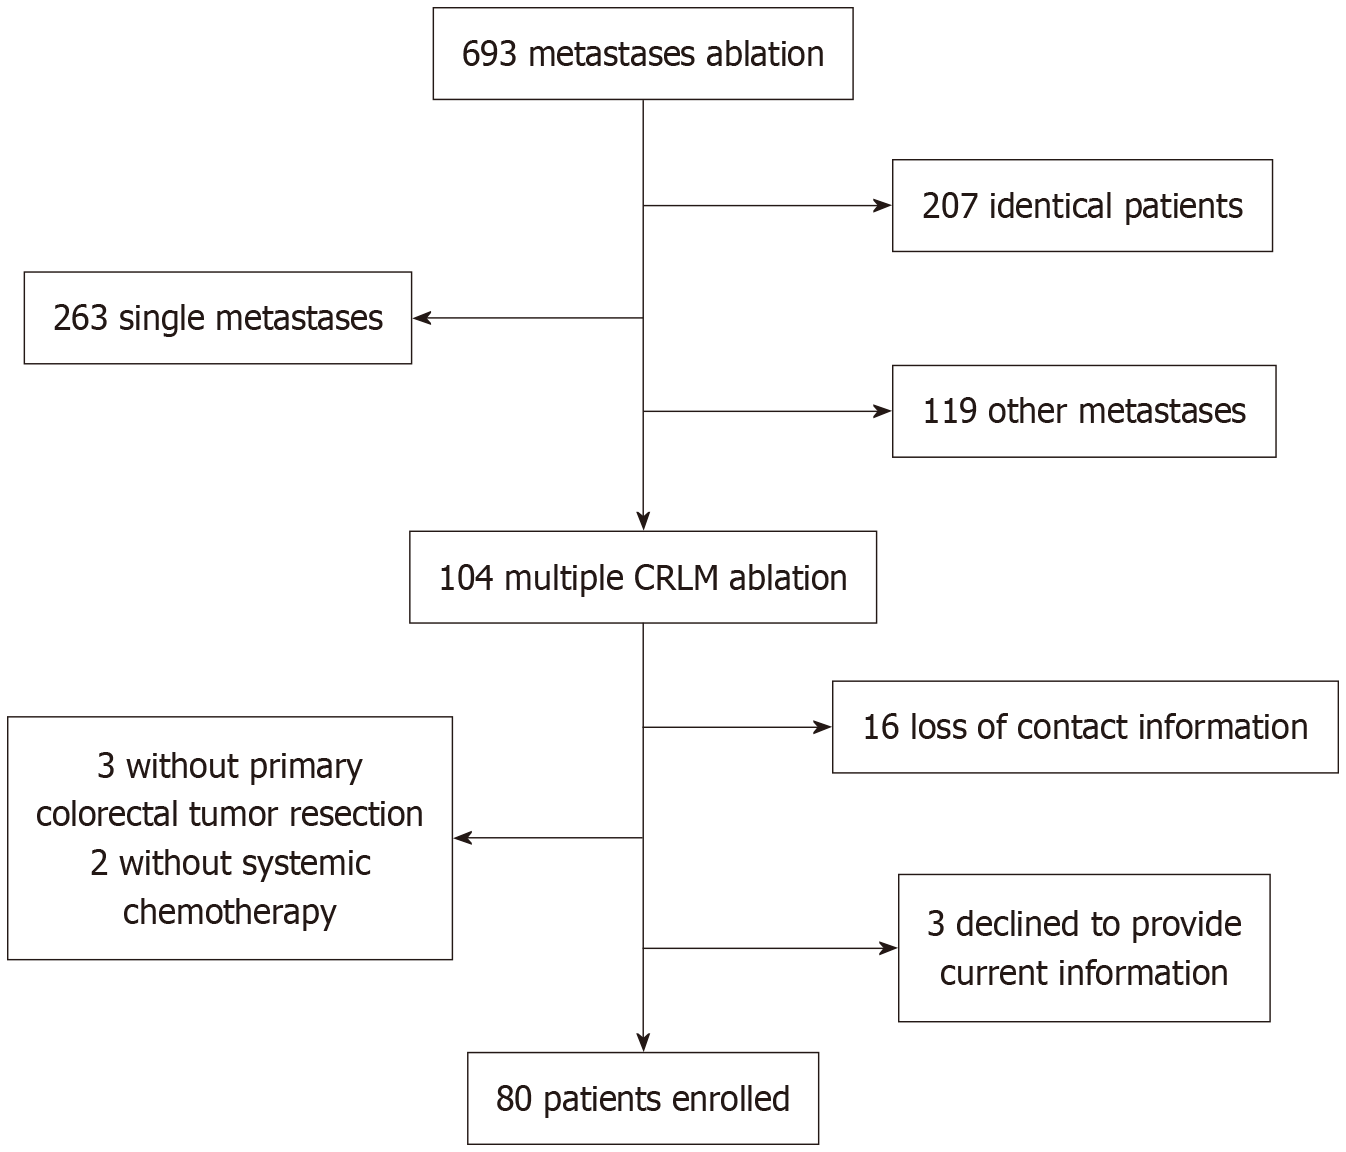
Figure 1 Flowchart of patients enrolled for multiple colorectal liver metastases ablation.
CRLM: Colorectal liver metastases.
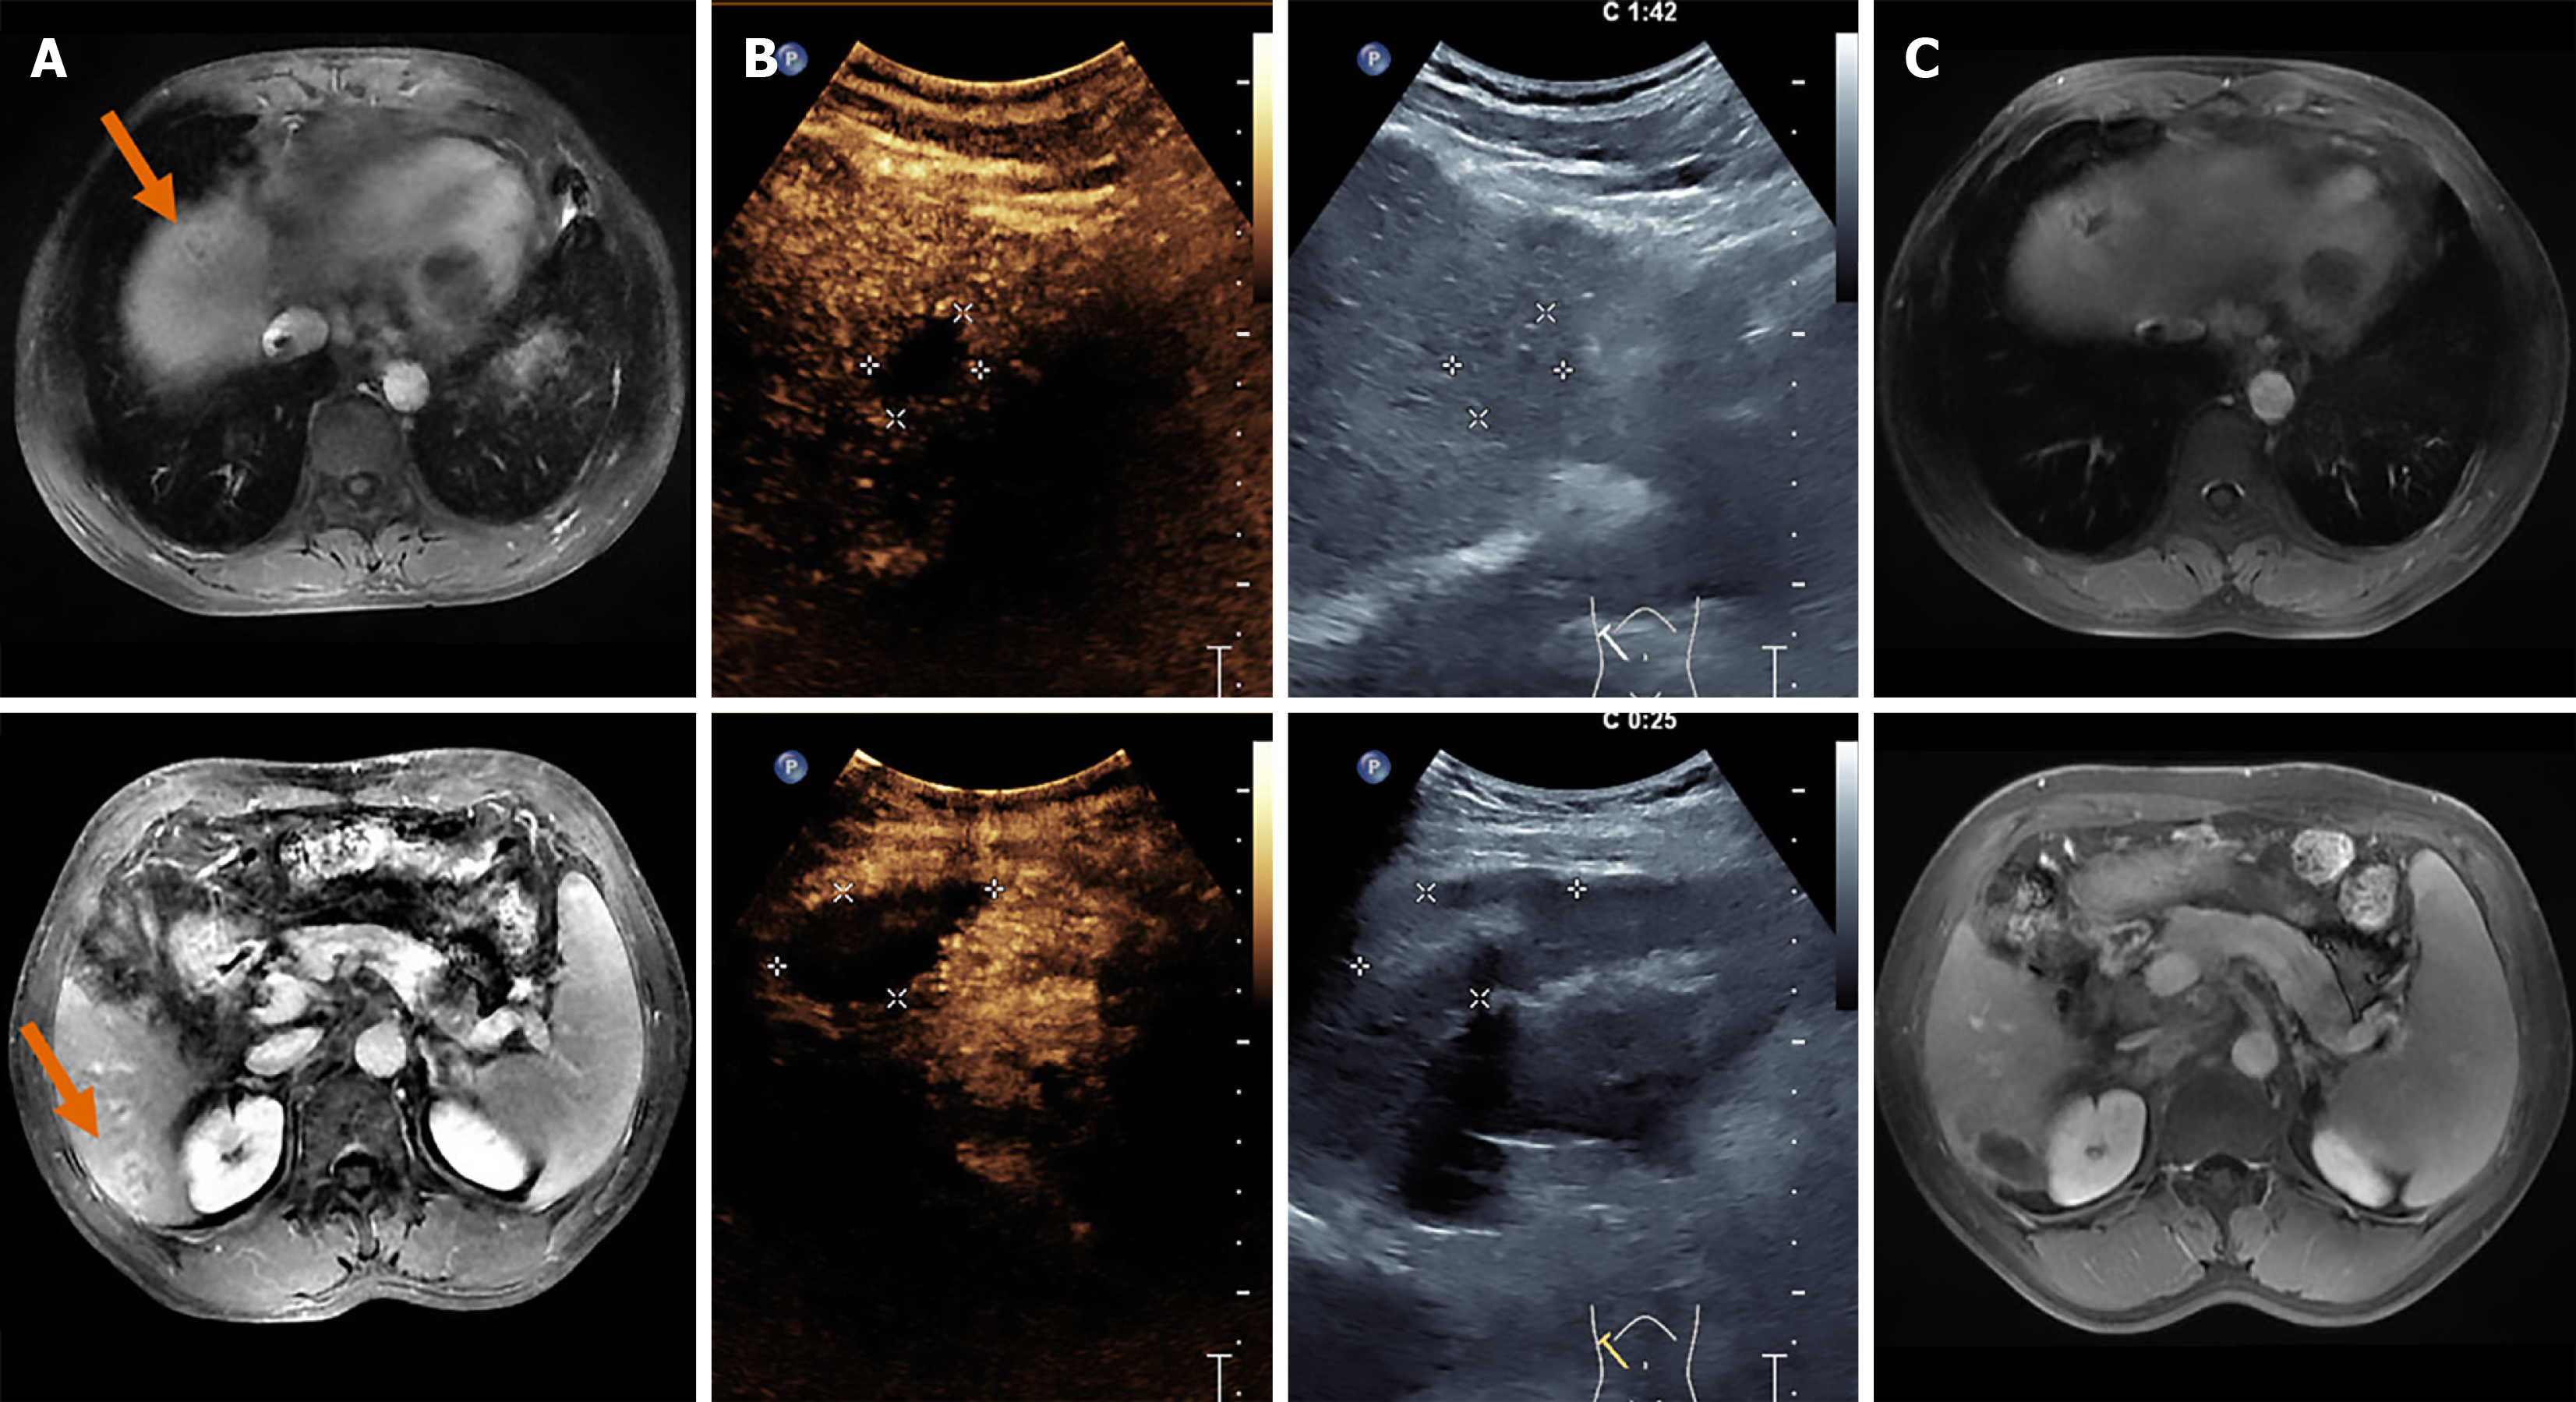
Figure 2 Single-session ablation: A 62-year-old male underwent successful ablation of two colorectal liver metastases in liver segments S4 and S6 during a single-session ablation procedure.
A: Pre-ablation imaging (orange arrows point to the target lesion); B: Intraoperative contrast-enhanced ultrasound; C: Post-ablation imaging.
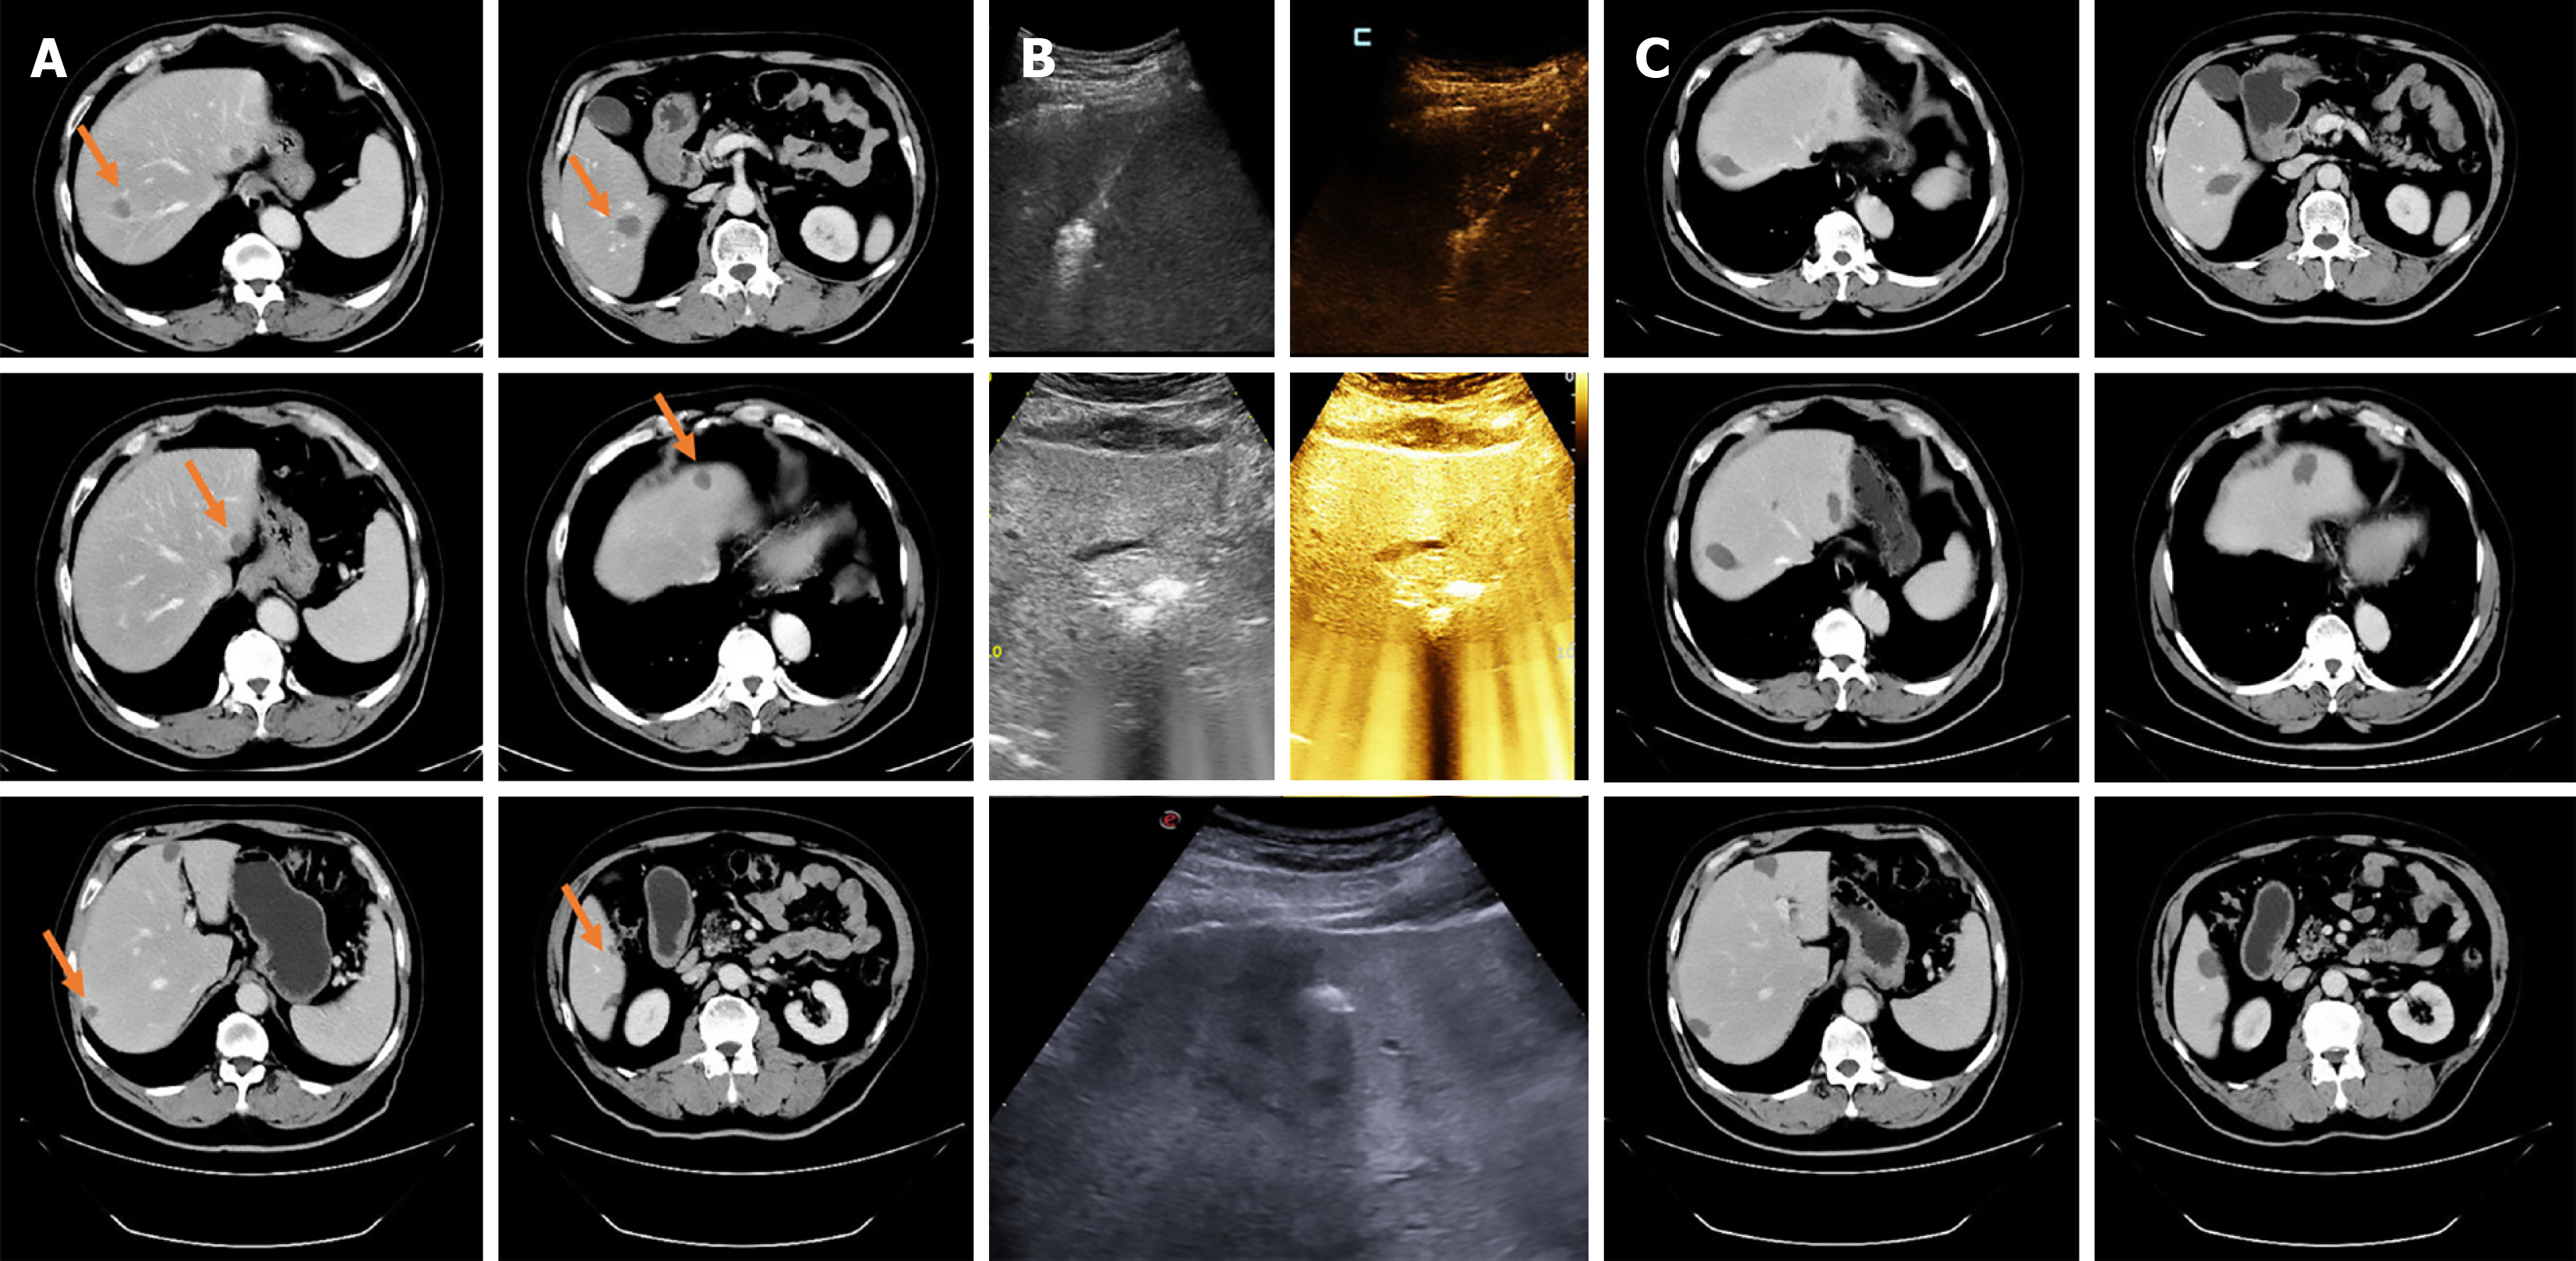
Figure 3 Repeat ablation: A 58-year-old male patient with an initial total of 9 colorectal liver metastases completed ablation in 3 sessions.
Within 3 months, 2, 3, and 4 lesions were ablated separately. A: Pre-ablation imaging (orange arrows point to the target lesion); B: Intraoperative contrast-enhanced ultrasound/ultrasound; C: Post-ablation imaging.
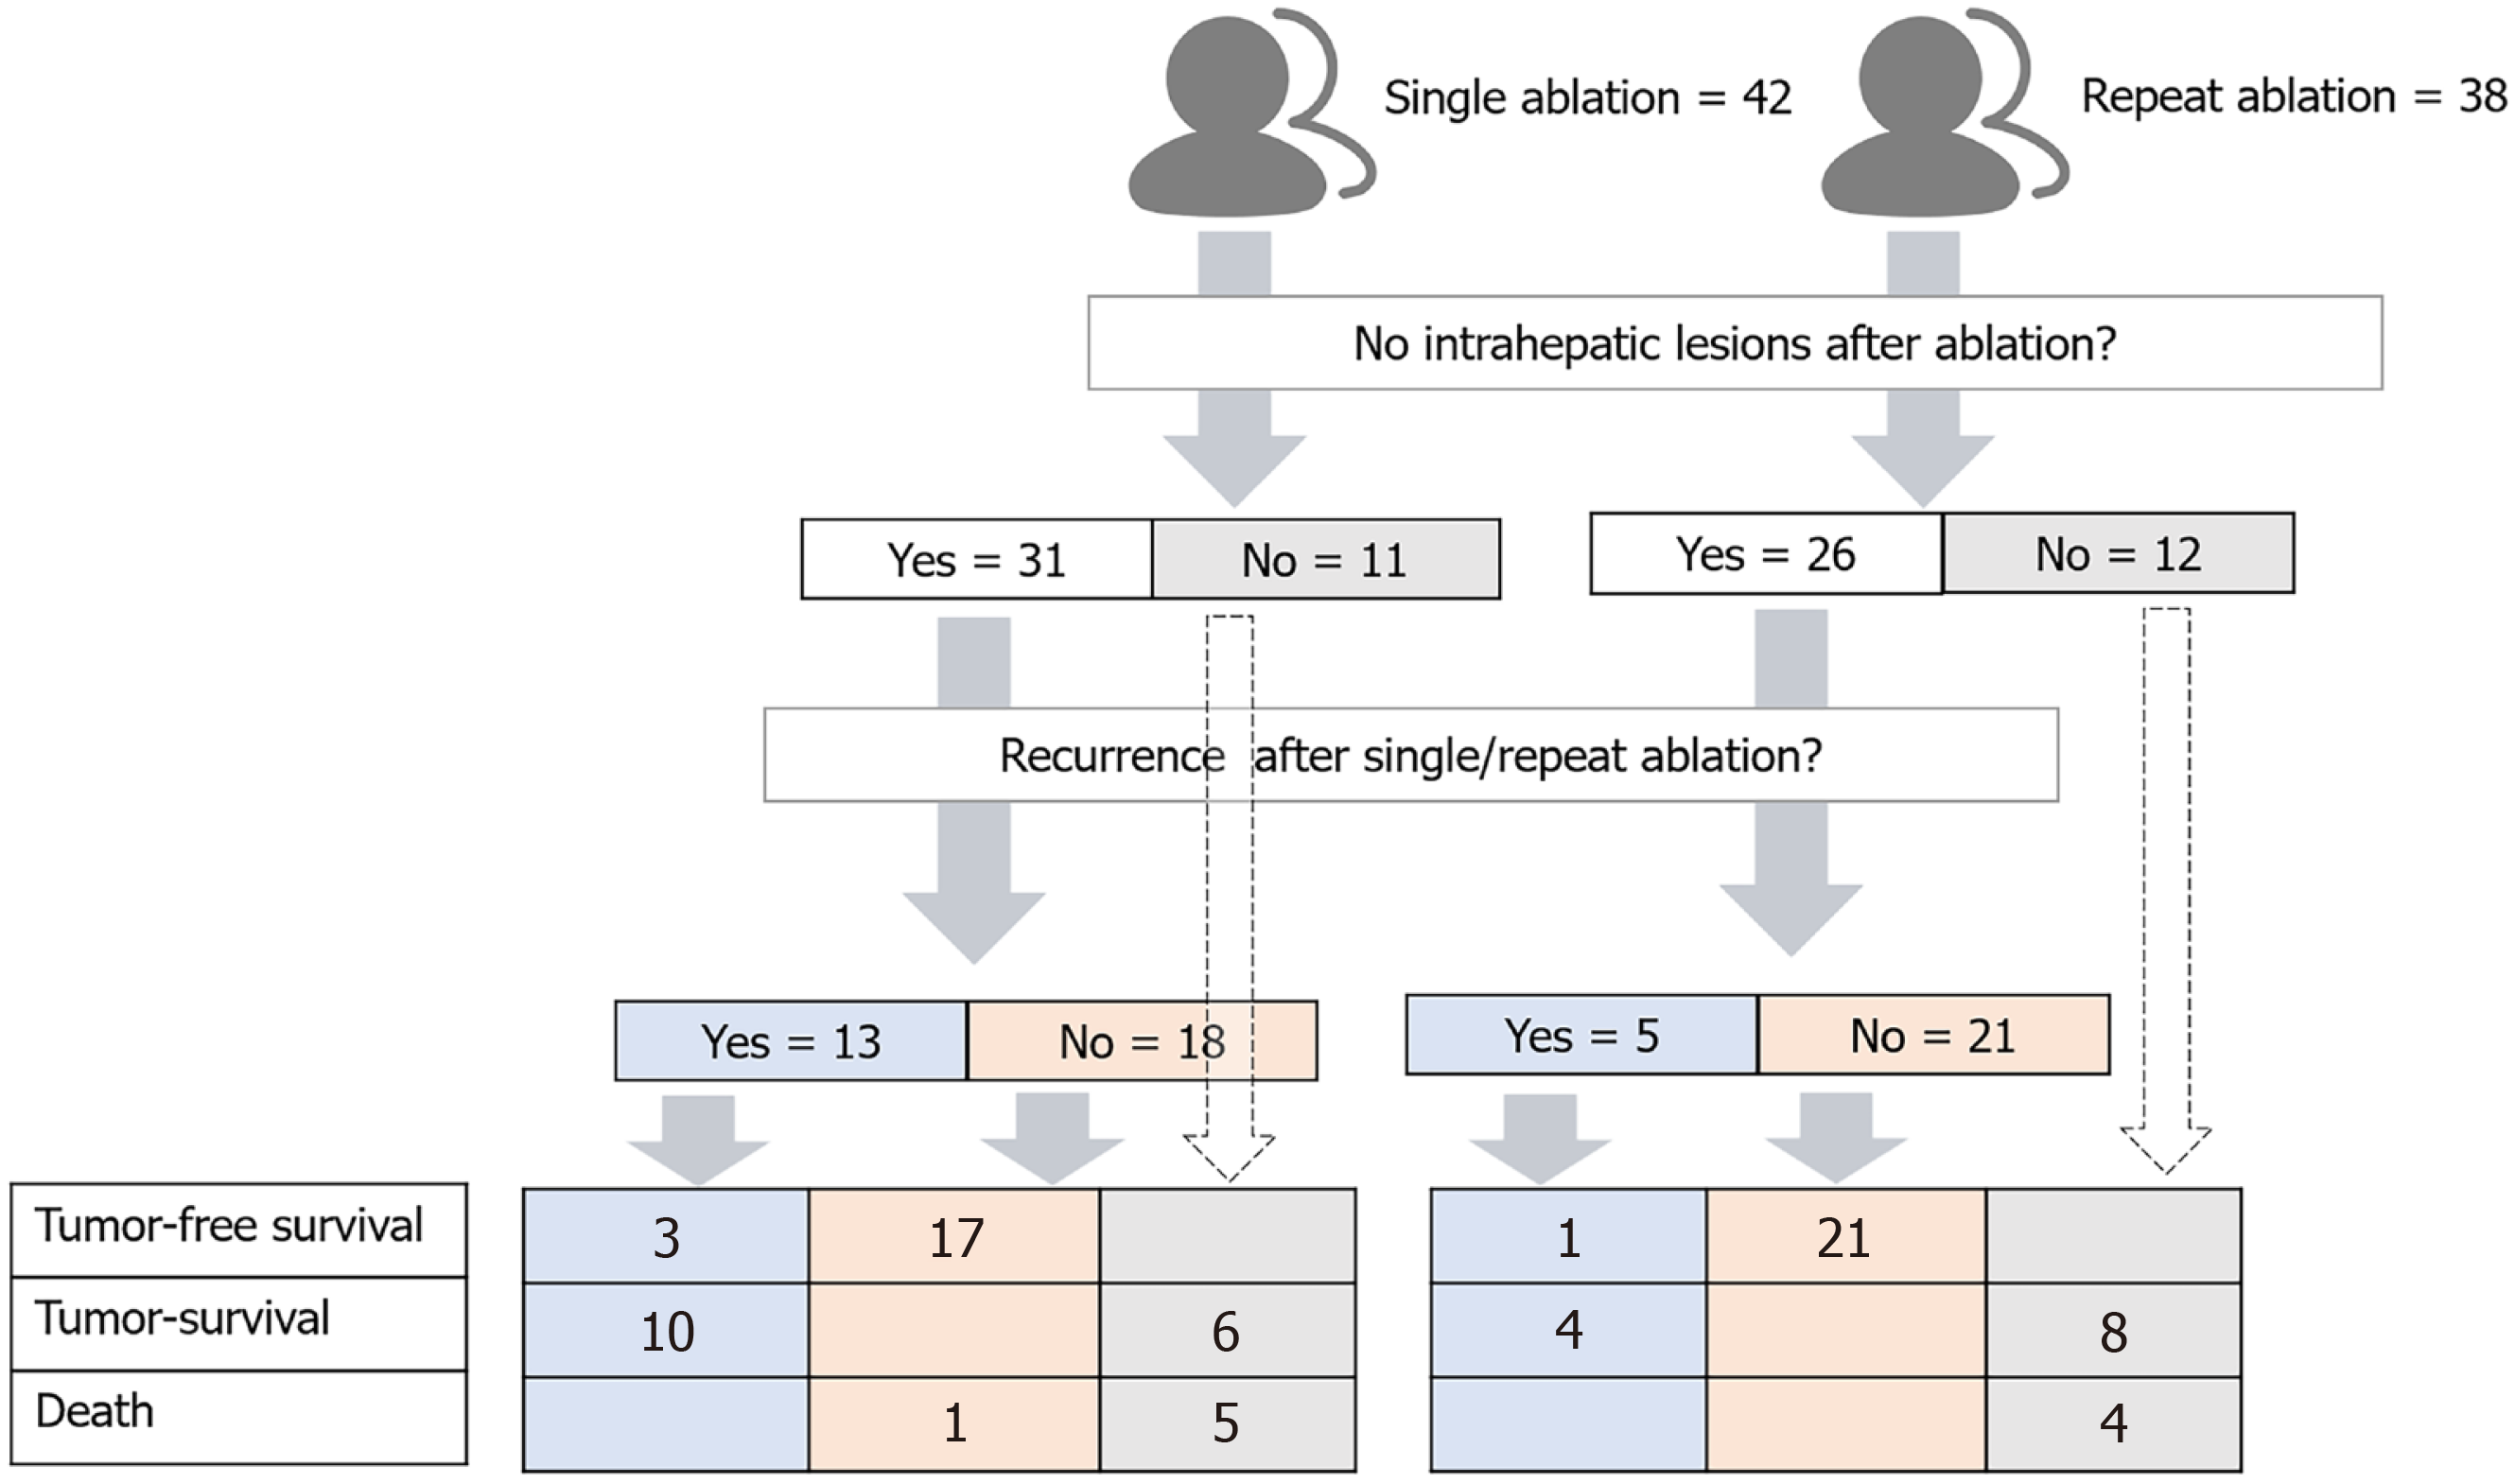
Figure 4
Survival distribution at every phase.
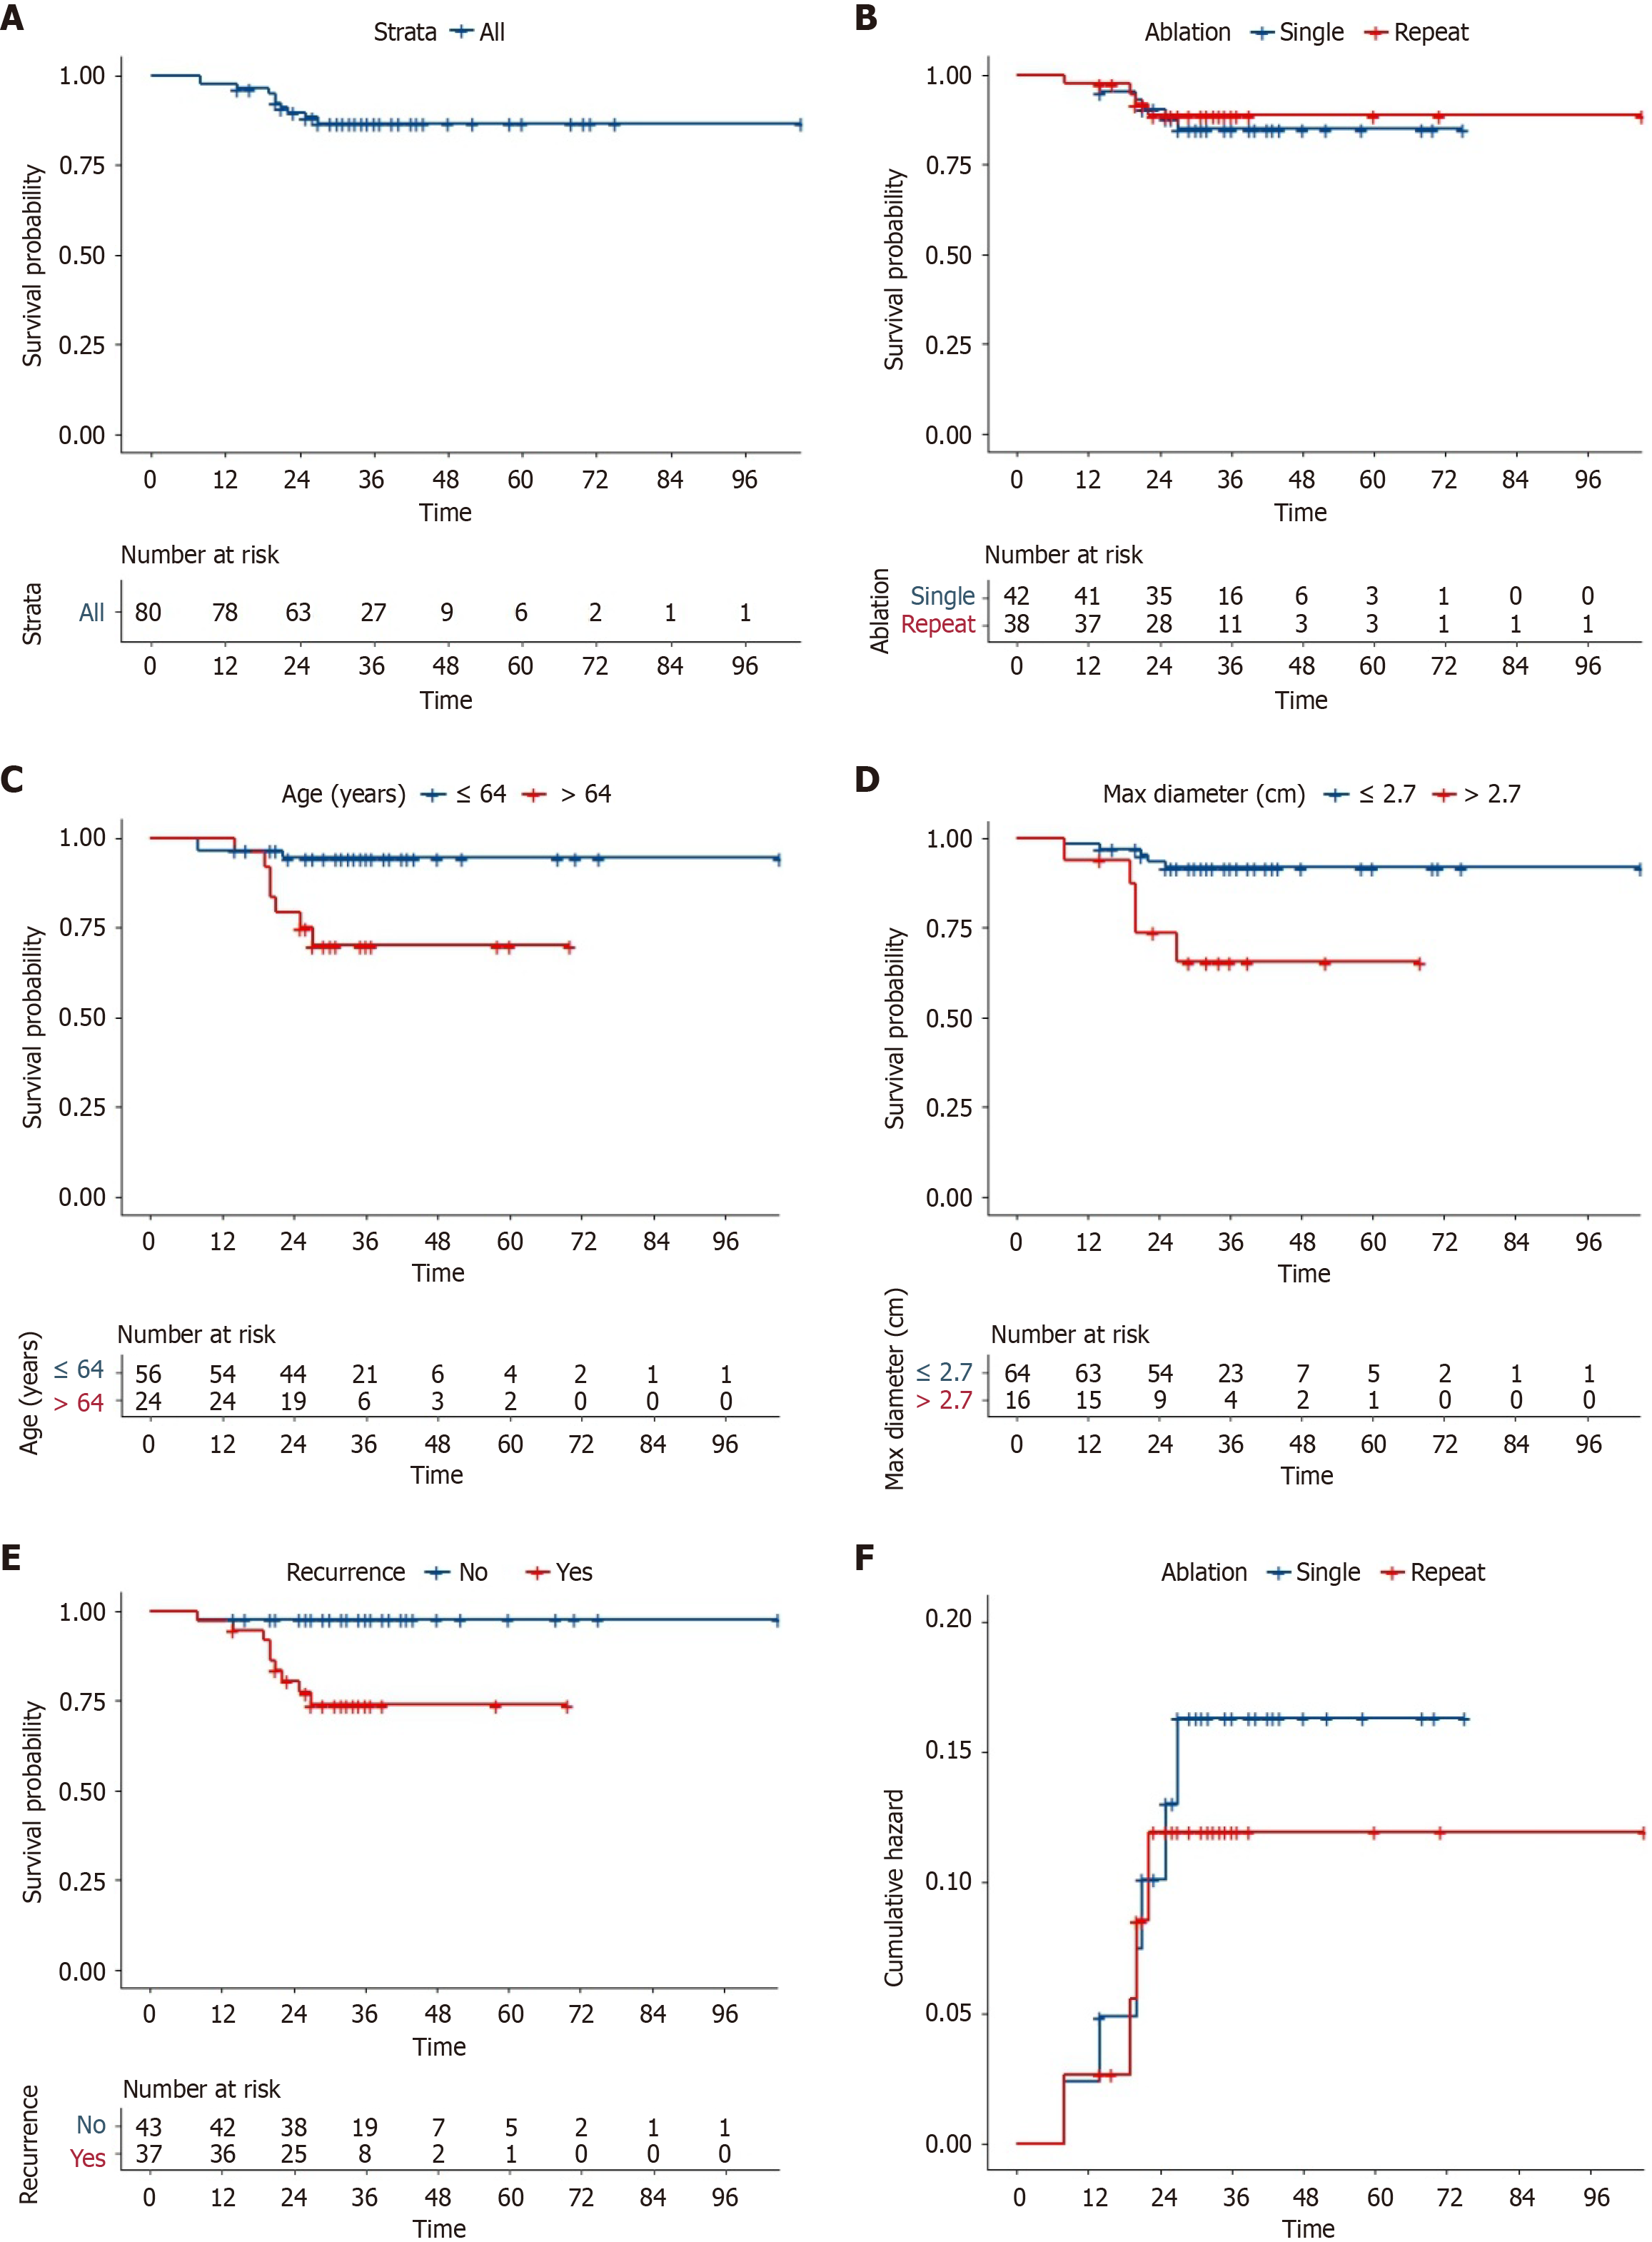
Figure 5 Corresponding Kaplan-Meier curves for overall survival.
A: Total Kaplan-Meier curves for overall survival (OS); B: Kaplan-Meier curves for OS with two ablation cohort; C-E: Kaplan-Meier curves for OS with age, lesion size and recurrence; F: The cumulative incidence curve.
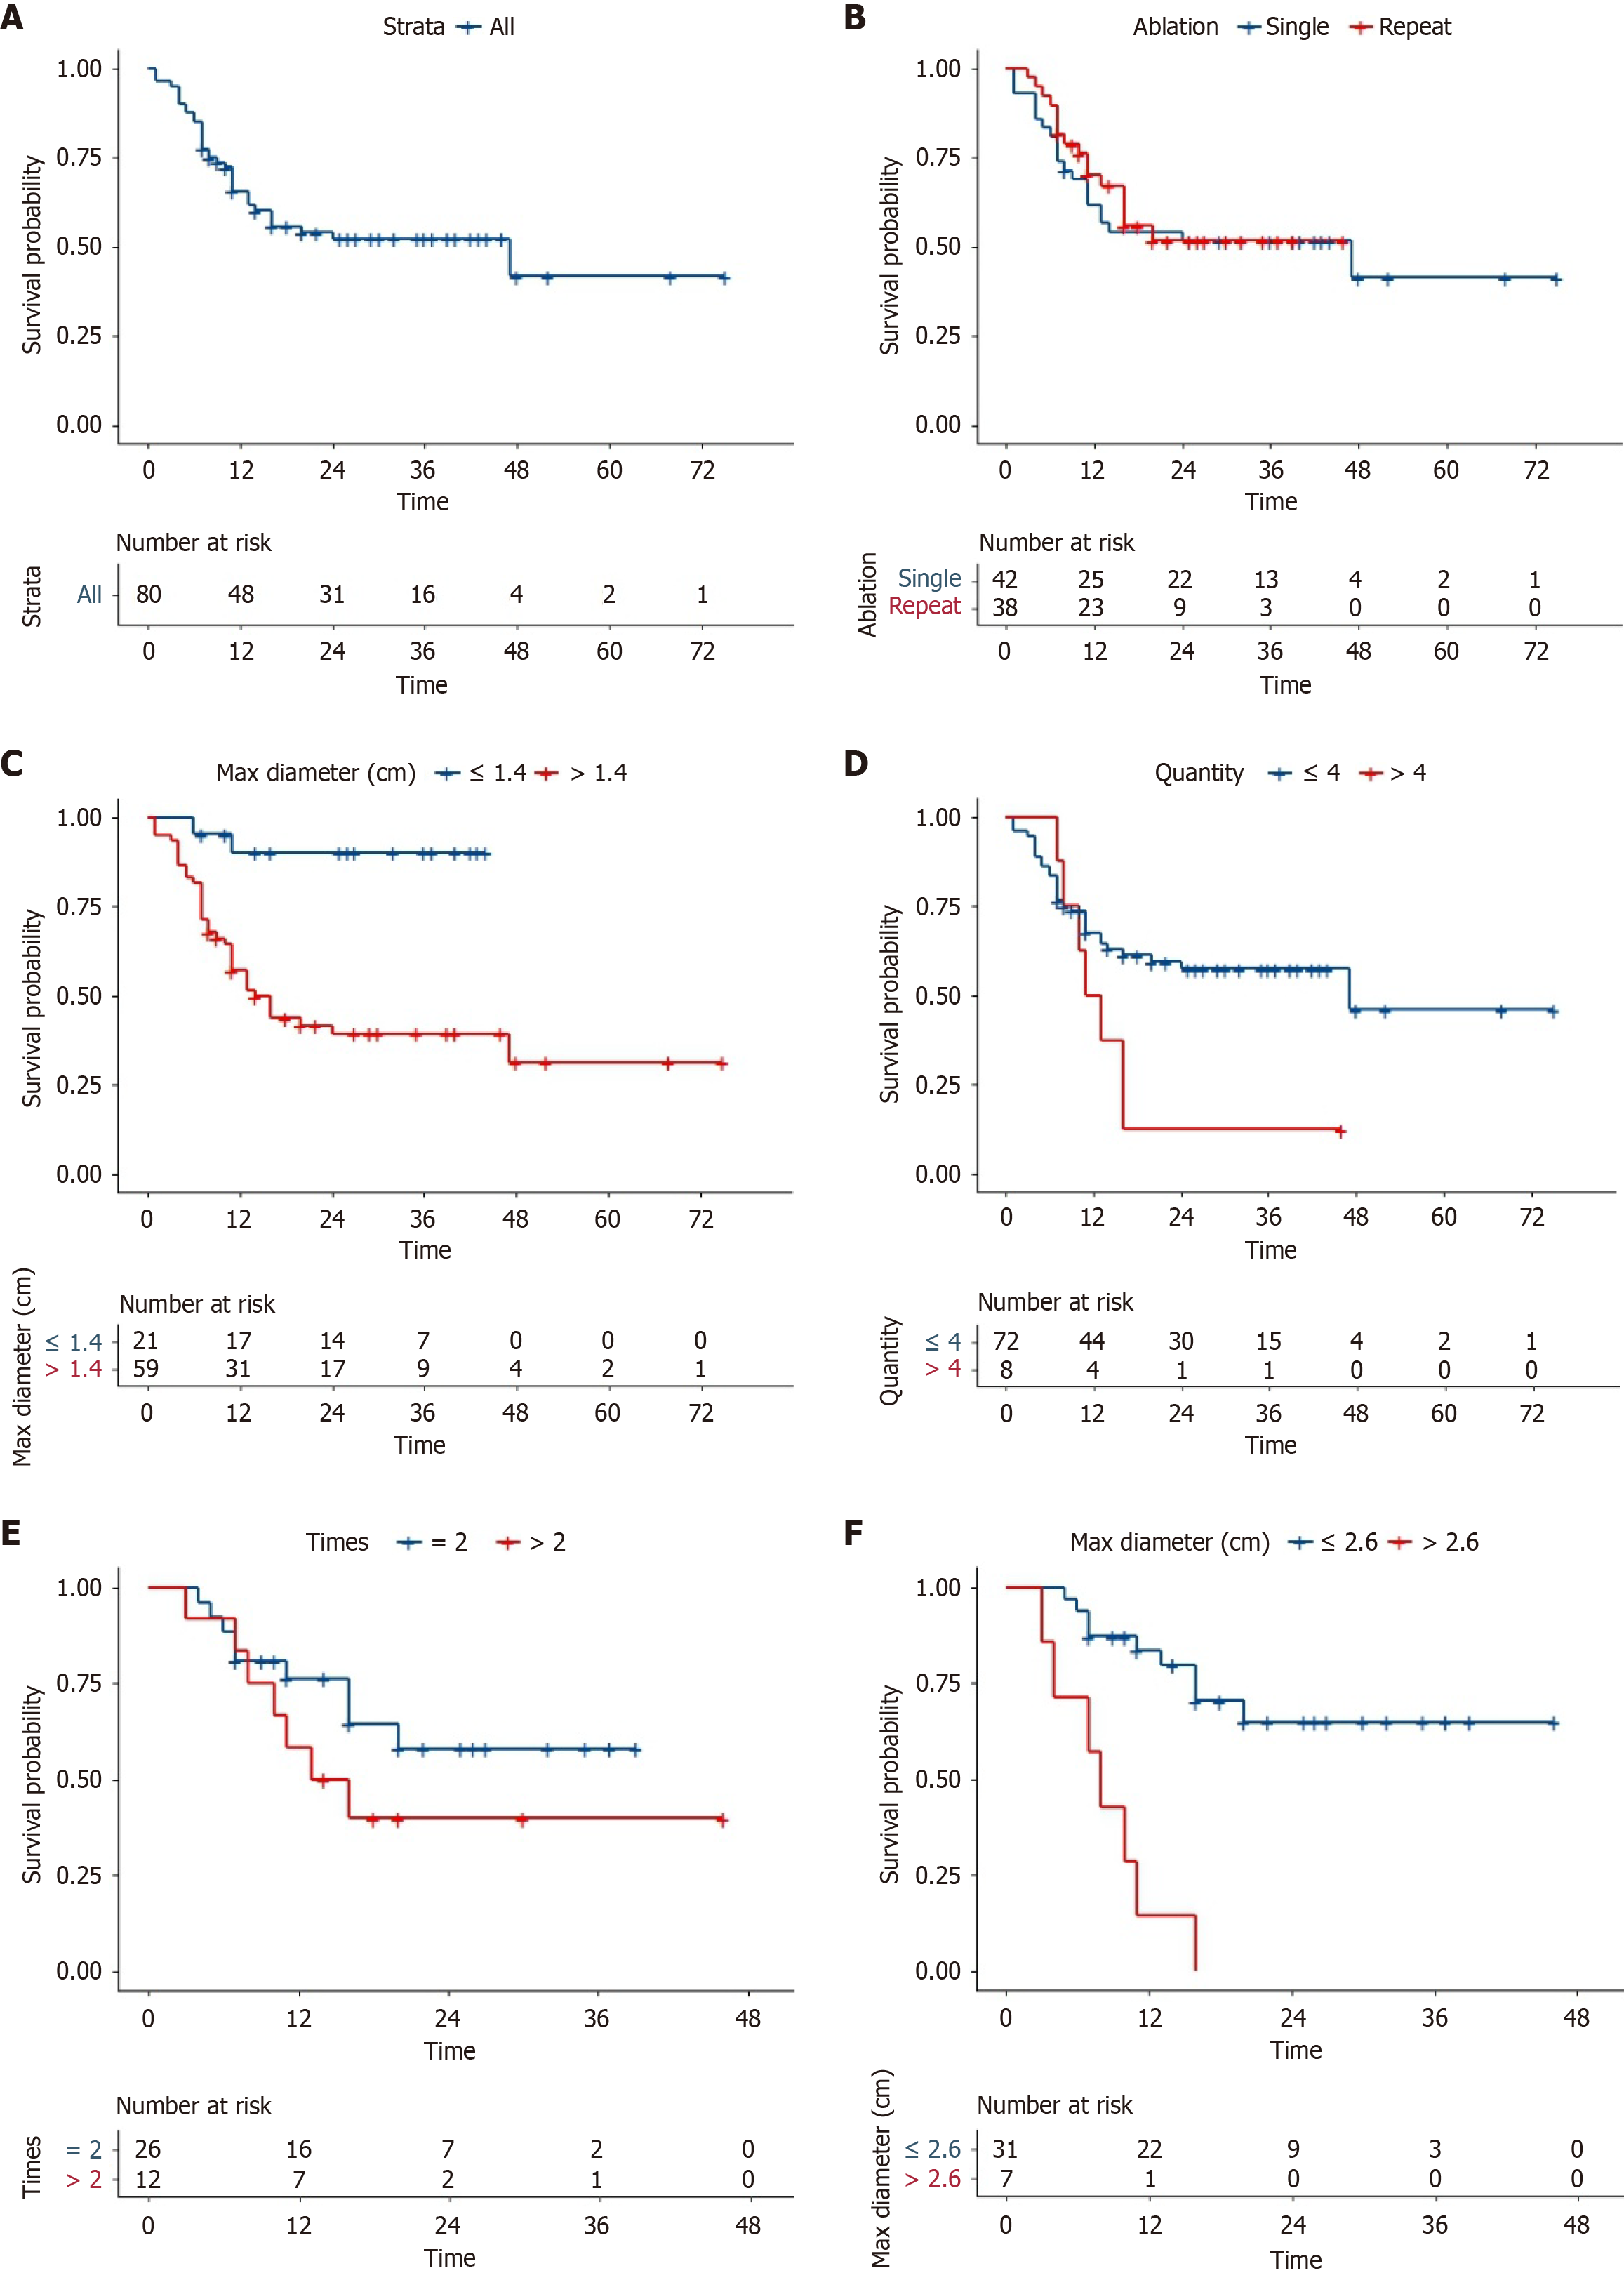
Figure 6 Corresponding Kaplan-Meier curves for progression-free survival.
A: Total Kaplan-Meier curves for progression-free survival (PFS); B: Kaplan-Meier curves for PFS with two ablation cohort; C-E: Kaplan-Meier curves for PFS with size, quantity and times; F: Kaplan-Meier curves for PFS with size in repeat ablation.
- Citation: Gao SQ, Zhang BW, Zhao QY, Jiang TA. Repeat ablation and single-session ablation in patients with multiple colorectal cancer liver metastases after chemotherapy failure. World J Gastroenterol 2025; 31(43): 111494
- URL: https://www.wjgnet.com/1007-9327/full/v31/i43/111494.htm
- DOI: https://dx.doi.org/10.3748/wjg.v31.i43.111494


