©The Author(s) 2025.
World J Gastroenterol. Nov 7, 2025; 31(41): 110955
Published online Nov 7, 2025. doi: 10.3748/wjg.v31.i41.110955
Published online Nov 7, 2025. doi: 10.3748/wjg.v31.i41.110955
Figure 1 Circulating levels of growth differentiation factor 15.
A: Plasma growth differentiation factor 15 (GDF15) levels in healthy controls (healthy controls, n = 23), inflammatory bowel disease patients (inflammatory bowel disease, n = 39), and myocardial infarction patients (myocardial infarction, n = 19). Data are presented using Tukey’s boxplots; B: Plasma GDF15 levels in healthy controls (healthy controls, n = 23), Crohn’s disease patients (n = 21), and ulcerative colitis patients (n = 18). Data are presented using Tukey’s boxplots; C: Correlation between plasma GDF15 levels and colonic GDF15 gene expression (n = 21 pairs). aP < 0.05 and cP < 0.001. HC: Healthy controls; IBD: Inflammatory bowel disease; MI: Myocardial infarction; CD: Crohn’s disease; UC: Ulcerative colitis.
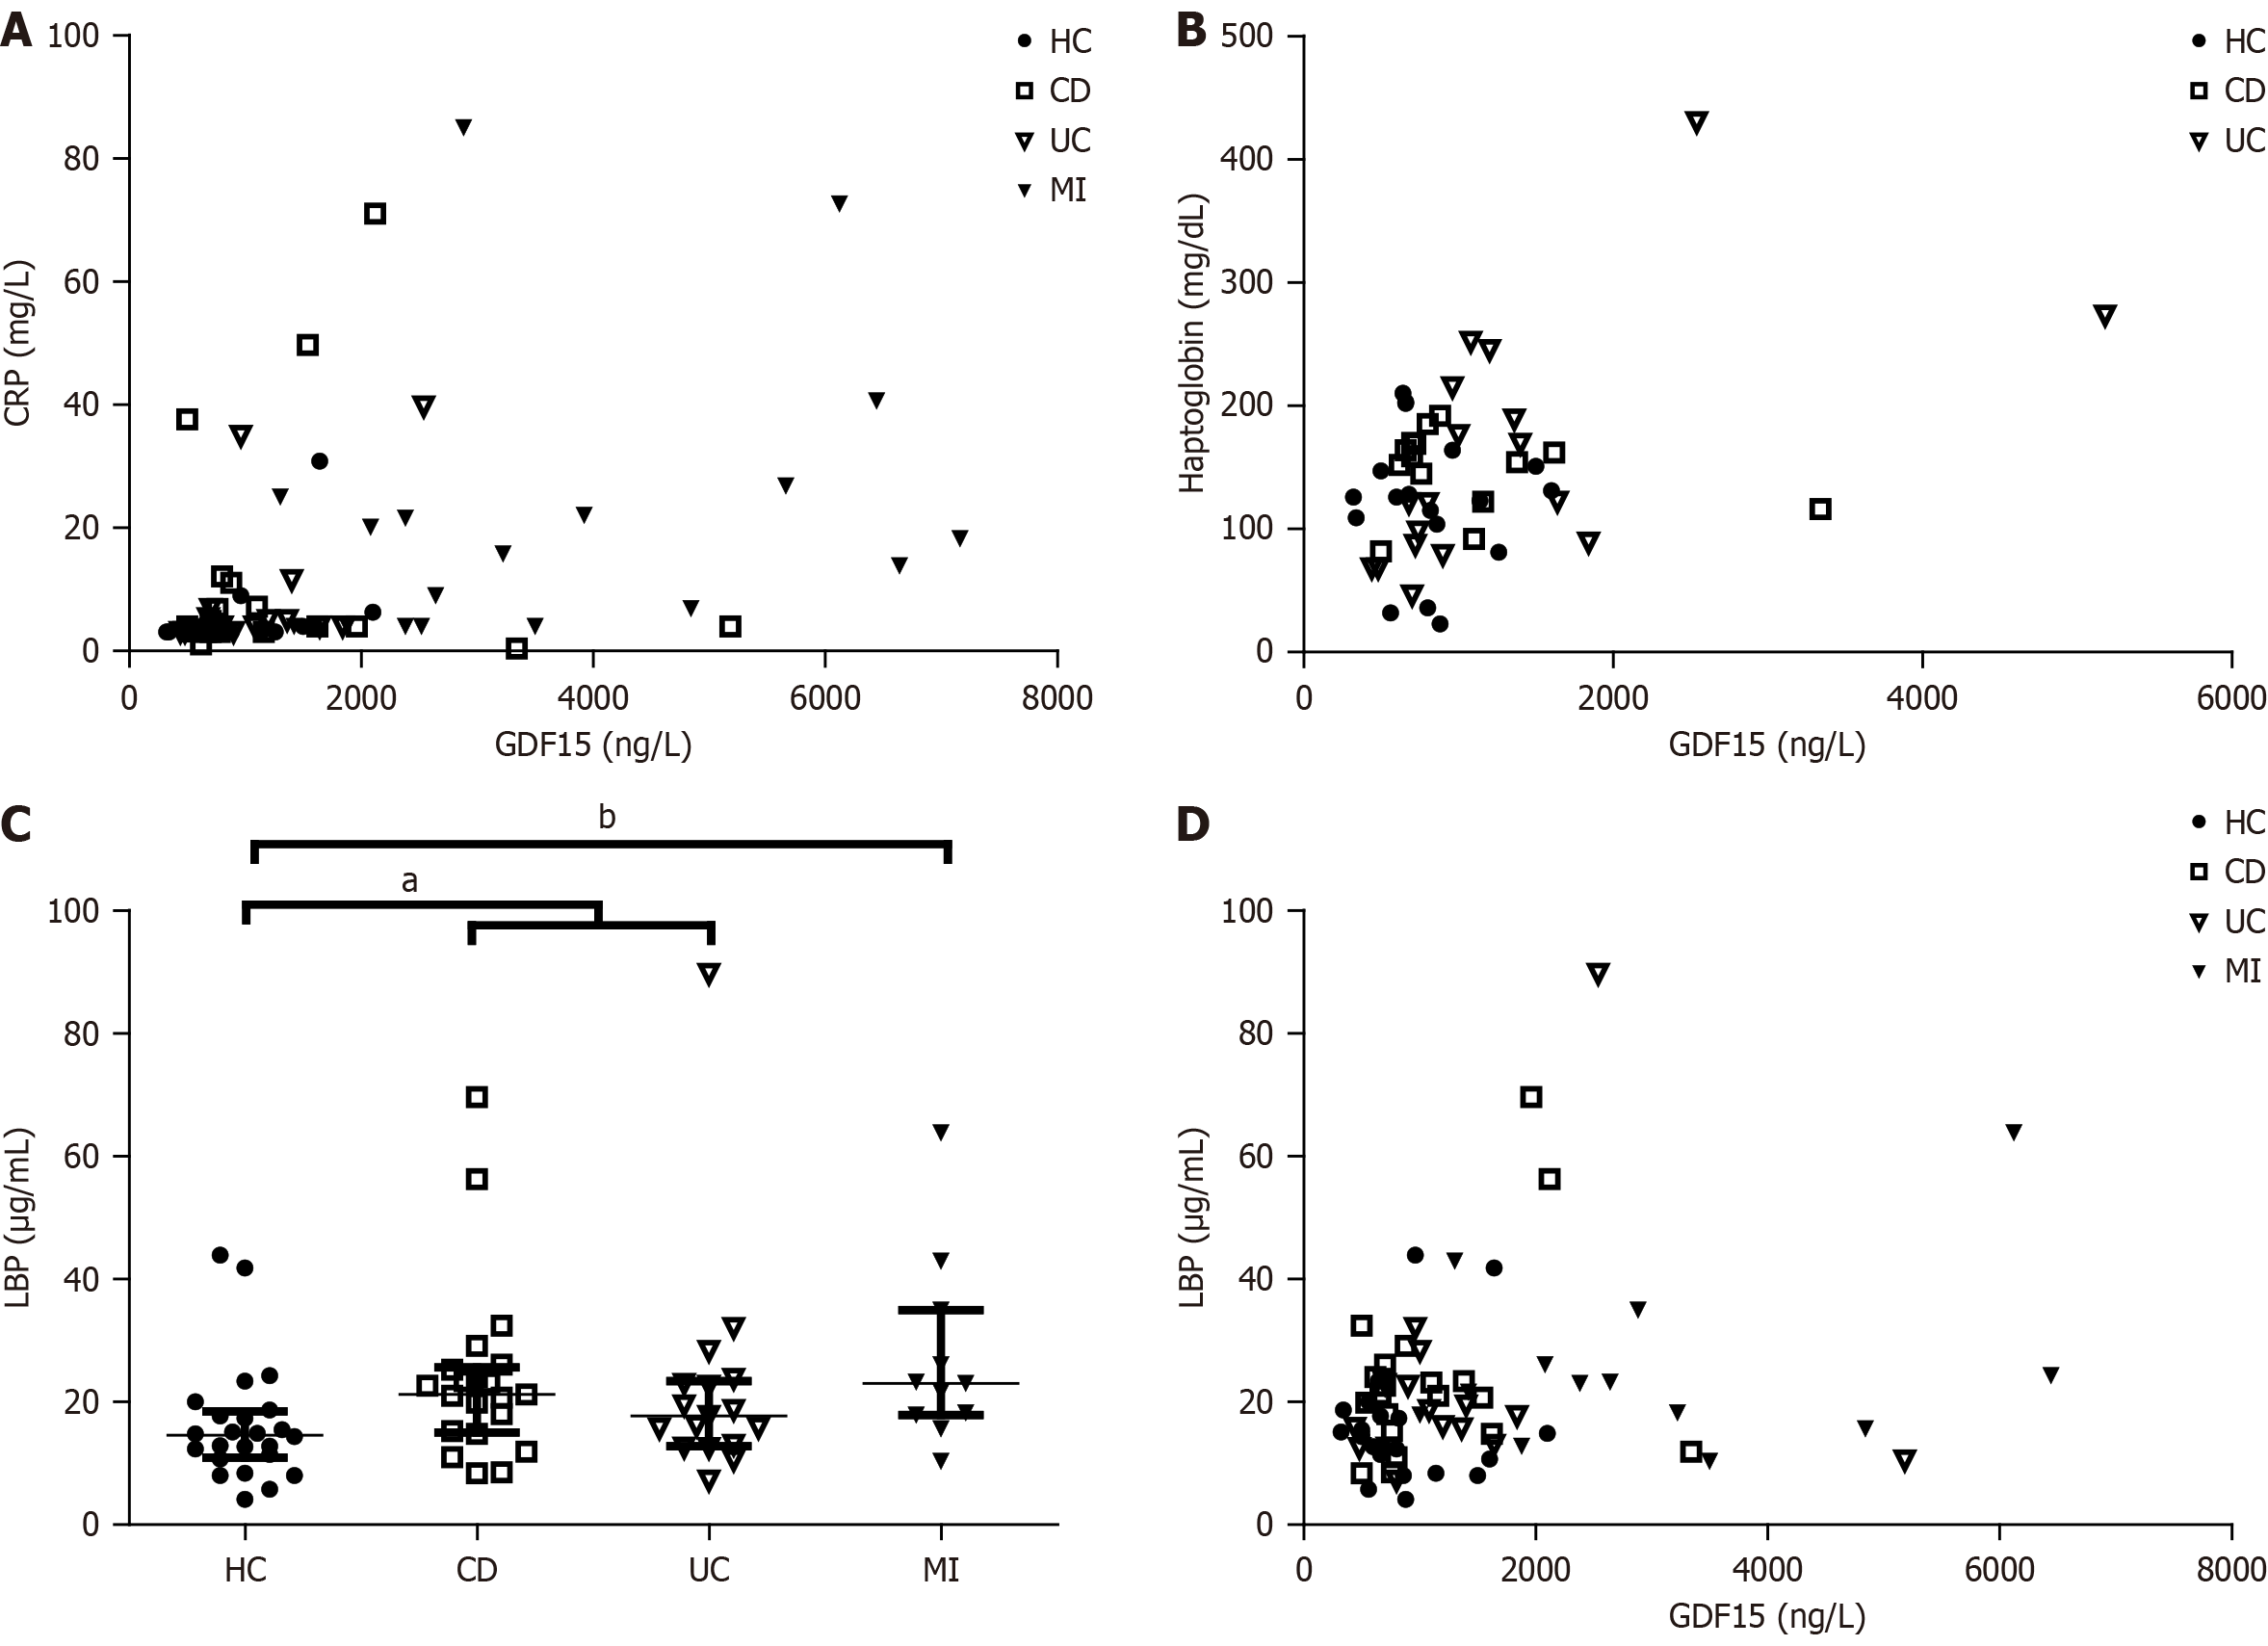
Figure 2 Correlation between circulating levels of growth differentiation factor 15 and blood markers.
A: Correlation between plasma levels of growth differentiation factor 15 (GDF15) and plasma levels of C-reactive protein. Sample size: Healthy controls (HC) = 23 pairs, Crohn’s disease patients (CD) = 21 pairs, ulcerative colitis patients (UC) = 15 pairs, myocardial infarction patients (MI) = 18 pairs; B: Correlation between plasma levels of GDF15 and plasma levels of haptoglobin. Sample size: HC = 18 pairs, CD = 14 pairs, UC = 18 pairs; C: Lipopolysaccharide-binding protein levels across different subject groups. Sample size: HC = 24, CD = 21, UC = 17, MI = 11; D: Correlation between plasma levels of GDF15 and lipopolysaccharide-binding protein. Sample size: HC = 22 pairs, CD = 20 pairs, UC = 17 pairs, MI = 13. aP < 0.05 in a Mann-Whitney test combining CD and UC patients. bP < 0.01 in a Mann-Whitney test. CRP: C-reactive protein; GDF: Growth differentiation factor; LBP: Lipopolysaccharide-binding protein.
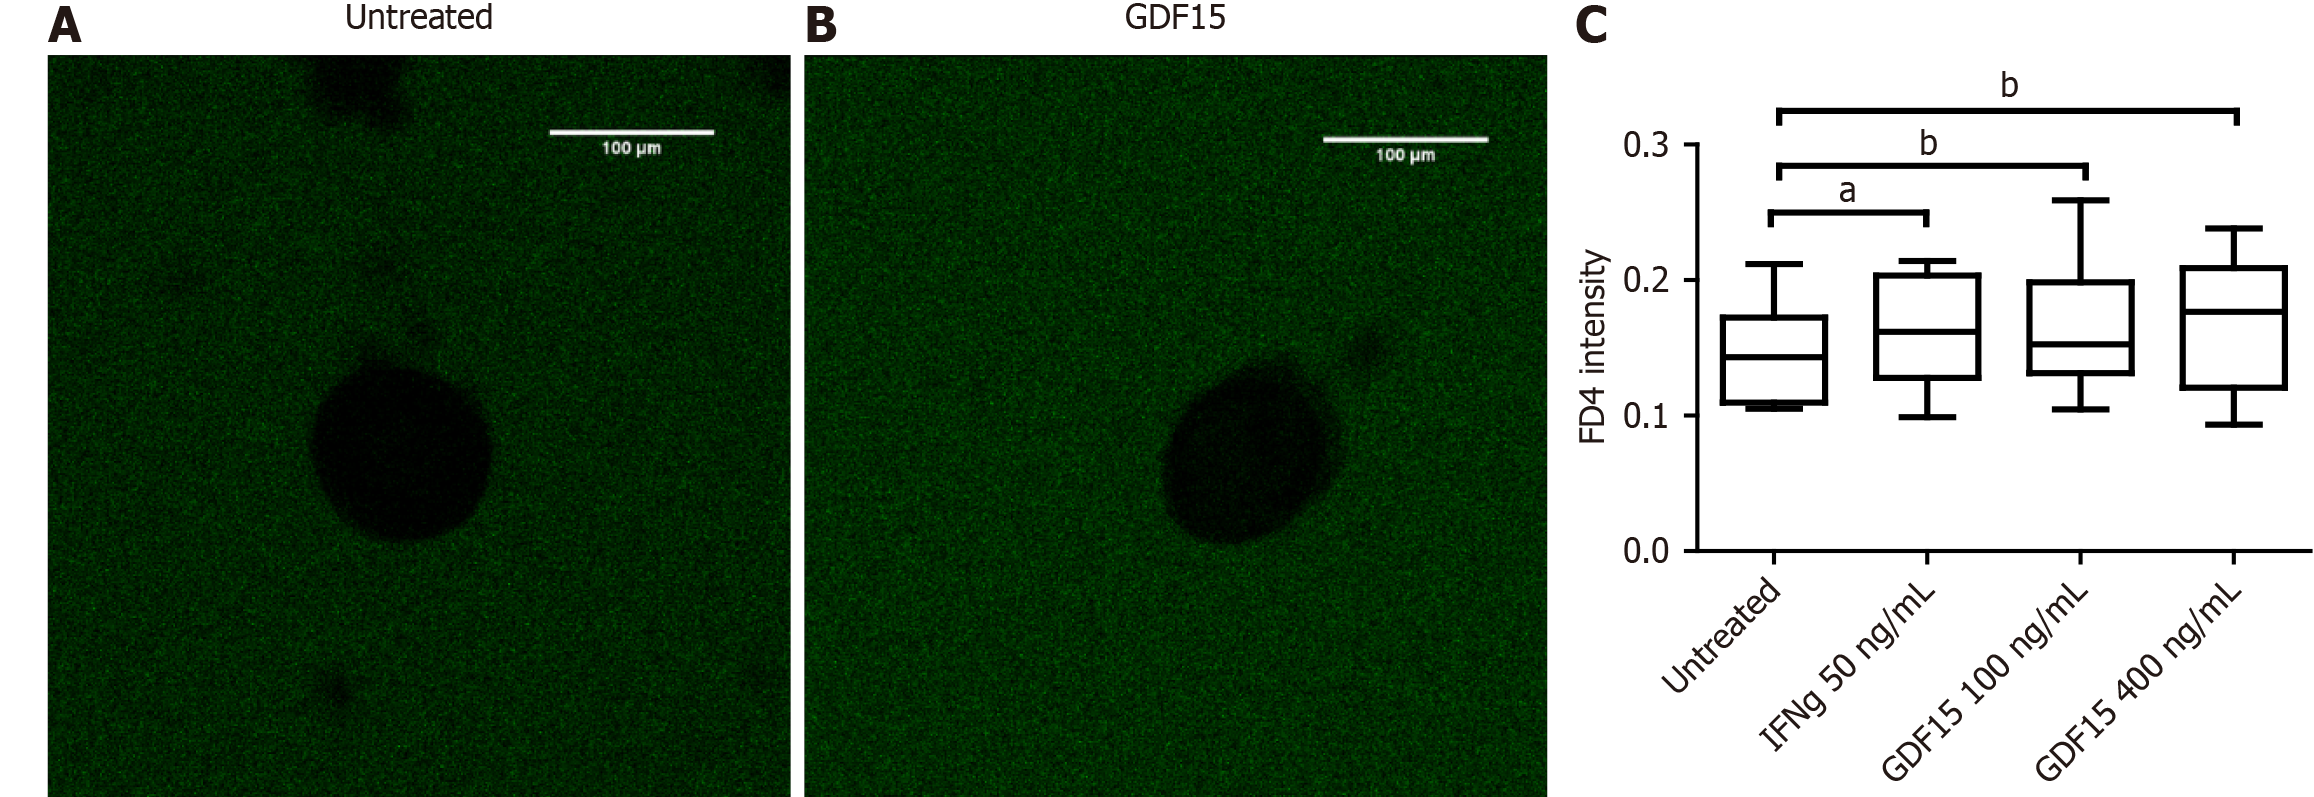
Figure 3 In vitro assessment of the effects of growth differentiation factor 15 on intestinal barrier permeability.
Colonic organoids were treated with fluorescein isothiocyanate-dextran 4k (FD4), and the relative FD4 intensity (ratio between the mean gray value inside the colonic organoid and the sum of the mean gray values inside and outside) was calculated for each organoid. A: Untreated colonic organoid (healthy control), relative FD4 intensity = 0.092; B: Growth differentiation factor 15-treated organoid (100 ng/mL), relative FD4 intensity = 0.163. Scale bar: 100 μm; C: Relative FD4 intensity in organoid lines under different conditions, presented using a Tukey’s box plot. Images were obtained with a Leica SP5 confocal microscope using a 10 × objective and analyzed in ImageJ. For each organoid line, ≥ 10 organoids from three different wells (≥ 30 total organoids) were analyzed per condition. aP < 0.05 and bP < 0.01, one-tailed paired t-test. GDF: Growth differentiation factor; FD4: Fluorescein isothiocyanate-dextran 4k; IFNg: Interferon gamma.
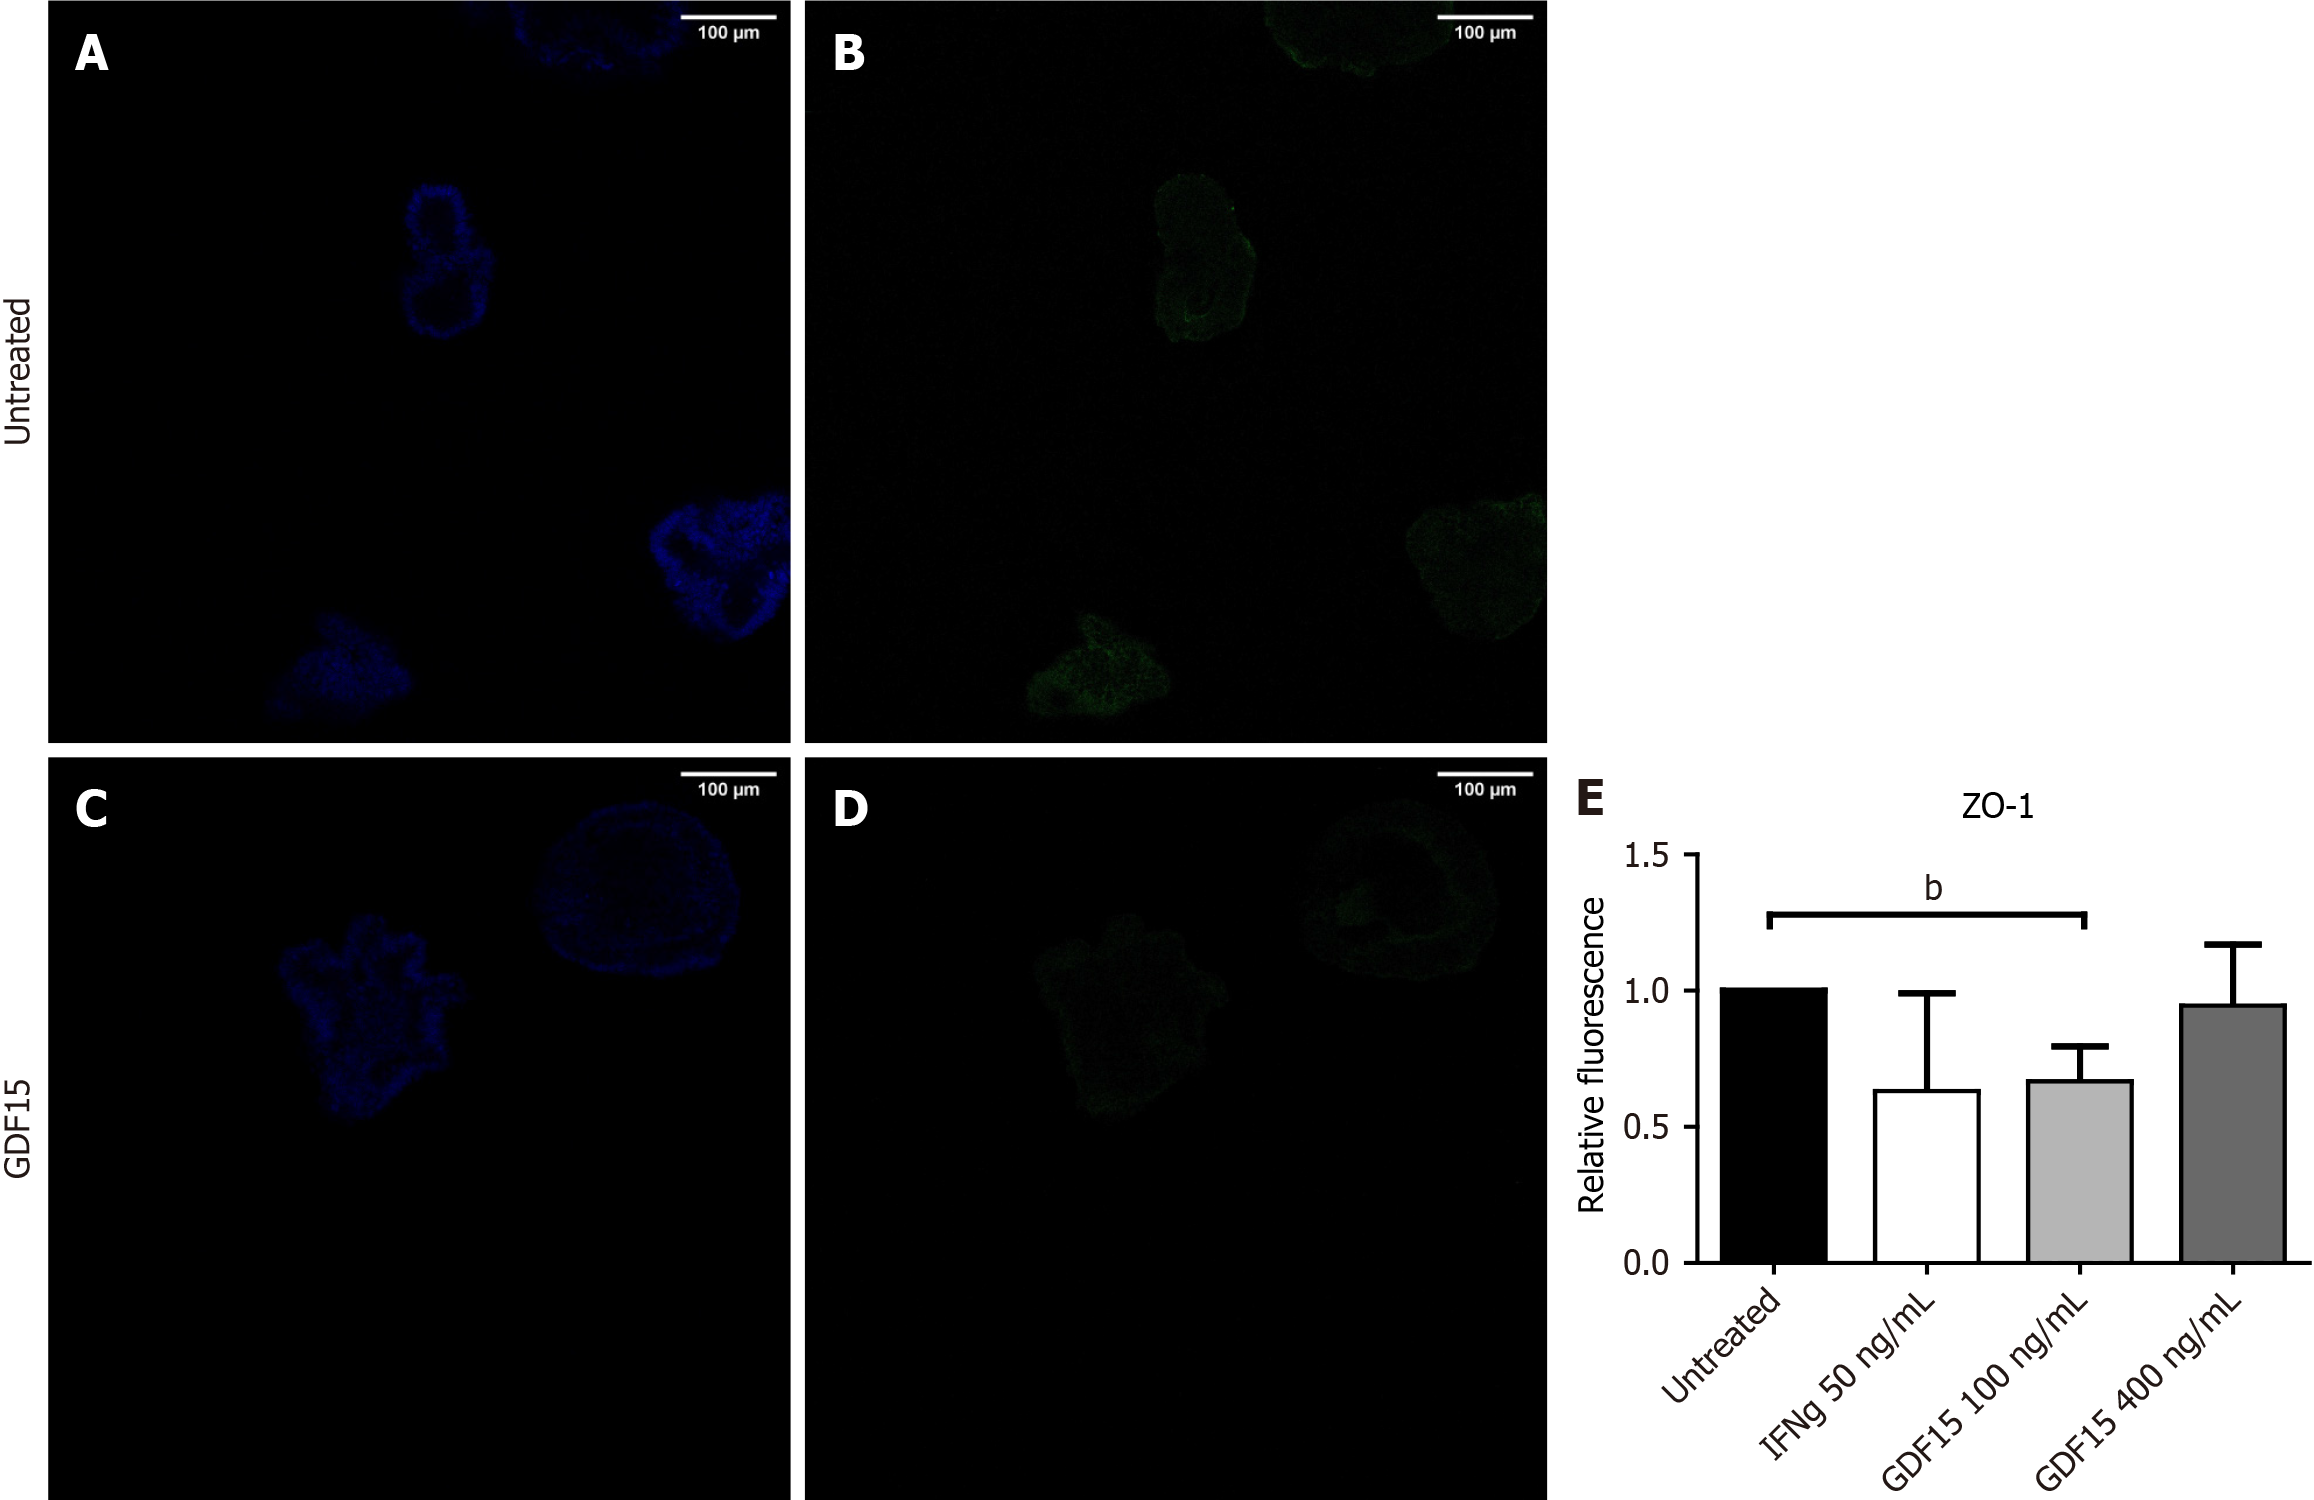
Figure 4 In vitro assessment of the effects of growth differentiation factor 15 on intestinal barrier tight junctions.
A and B: Representative images of an untreated organoid stained with 4’-6-diamidino-2-phenylindole (DAPI) (A) and zonula occludens (ZO)-1 (B); C and D: Representative images of an organoid from the same line, treated with 100 ng/mL of GDF15, stained with DAPI (C) and ZO-1 (D). Scale bar: 100 μm; E: Relative ZO-1 fluorescence values normalized to DAPI. Data are presented as mean ± SD relative to the untreated organoid. Images were obtained using a Leica SP5 confocal microscope with a 20 × objective and analyzed in ImageJ. For each organoid line, ≥ three organoids from three different wells were analyzed. bP < 0.001, one-tailed paired t-test. GDF: Growth differentiation factor; ZO-1: Zonula occludens-1; IFNg: Interferon gamma.
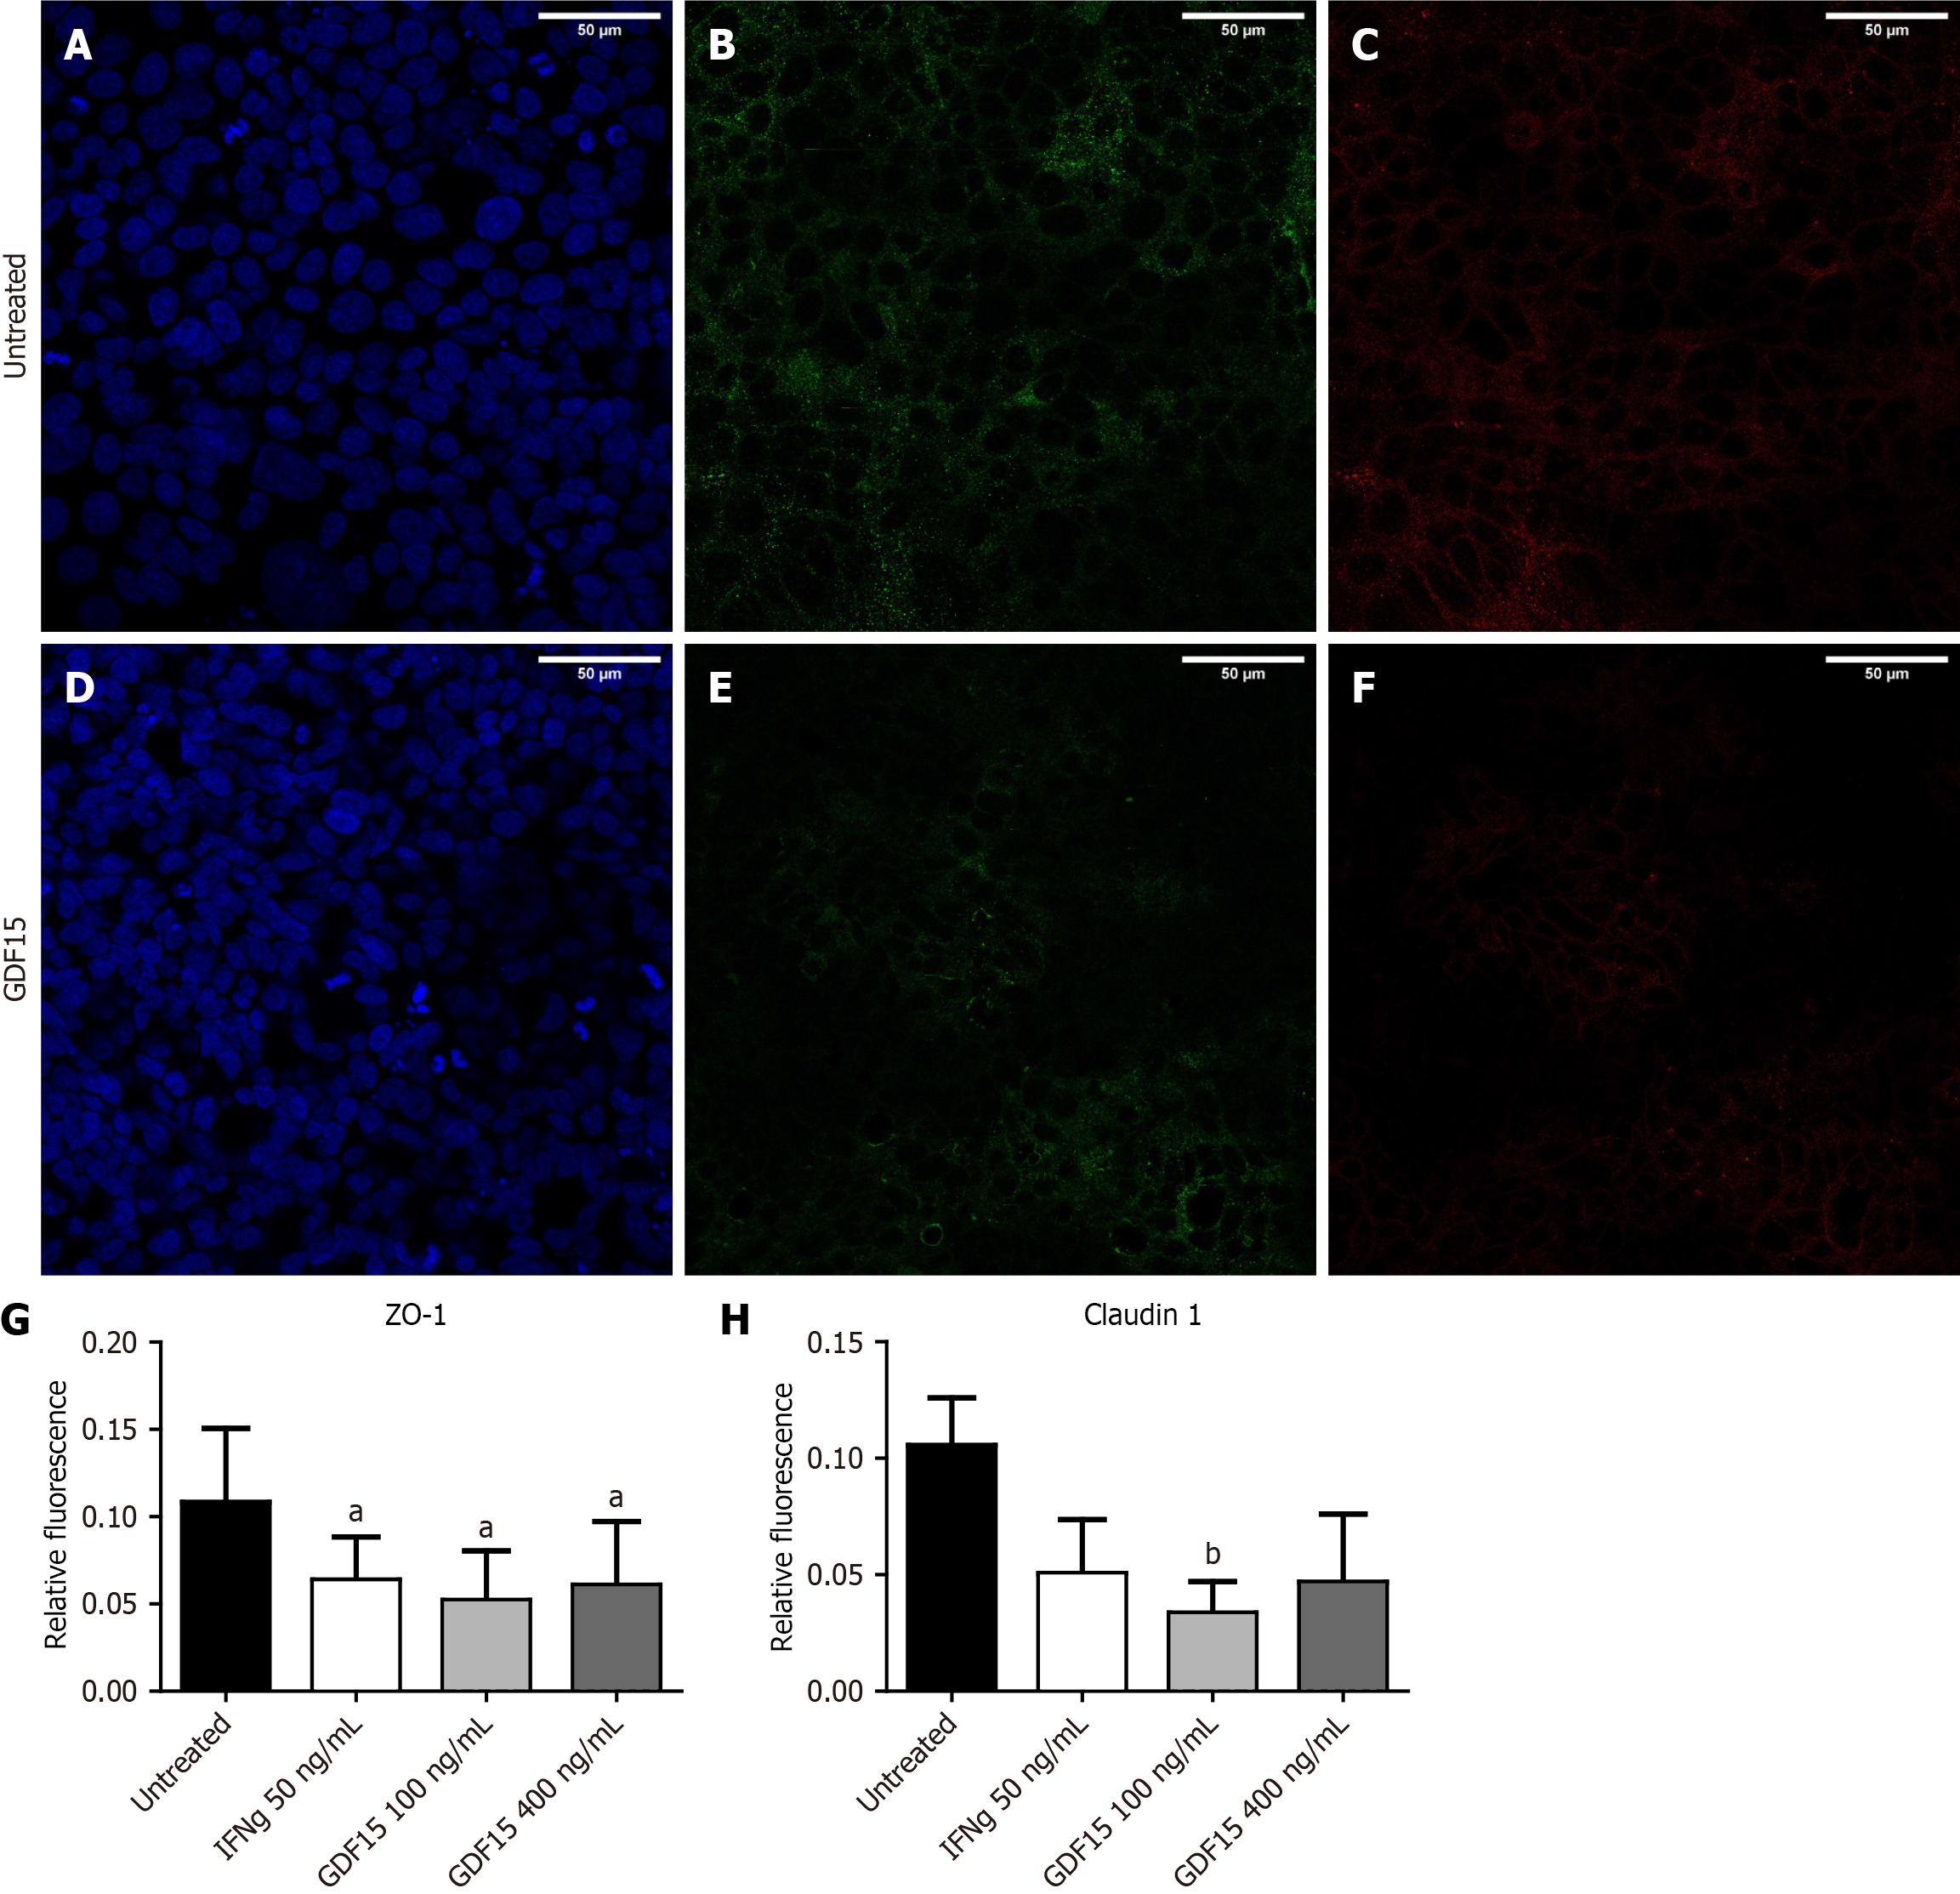
Figure 5 Zonula occludens-1 and claudin 1 expression in T84 cells.
A-C: Representative field of T84 cells stained with 4’-6-diamidino-2-phenylindole (DAPI) (A), zonula occludens (ZO)-1 (B), and Claudin 1 (C); D-F: Representative field of T84 cells treated with 100 ng/mL of growth differentiation factor 15, stained with DAPI (D), ZO-1 (E), and claudin 1 (F). Scale bar: 100 μm; G and H: Relative ZO-1 and claudin 1 fluorescence values, respectively, normalized to DAPI. Data are presented as mean ± SD of relative fluorescence. Images were obtained using a Leica SP5 confocal microscope with a 40 × objective and 1.5 zoom, and analyzed in ImageJ. aP < 0.05 and bP < 0.01, one-tailed paired t-test. GDF15: Growth differentiation factor 15; ZO-1: Zonula occludens-1; IFNg: Interferon gamma.
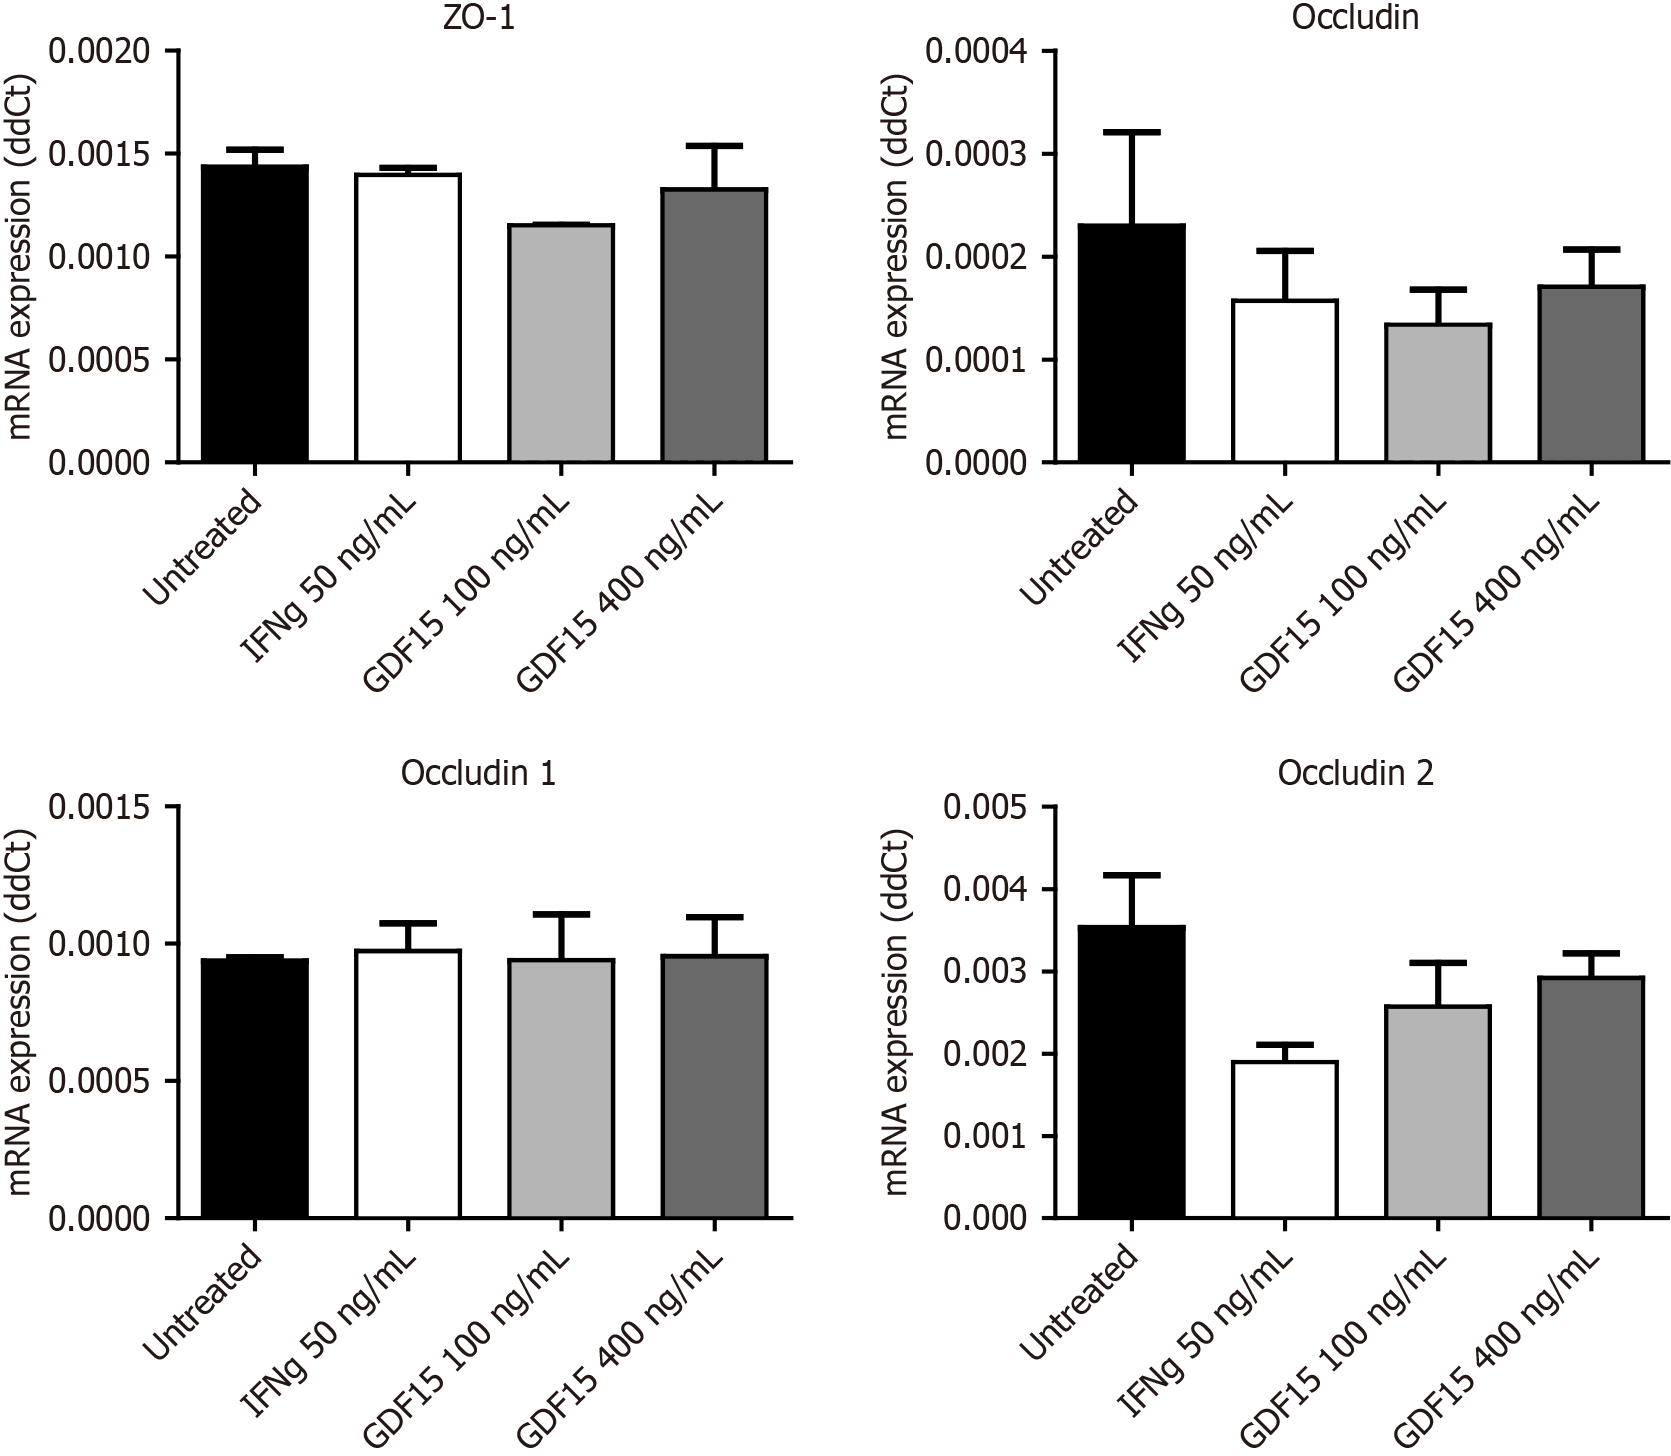
Figure 6 Messenger RNA levels of intestinal barrier markers.
Data are presented as mean ± SD of the ΔCt values from three experiments. Within each experiment, conditions were run in triplicate, and each sample was run in duplicate. ZO-1: Zonula occludens-1; IFNg: Interferon gamma; GDF15: Growth differentiation factor 15.
-
Citation: Ruiz-Malagón AJ, Herraiz-Vilela M, Serrano-Pino R, García-Ávila P,
Díaz- Suárez L, Carmona-Segovia AD, Becerra-Munoz VM, Jiménez-Navarro M, Arranz-Salas I, López-Villodres JA, Fernández-Castañer A, Gutiérrez-Martínez F, Rodríguez-González FJ, Camargo-Camero R, Alcaín-Martínez G, Rodríguez-Díaz C, García-Fuentes E, Sánchez-Quintero MJ, López-Gómez C. Growth differentiation factor 15 alters intestinal barrier and increases permeability: A new molecular target in inflammatory bowel disease. World J Gastroenterol 2025; 31(41): 110955 - URL: https://www.wjgnet.com/1007-9327/full/v31/i41/110955.htm
- DOI: https://dx.doi.org/10.3748/wjg.v31.i41.110955


