Copyright
©The Author(s) 2025.
World J Gastroenterol. Oct 28, 2025; 31(40): 112033
Published online Oct 28, 2025. doi: 10.3748/wjg.v31.i40.112033
Published online Oct 28, 2025. doi: 10.3748/wjg.v31.i40.112033
Figure 1 Representative images of stigmata of recent hemorrhage in colonic diverticular bleeding.
A: Active bleeding: Spurting or oozing blood observed from a diverticulum; B: Non-bleeding visible vessel: A clearly exposed vessel within a diverticulum without active bleeding; C: Adherent clot: A clot covering a diverticulum that reveals either active bleeding or a visible vessel upon removal.
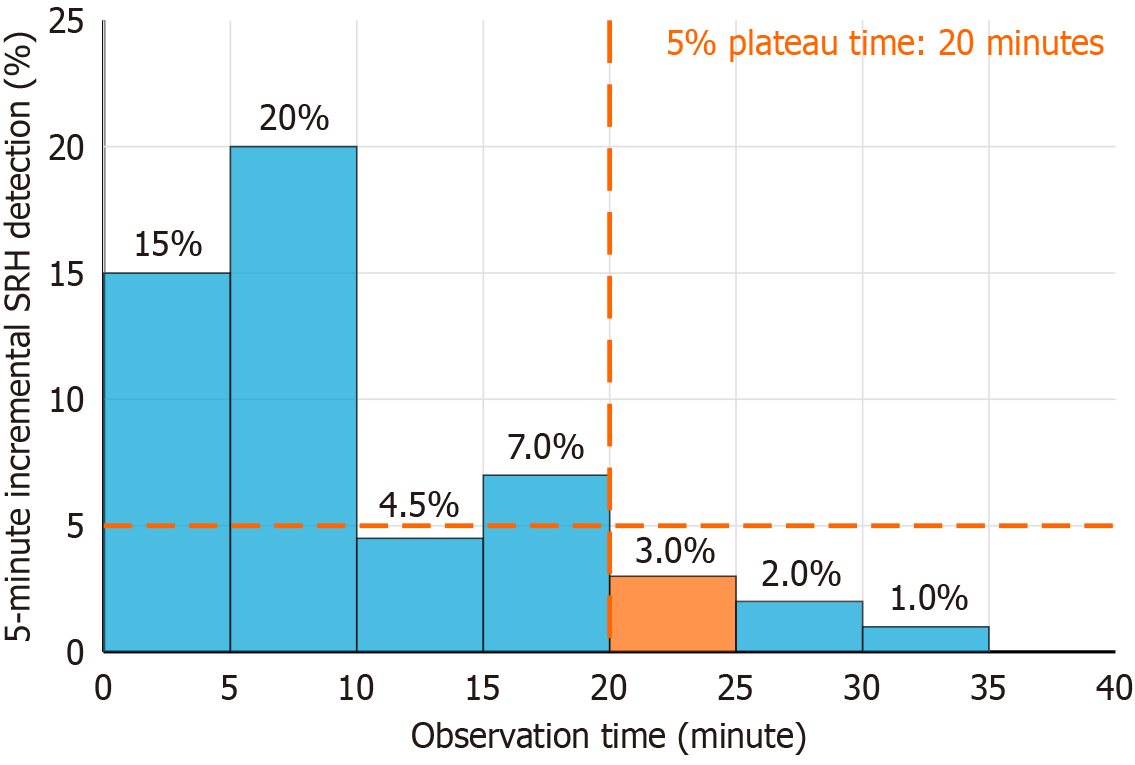
Figure 2 Concept of 5% plateau time.
The incremental stigmata of recent hemorrhage detection rates are assessed at 5-minute intervals. The 5% plateau time is defined as the point at which the incremental detection rate consistently fell below 5%. SRH: Stigmata of recent hemorrhage.
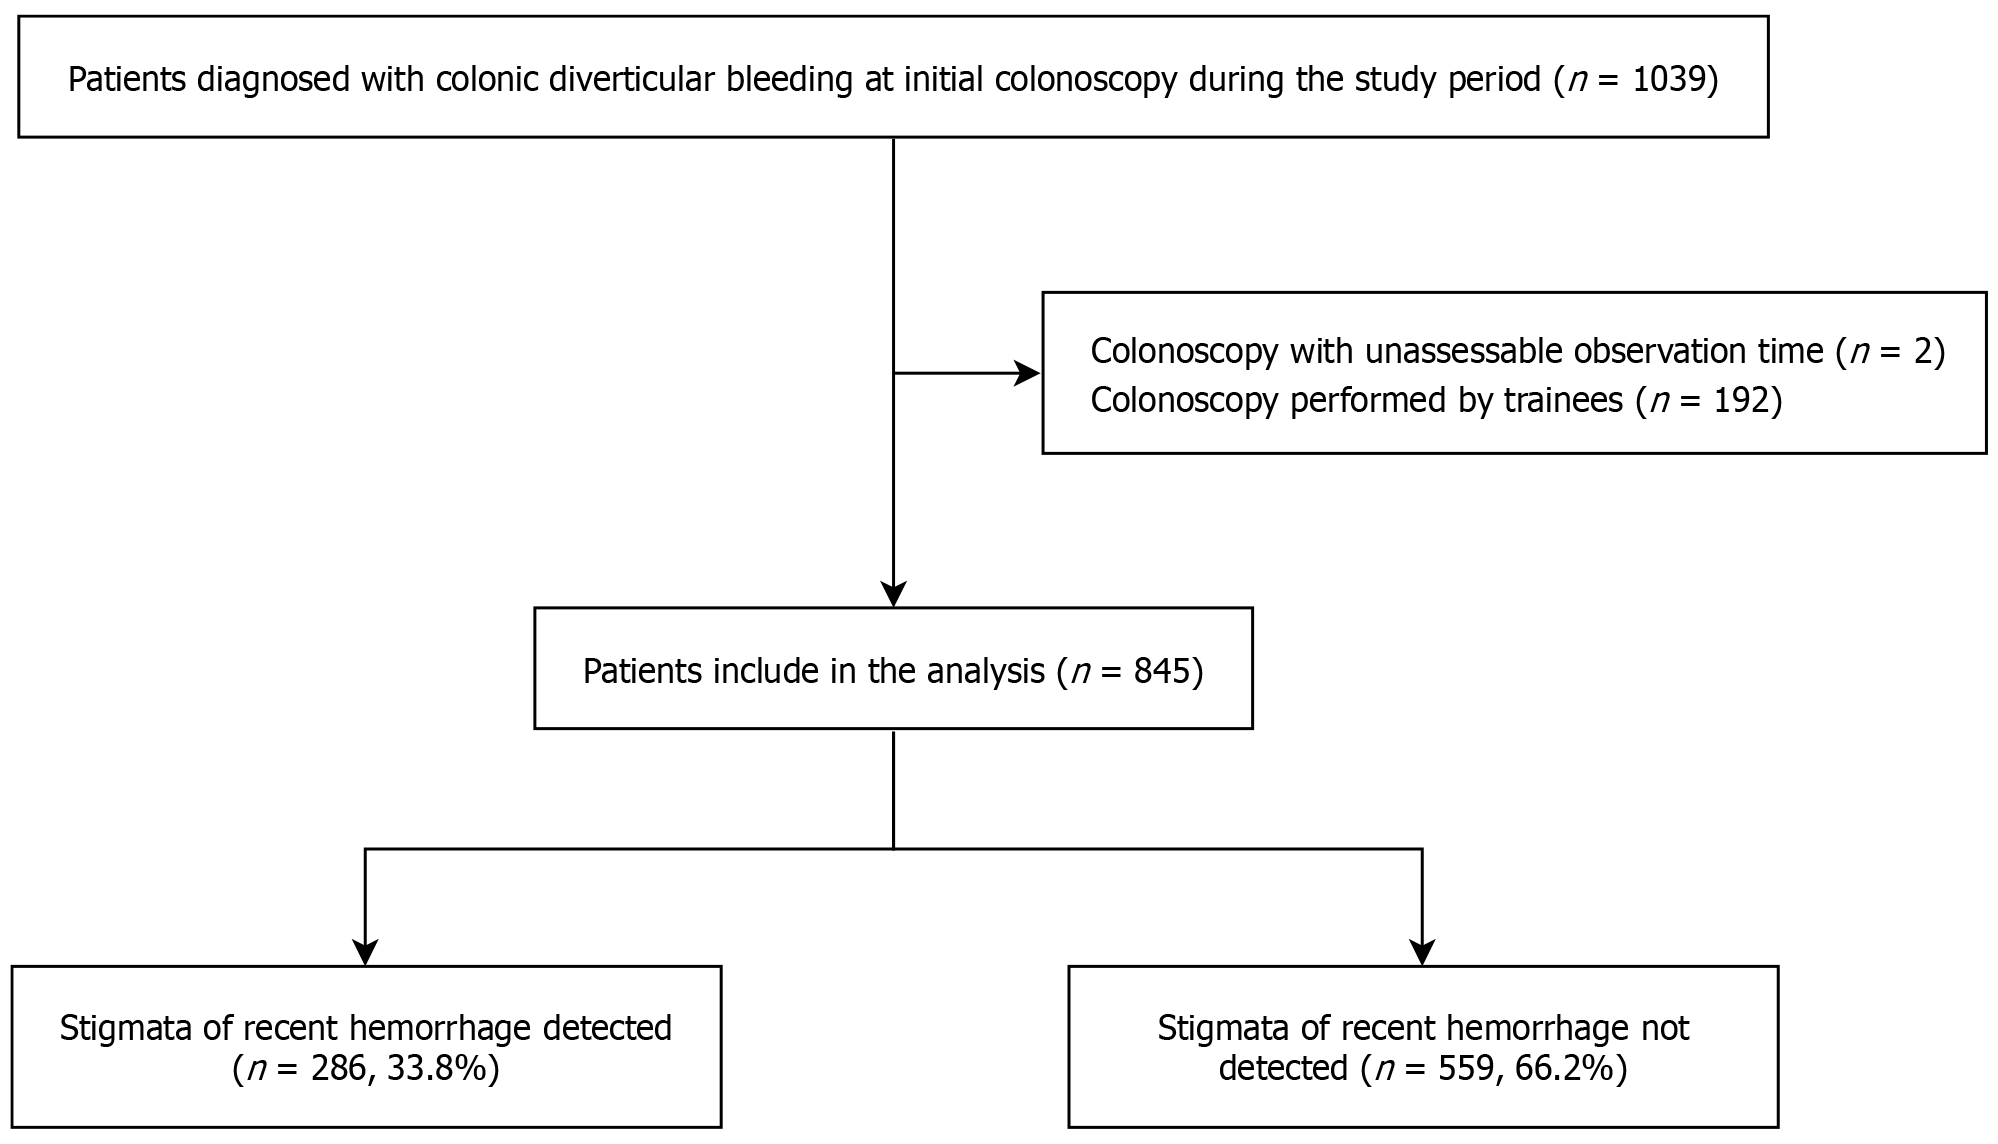
Figure 3 Patient flow diagram of the study.
A total of 1039 patients were diagnosed with colonic diverticular bleeding. Finally, 845 patients were included in the analysis.
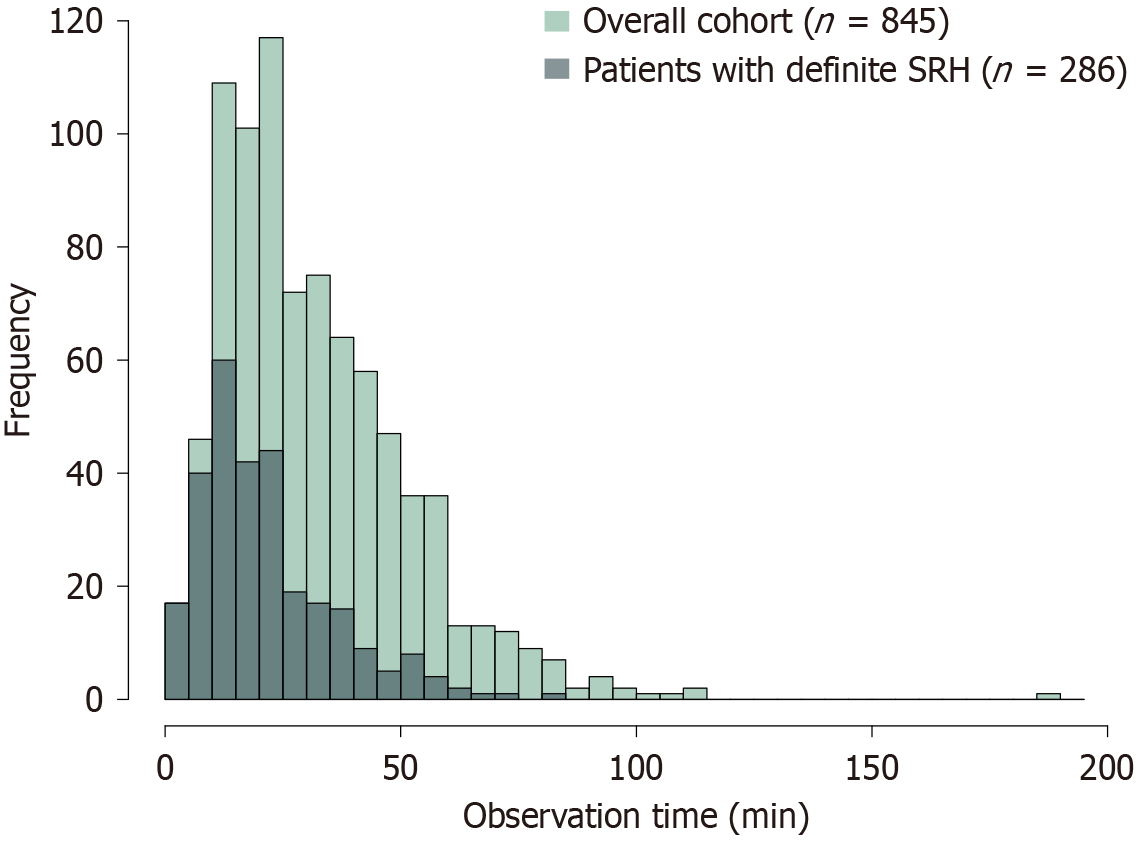
Figure 4 Distribution of observation times during colonoscopy.
The overall cohort (n = 845) is shown in light green, and patients with definite stigmata of recent hemorrhage (SRH) (n = 286) are shown in dark green. Observation time includes insertion time but excludes therapeutic intervention time in definite SRH cases. SRH: Stigmata of recent hemorrhage.
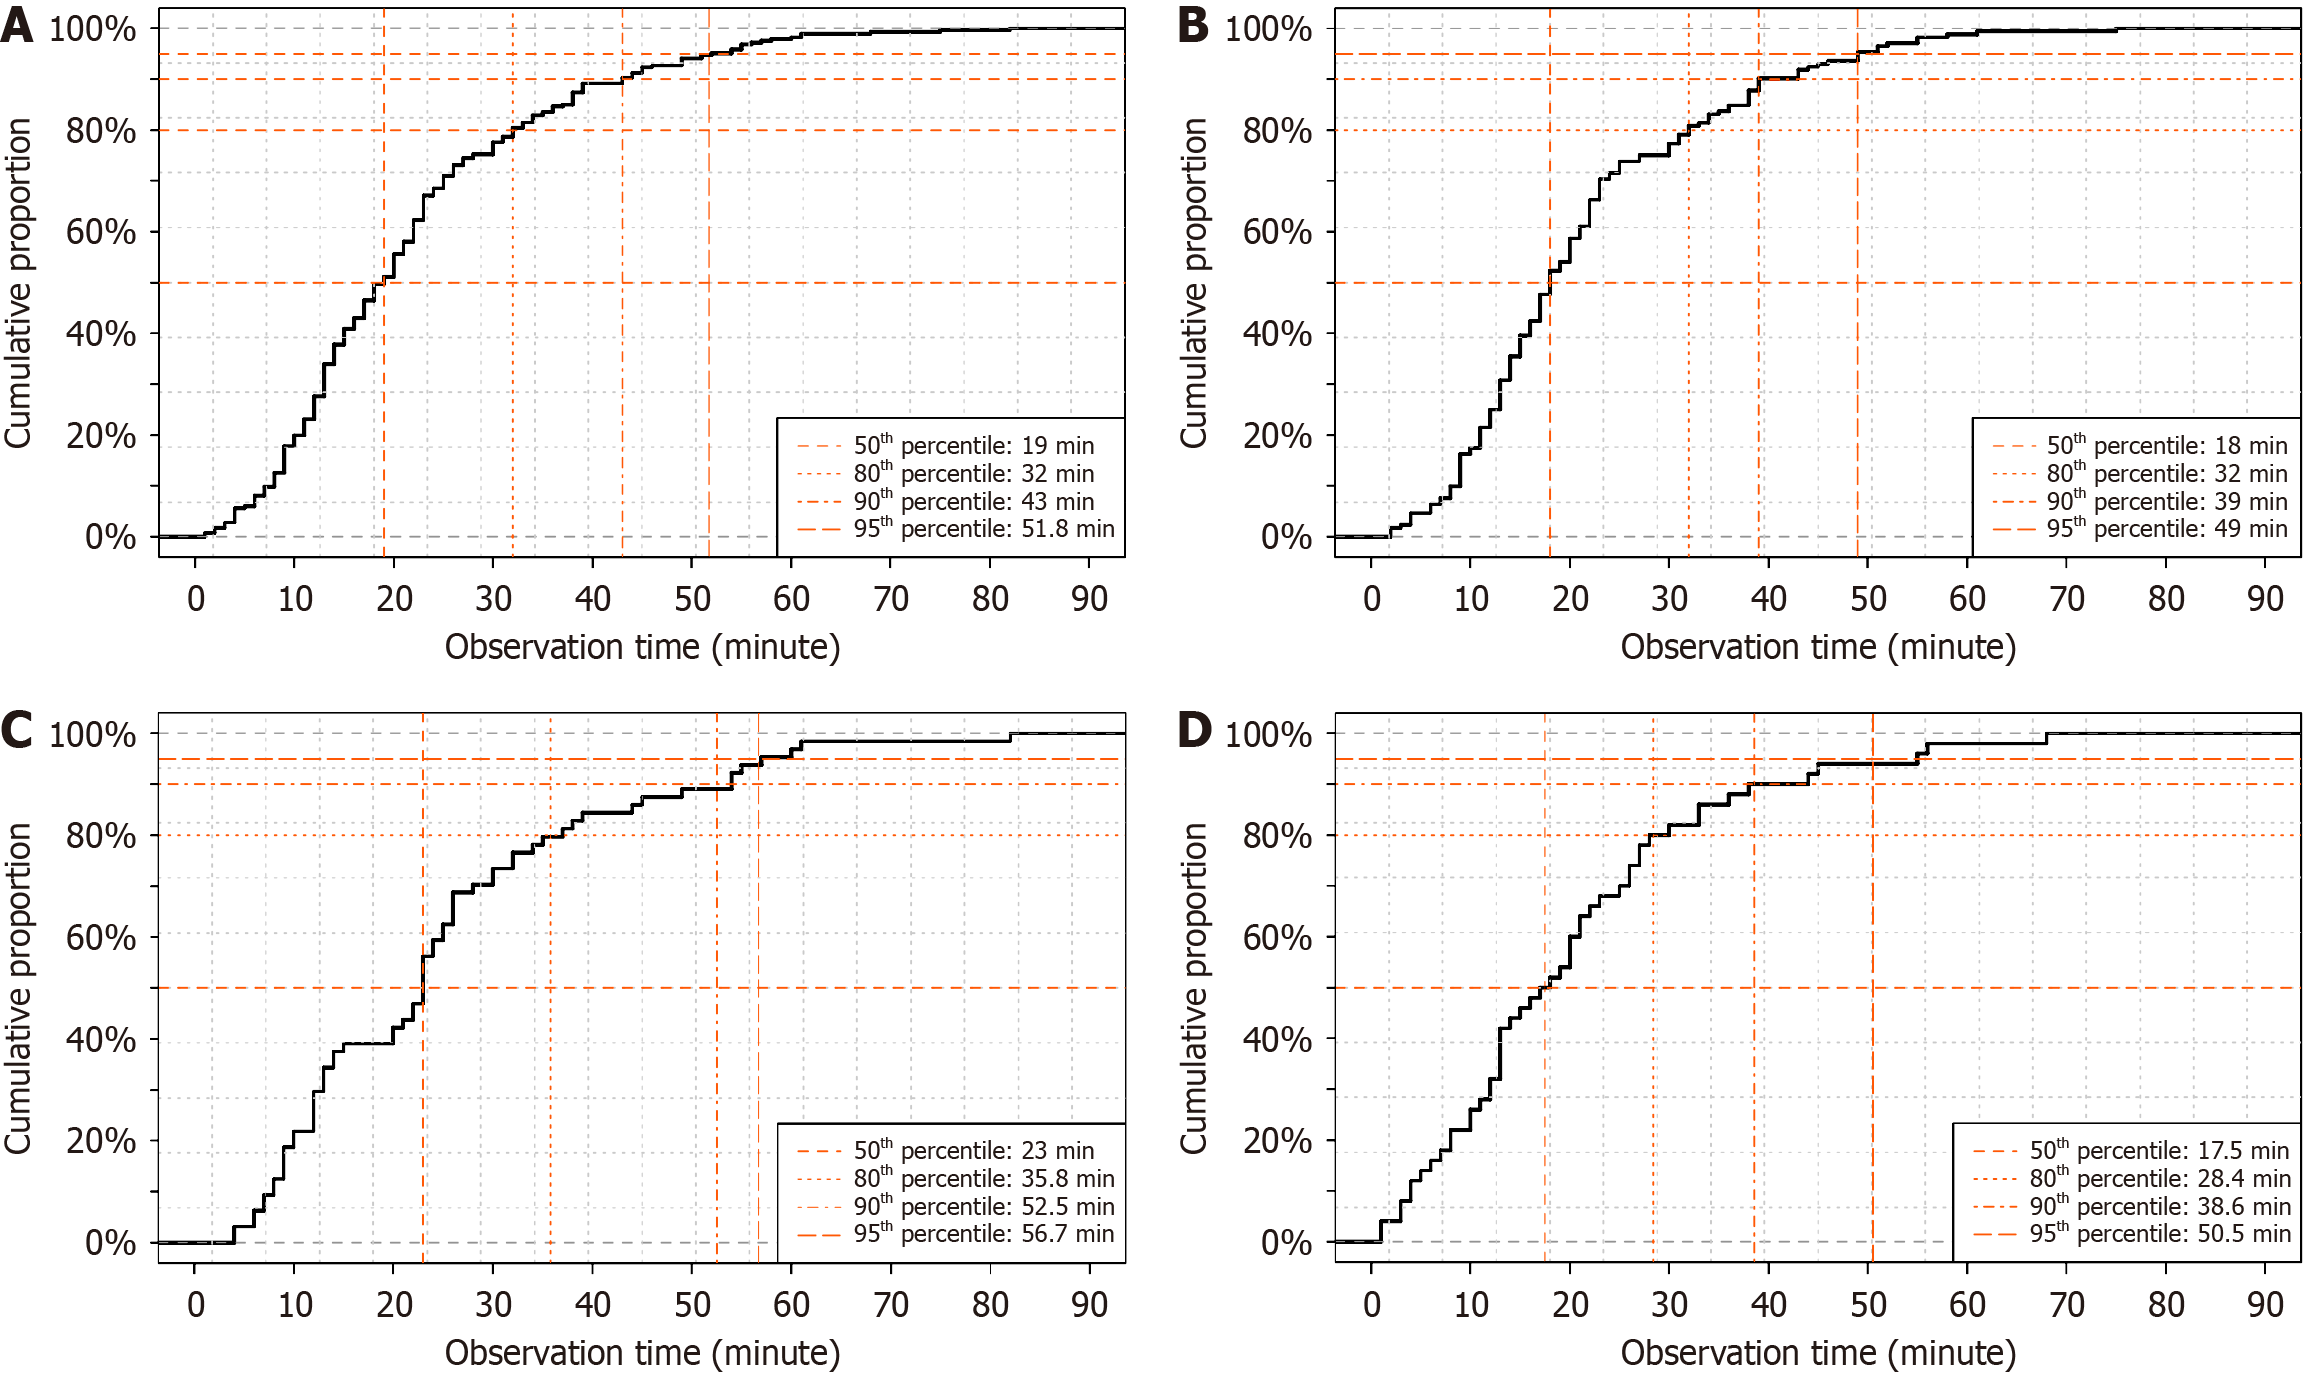
Figure 5 Cumulative stigmata of recent hemorrhage detection curves for each group.
A: Overall; B: No extravasation; C: Right-sided extravasation; D: Left-sided extravasation. Dashed lines represent the time points at which 50%, 80%, 90%, and 95% of stigmata of recent hemorrhage cases were detected.
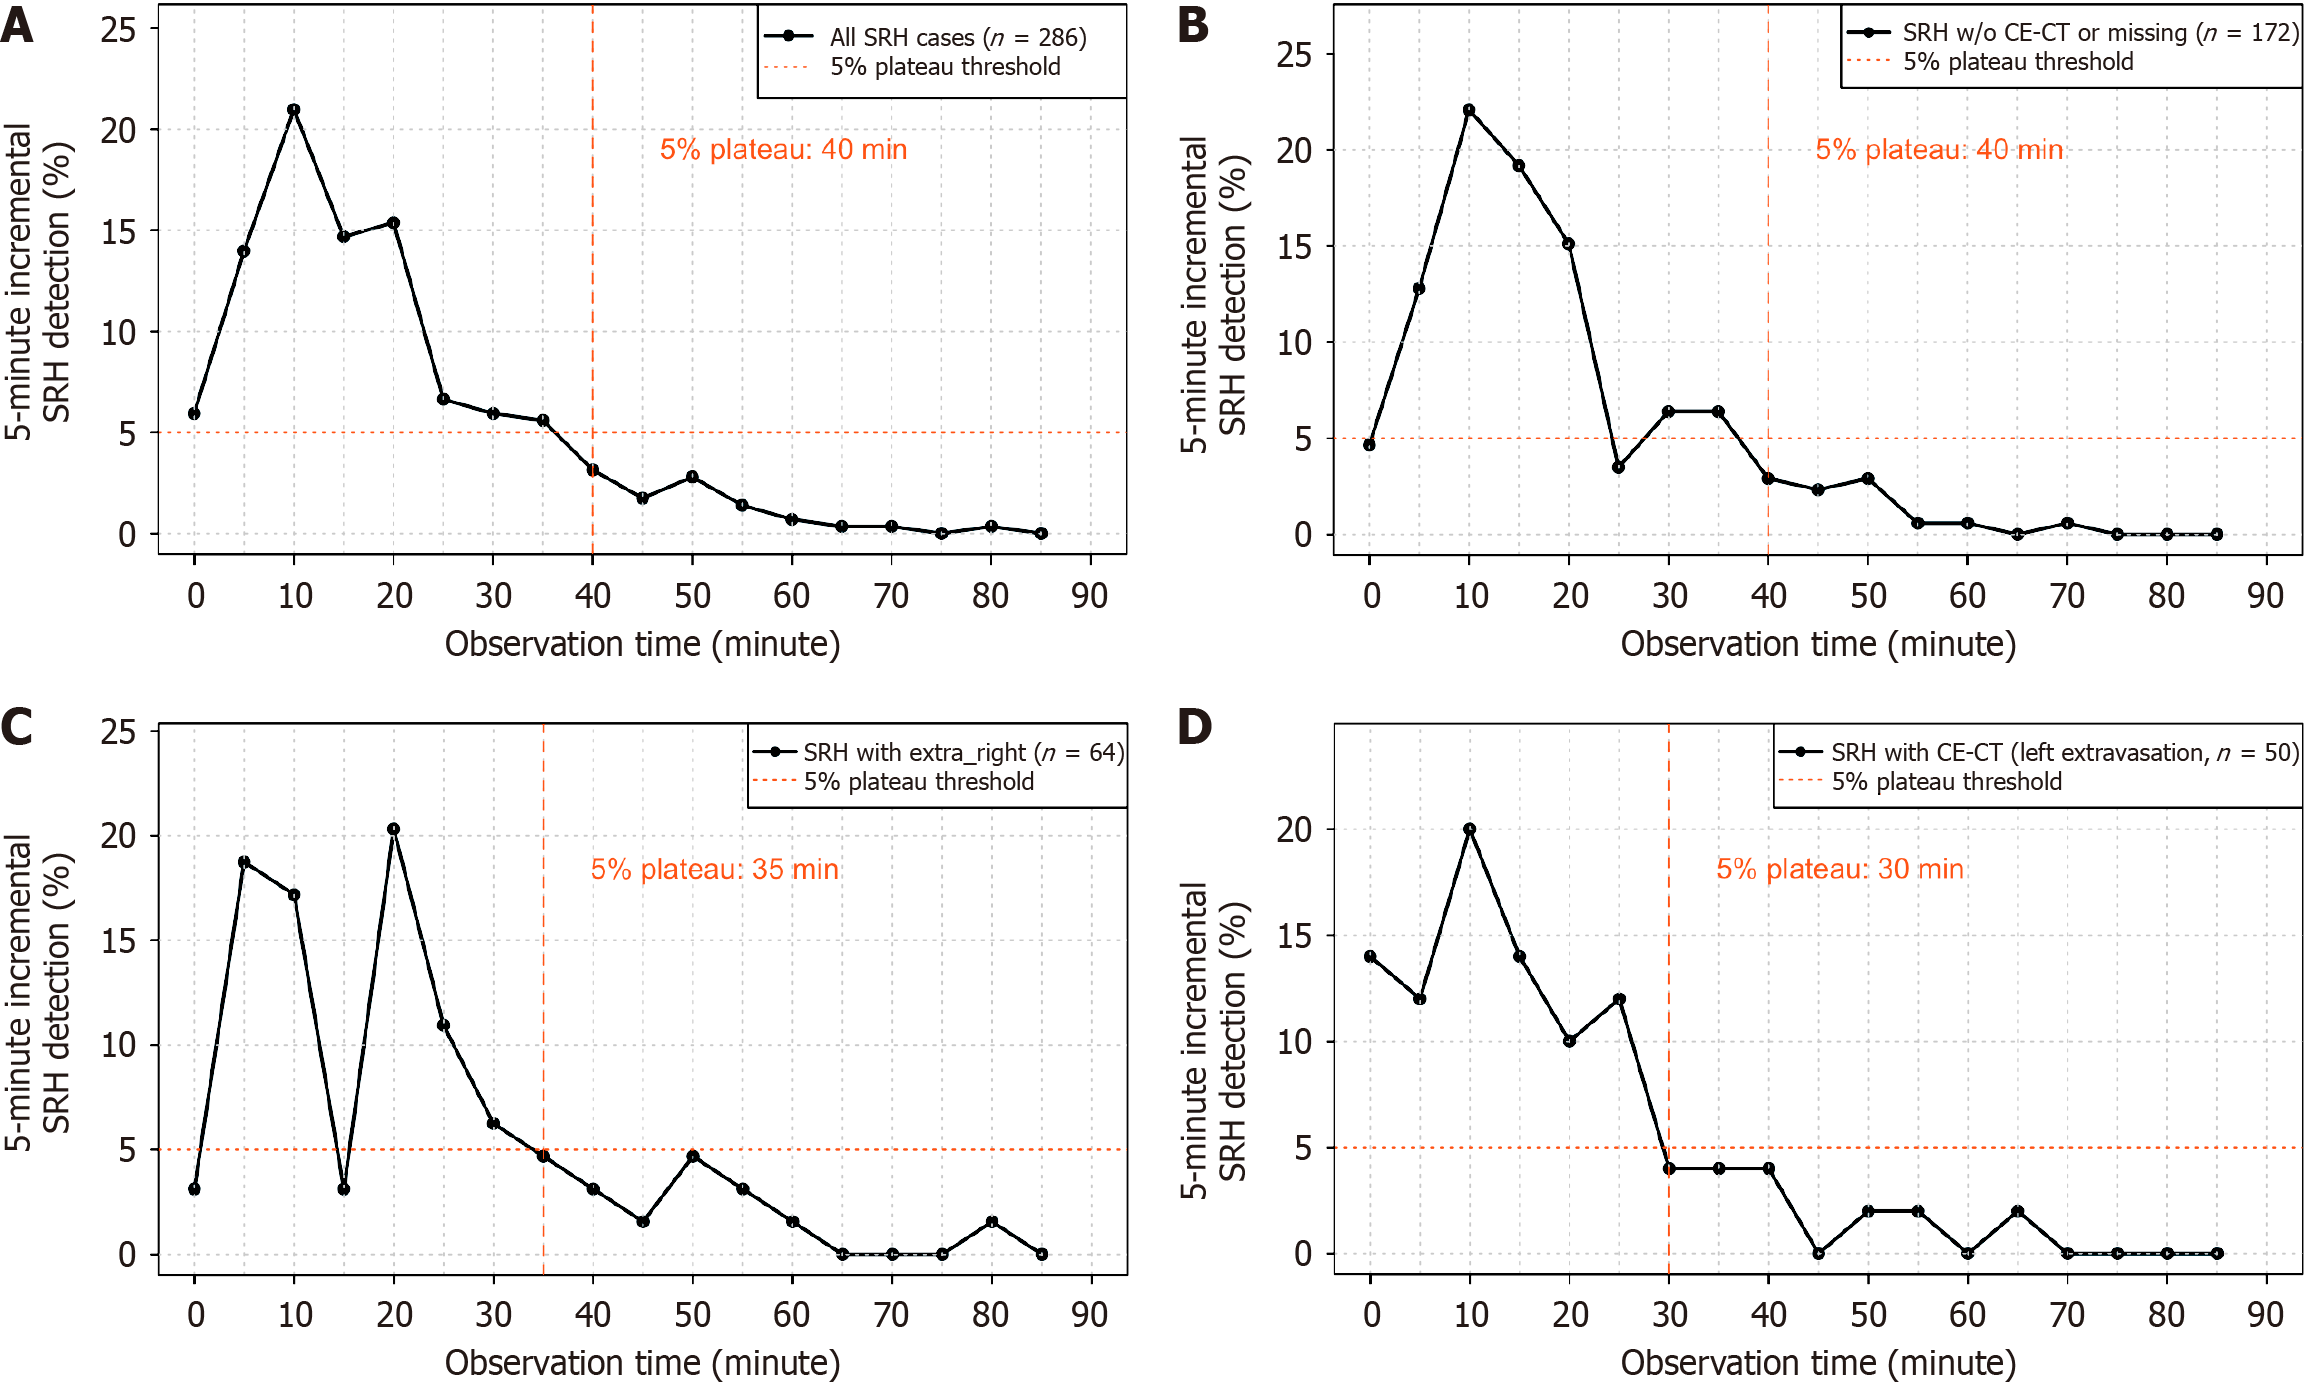
Figure 6 Stigmata of recent hemorrhage detection trends per 5-minute interval.
A: Overall; B: No extravasation; C: Right-sided extravasation; D: Left-sided extravasation. The 5% plateau time was defined as the time point at which the incremental detection rate consistently fell below 5% per 5-minute interval. Vertical dashed lines indicate the threshold. SRH: Stigmata of recent hemorrhage; CE-CT: Contrast enhanced computed tomography.
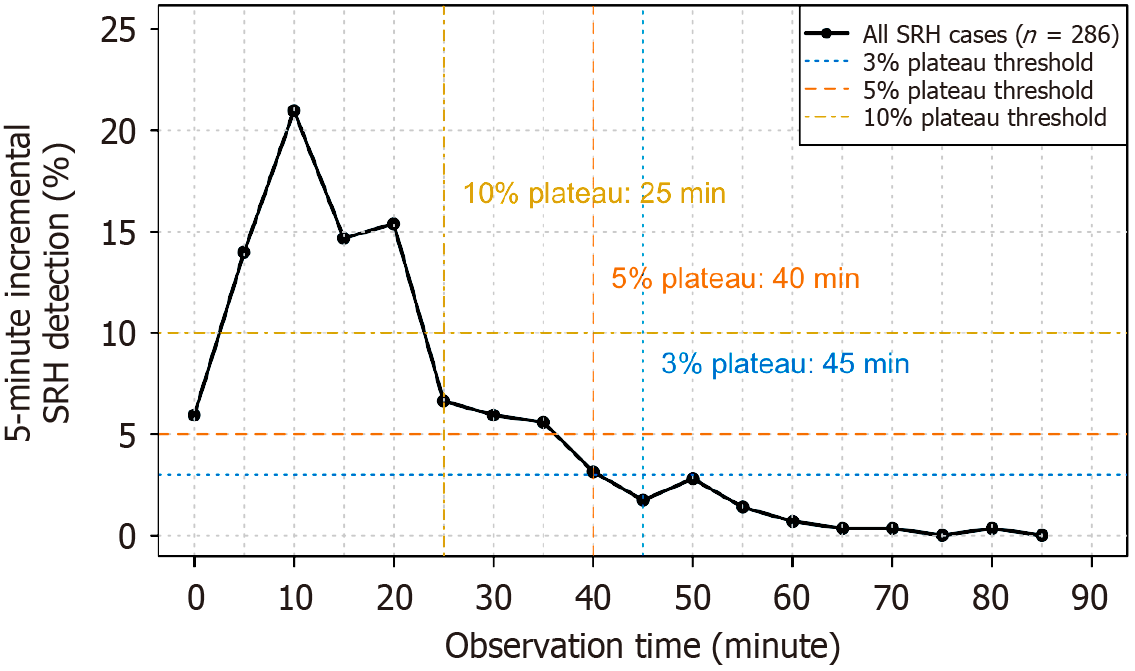
Figure 7 Sensitivity analysis of incremental stigmata of recent hemorrhage detection using alternative plateau thresholds.
The horizontal dashed lines indicate the thresholds of 3%, 5%, and 10%, and the vertical dashed lines mark the corresponding plateau times. SRH: Stigmata of recent hemorrhage.
- Citation: Ichita C, Goto T, Nishino T, Nakaya S, Shimizu S. Minimum colonoscopy observation time for colonic diverticular bleeding: A new benchmark based on the 5% plateau time. World J Gastroenterol 2025; 31(40): 112033
- URL: https://www.wjgnet.com/1007-9327/full/v31/i40/112033.htm
- DOI: https://dx.doi.org/10.3748/wjg.v31.i40.112033


