Copyright
©The Author(s) 2025.
World J Gastroenterol. Oct 21, 2025; 31(39): 110115
Published online Oct 21, 2025. doi: 10.3748/wjg.v31.i39.110115
Published online Oct 21, 2025. doi: 10.3748/wjg.v31.i39.110115
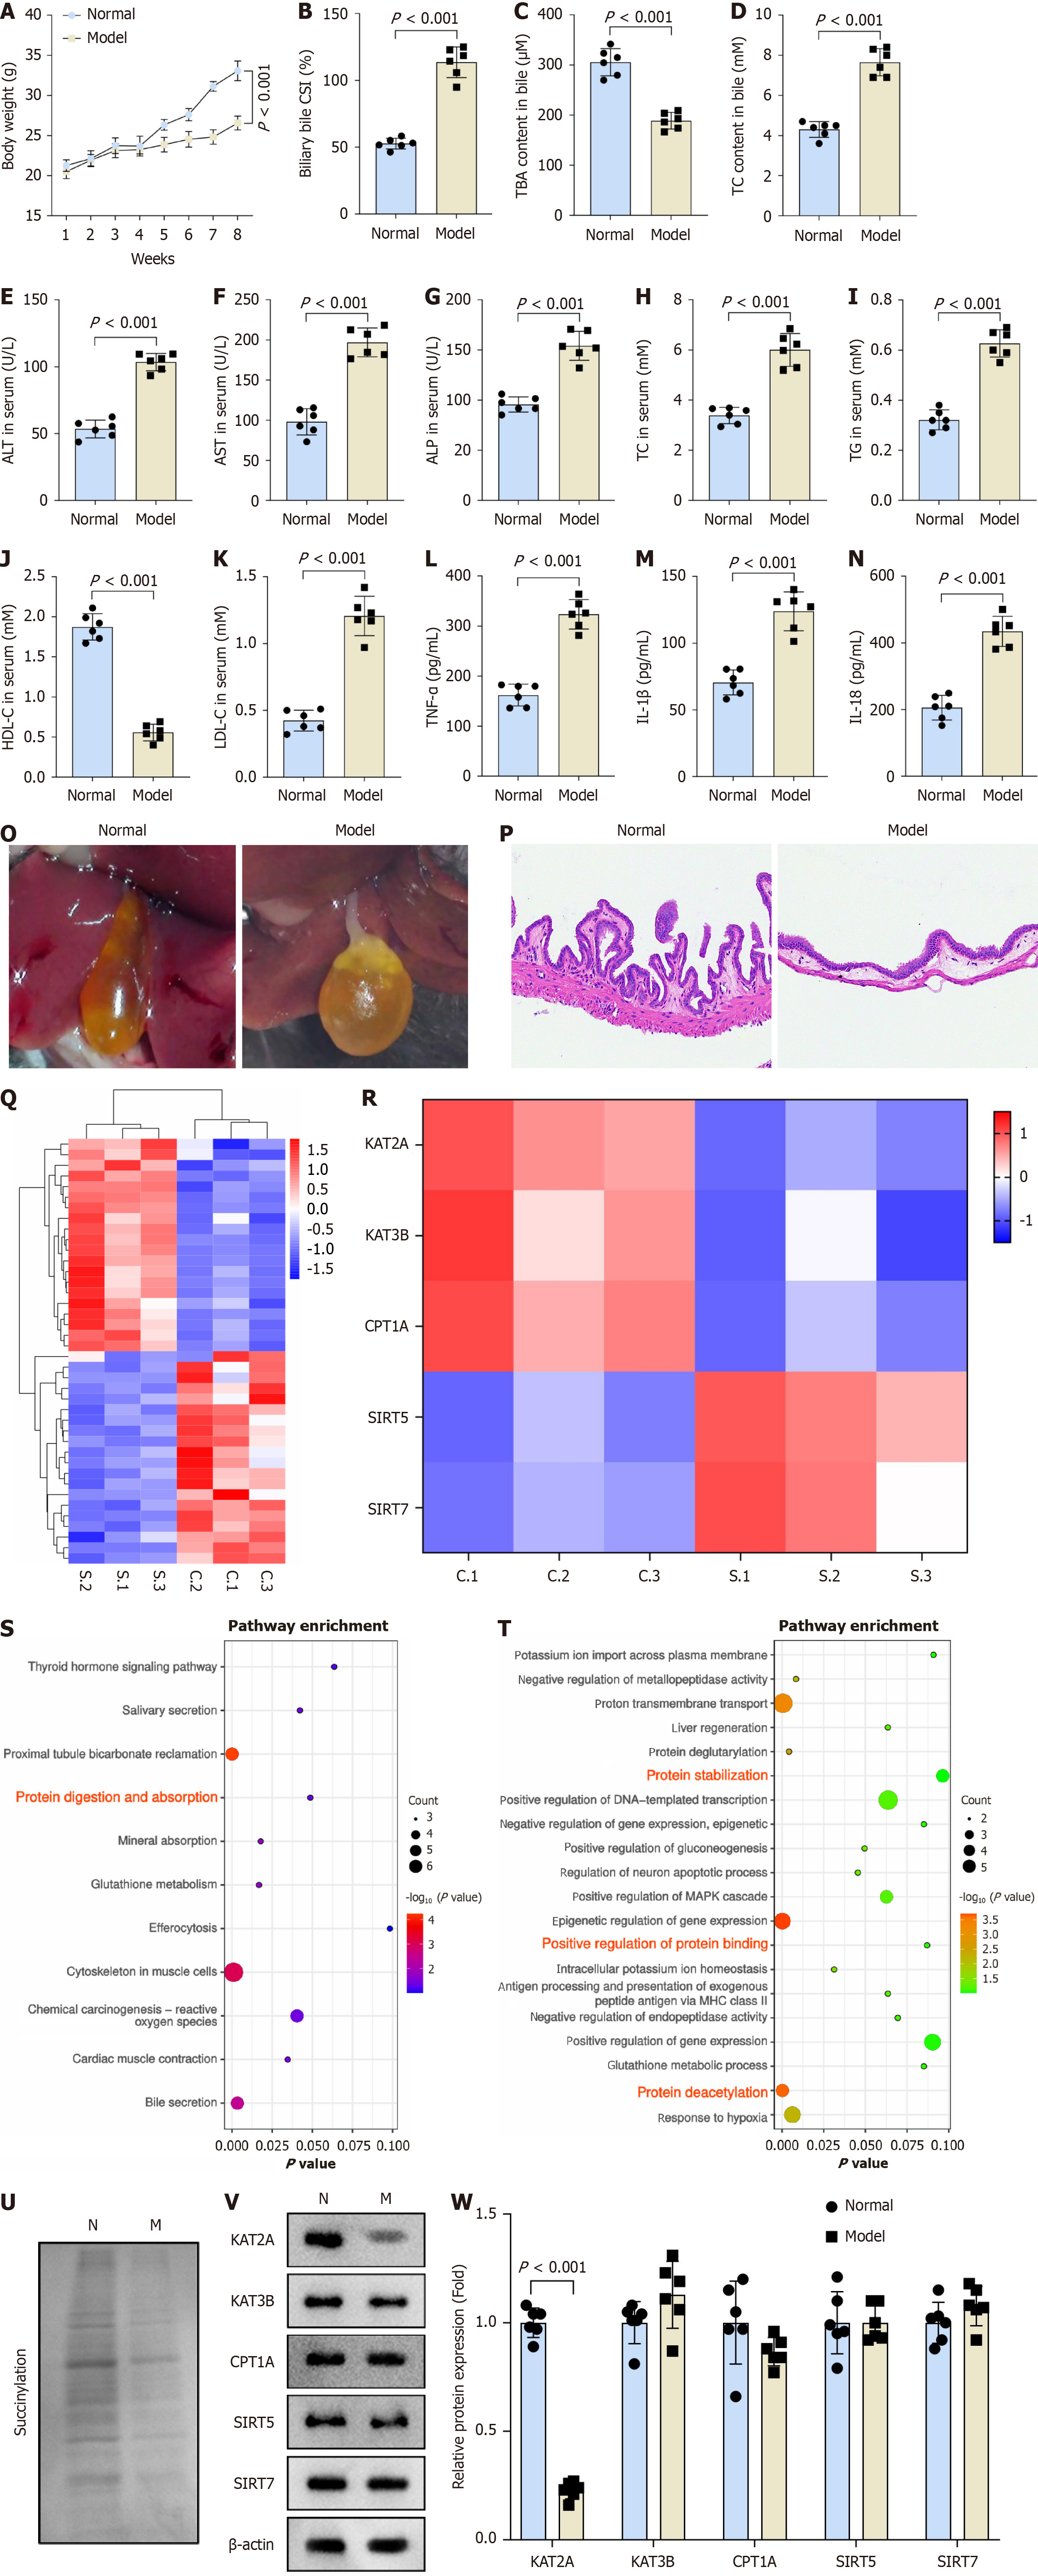
Figure 1 Lysine acetyltransferase 2A-mediated succinylation was involved in the regulation of cholelithiasis.
A: Body weight of the normal and the model groups (n = 6); B: Biliary bile cholesterol saturation index; C: Total bile acids content; D: Total cholesterol (TC) content in bile were measured (n = 6); E: Enzyme-linked immunosorbent assay analysis of the concentrations of alanine aminotransferase; F: Aspartate aminotransferase; G: Alkaline phosphatase; H: TC; I: Total triglycerides; J: High density lipoprotein cholesterol; K: Low density lipoprotein cholesterol; L: Tumor necrosis factor-α; M: Interleukin (IL)-1β; N: IL-18 (n = 6); O: Representive image of gallbladder stones of each group mice; P: Histological examination of the gallbladder by hematoxylin and eosin staining; Q: RNA-seq was performed to show differentially expressed genes between the normal and the model groups; R: Succinyltransferase enzymes were present in the differentially expressed genes between the normal and model groups; S: Gene Ontology; T: Kyoto Encyclopedia of Genes and Genomes databases were used to analyze the signaling pathways and metabolic processes enriched by differentially expressed genes; U-W: Western blot was performed to assess the protein levels of succinylation and enzymes associated with succinylation (n = 6). KAT2A: Lysine acetyltransferase 2A; KAT3B: Lysine acetyltransferase 3B; CPT1A: Carnitine palmitoyltransferase 1A; SIRT1: Sirtuin 1.
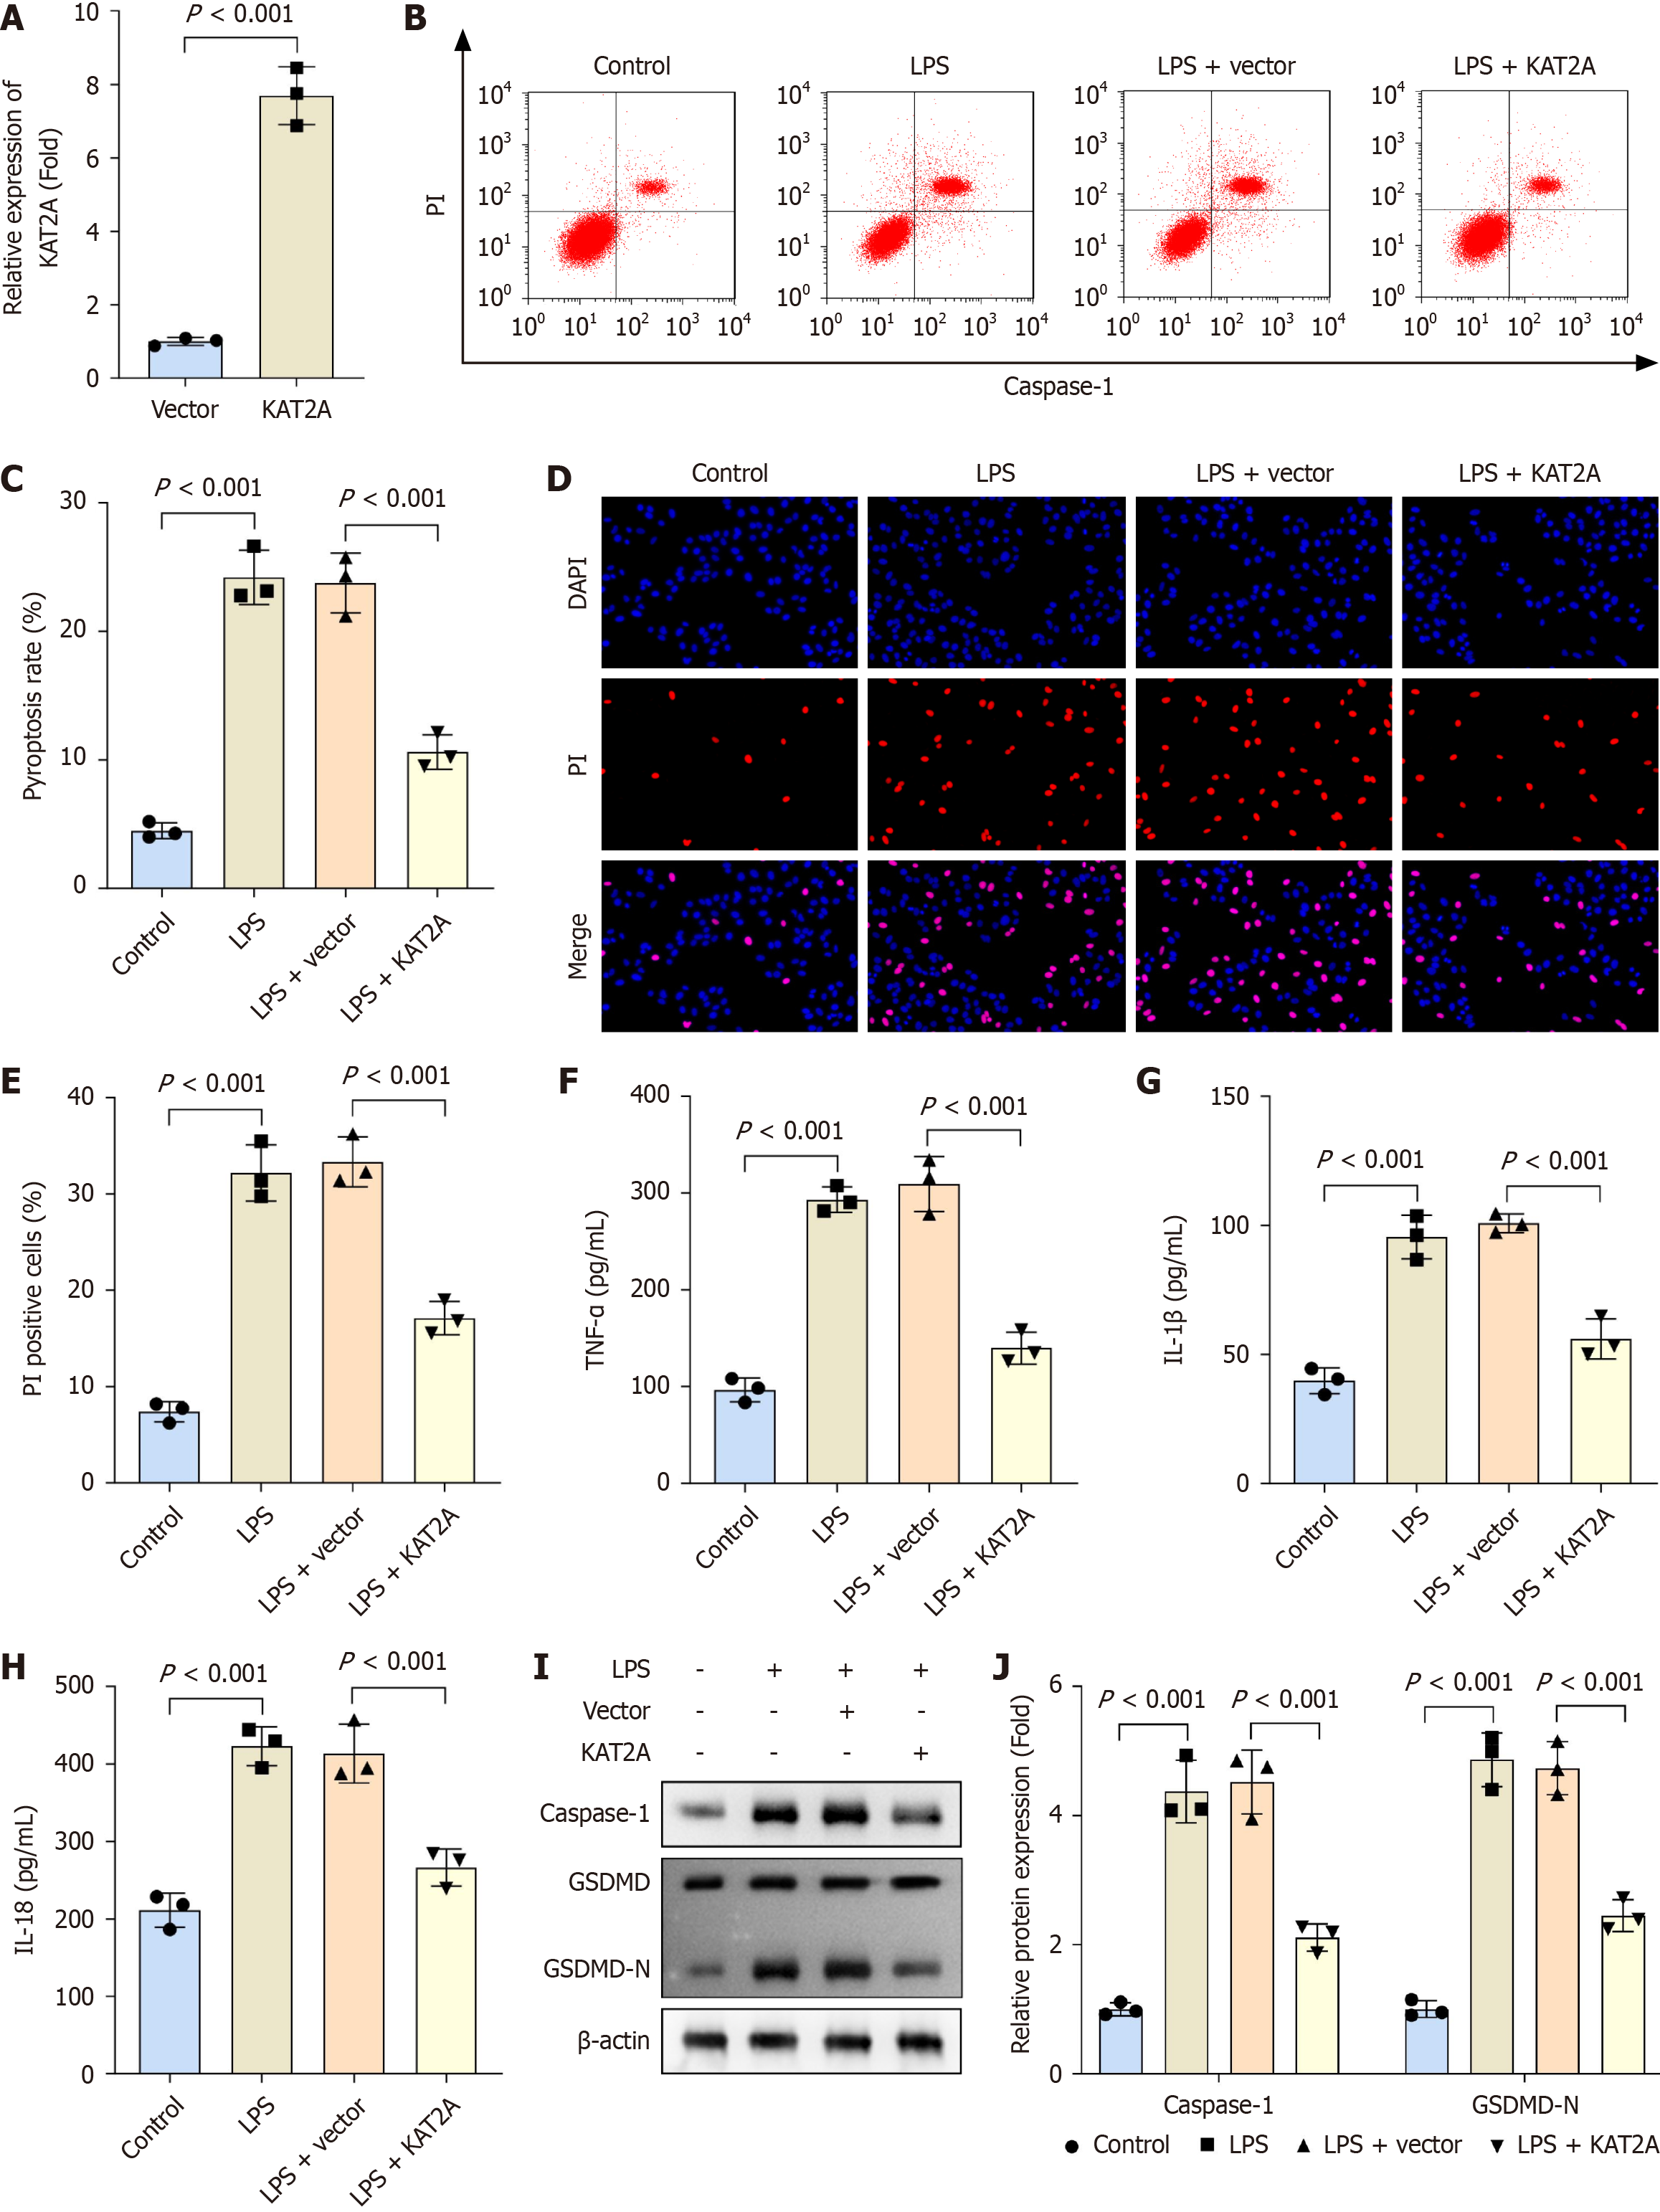
Figure 2 Lysine acetyltransferase 2A overexpression suppressed pyroptosis and inflammation in gallbladder mucosal epithelial cells.
A: The mRNA expression of lysine acetyltransferase 2A (KAT2A) was analyzed by reverse transcription-quantitative polymerase chain reaction when KAT2A was overexpressed in gallbladder mucosal epithelial cells (GMECs) (n = 3); B and C: Flow cytometry was used to detect the pyroptosis rate in GMECs in each group (n = 3); D and E: Propidium iodide staining was used to analyze cell death in each group (n = 3); F: Enzyme-linked immunosorbent assay was performed to determine the concentrations of tumor necrosis factor-α; G: Interleukin (IL)-1β; H: IL-18 in each group (n = 3); I and J: Western blot was performed to assess the protein levels of caspase-1 and gasdermin D-N in each group (n = 3). LPS: Lipopolysaccharide.
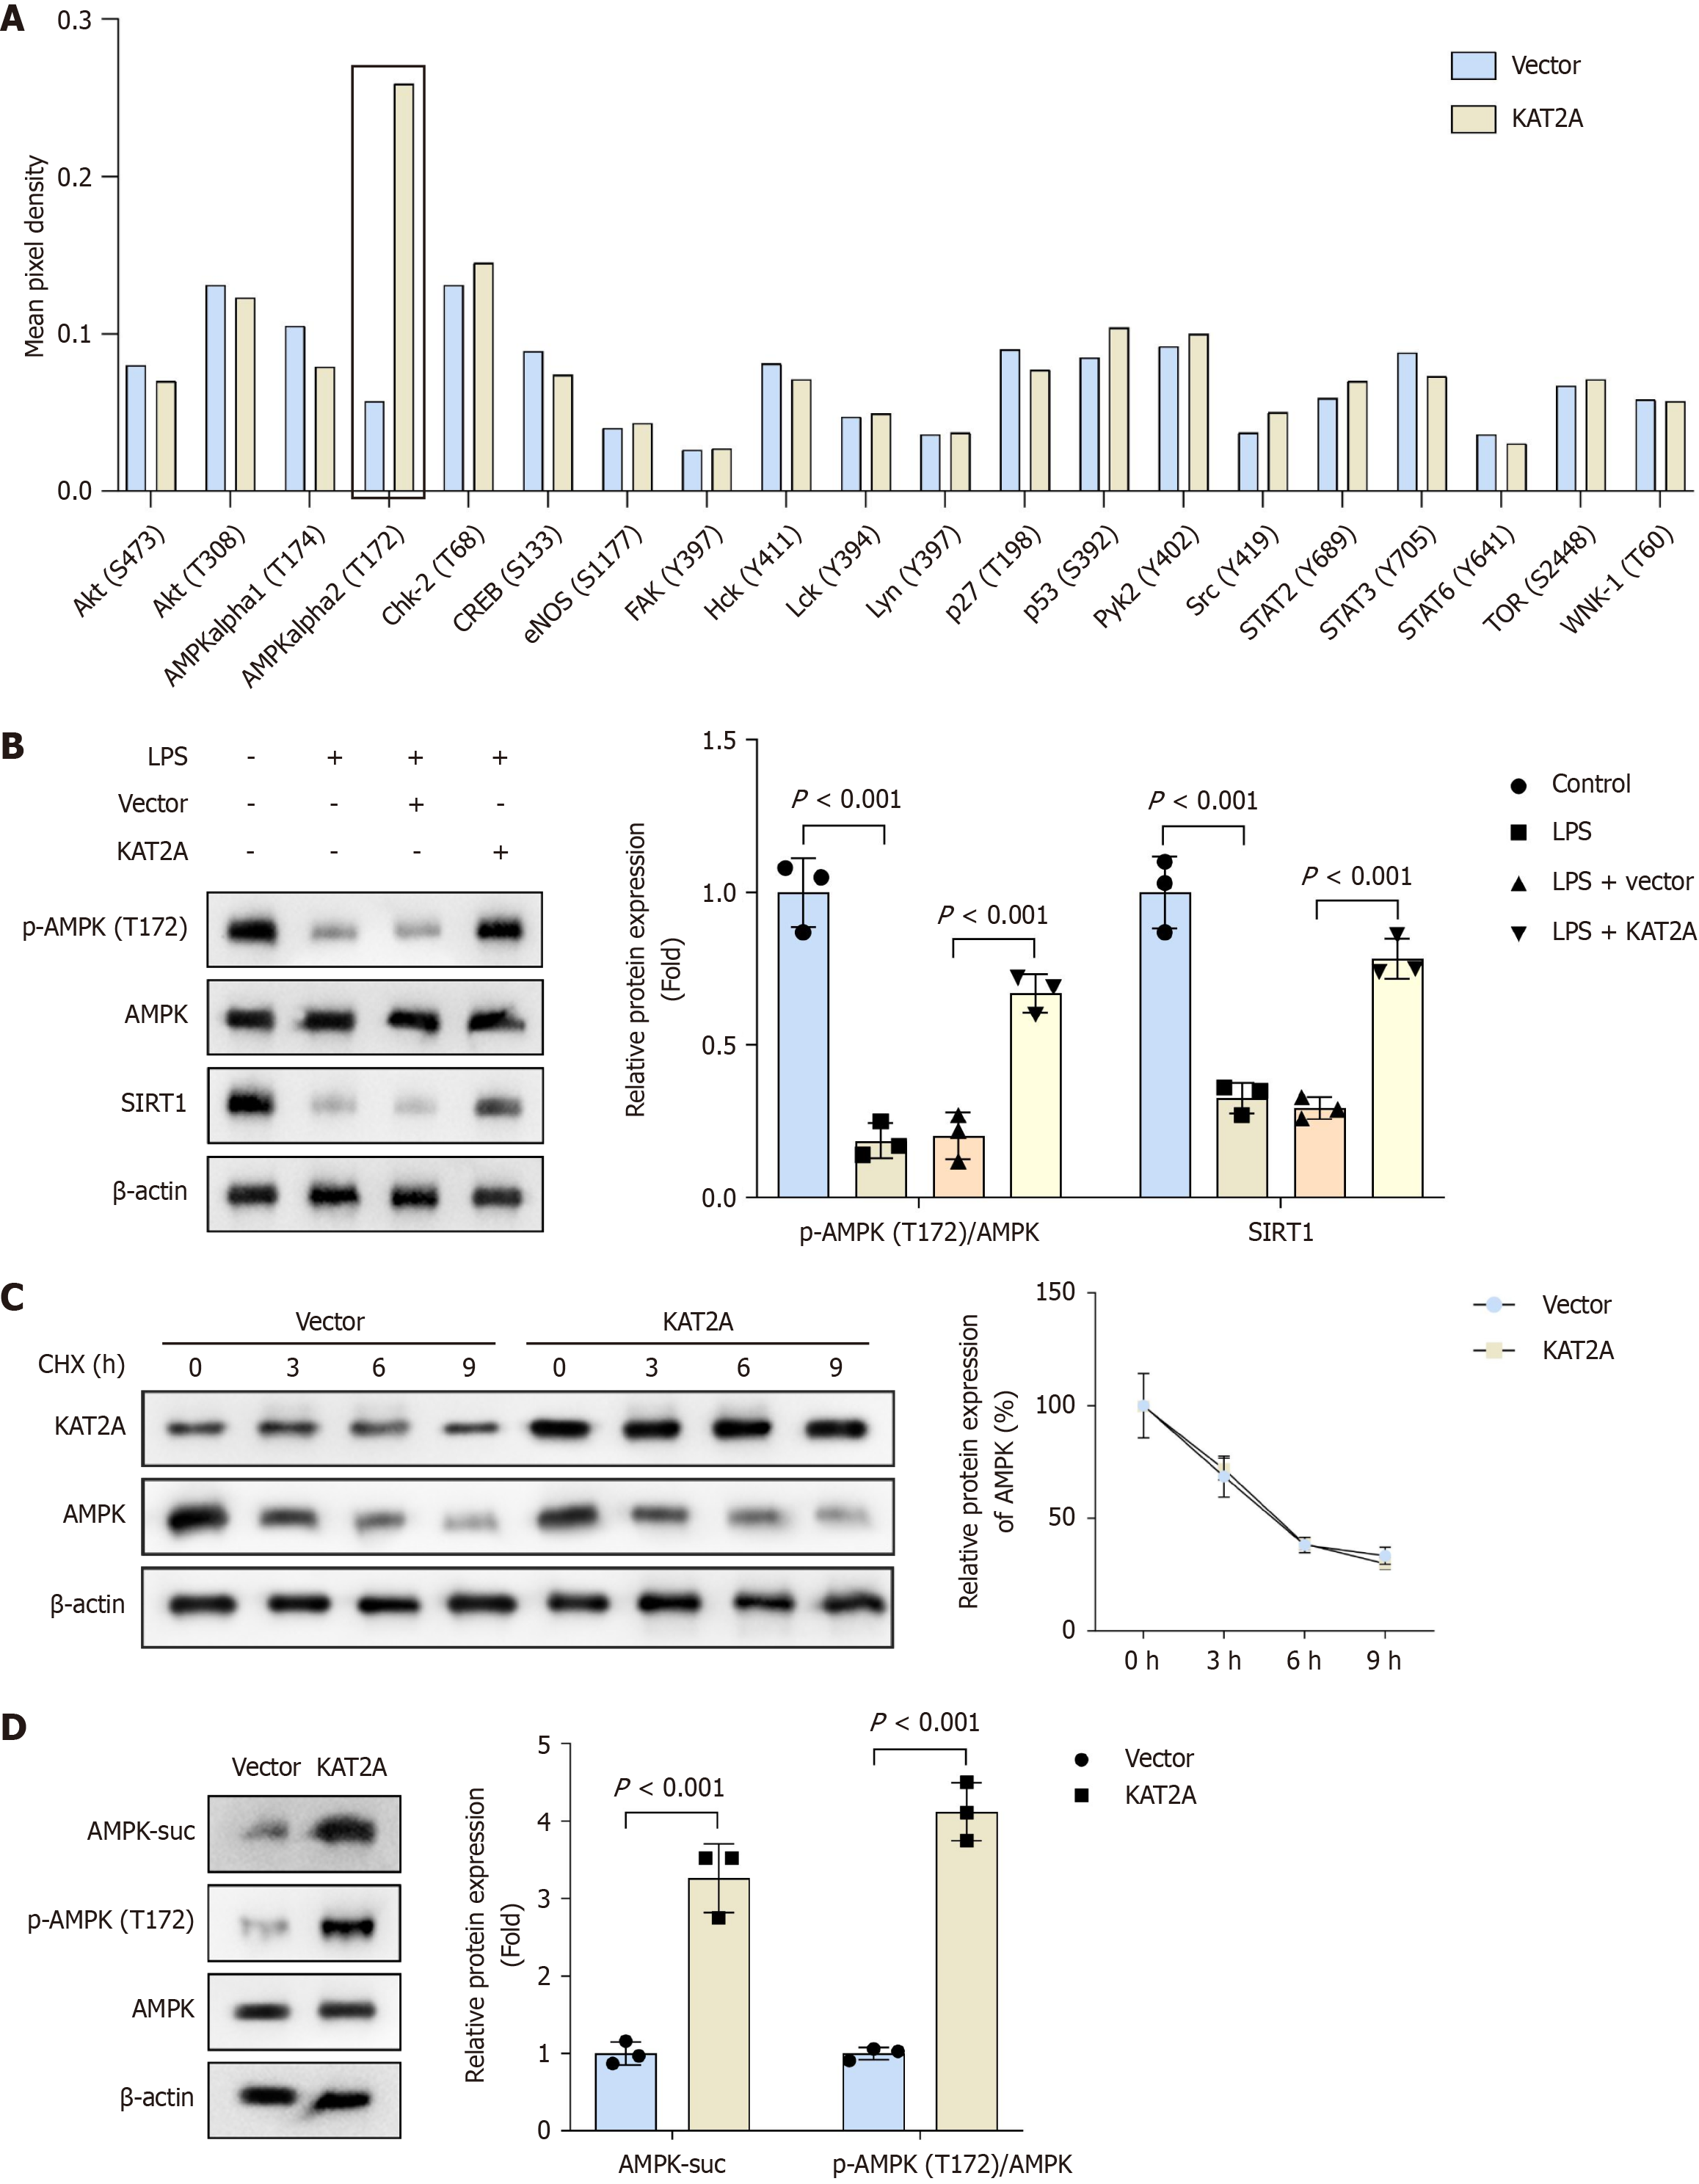
Figure 3 Lysine acetyltransferase 2A overexpression activated the adenosine monophosphate-activated protein kinase/silent information regulator 1 signaling pathway in gallbladder mucosal epithelial cells.
A: The screening results of changes in phospho-protein activation in vector and lysine acetyltransferase 2A overexpression groups were obtained using the proteome profiler phospho-kinase array (n = 3); B: The protein levels of phospho-adenosine monophosphate-activated protein kinase (T172), adenosine monophosphate-activated protein kinase, and sirtuin 1 in each group were measured by western blot (n = 3); C: The protein stablity of adenosine monophosphate-activated protein kinase in each group after KAT2A overexpression were measured by western blot (n = 3); D: The protein levels of phospho-adenosine monophosphate-activated protein kinase (T172), adenosine monophosphate-activated protein kinase, and adenosine monophosphate-activated protein kinase succinylation in each group were measured by western blot (n = 3). GMECs: Gallbladder mucosal epithelial cells; LPS: Lipopolysaccharide; CHX: Cycloheximide.
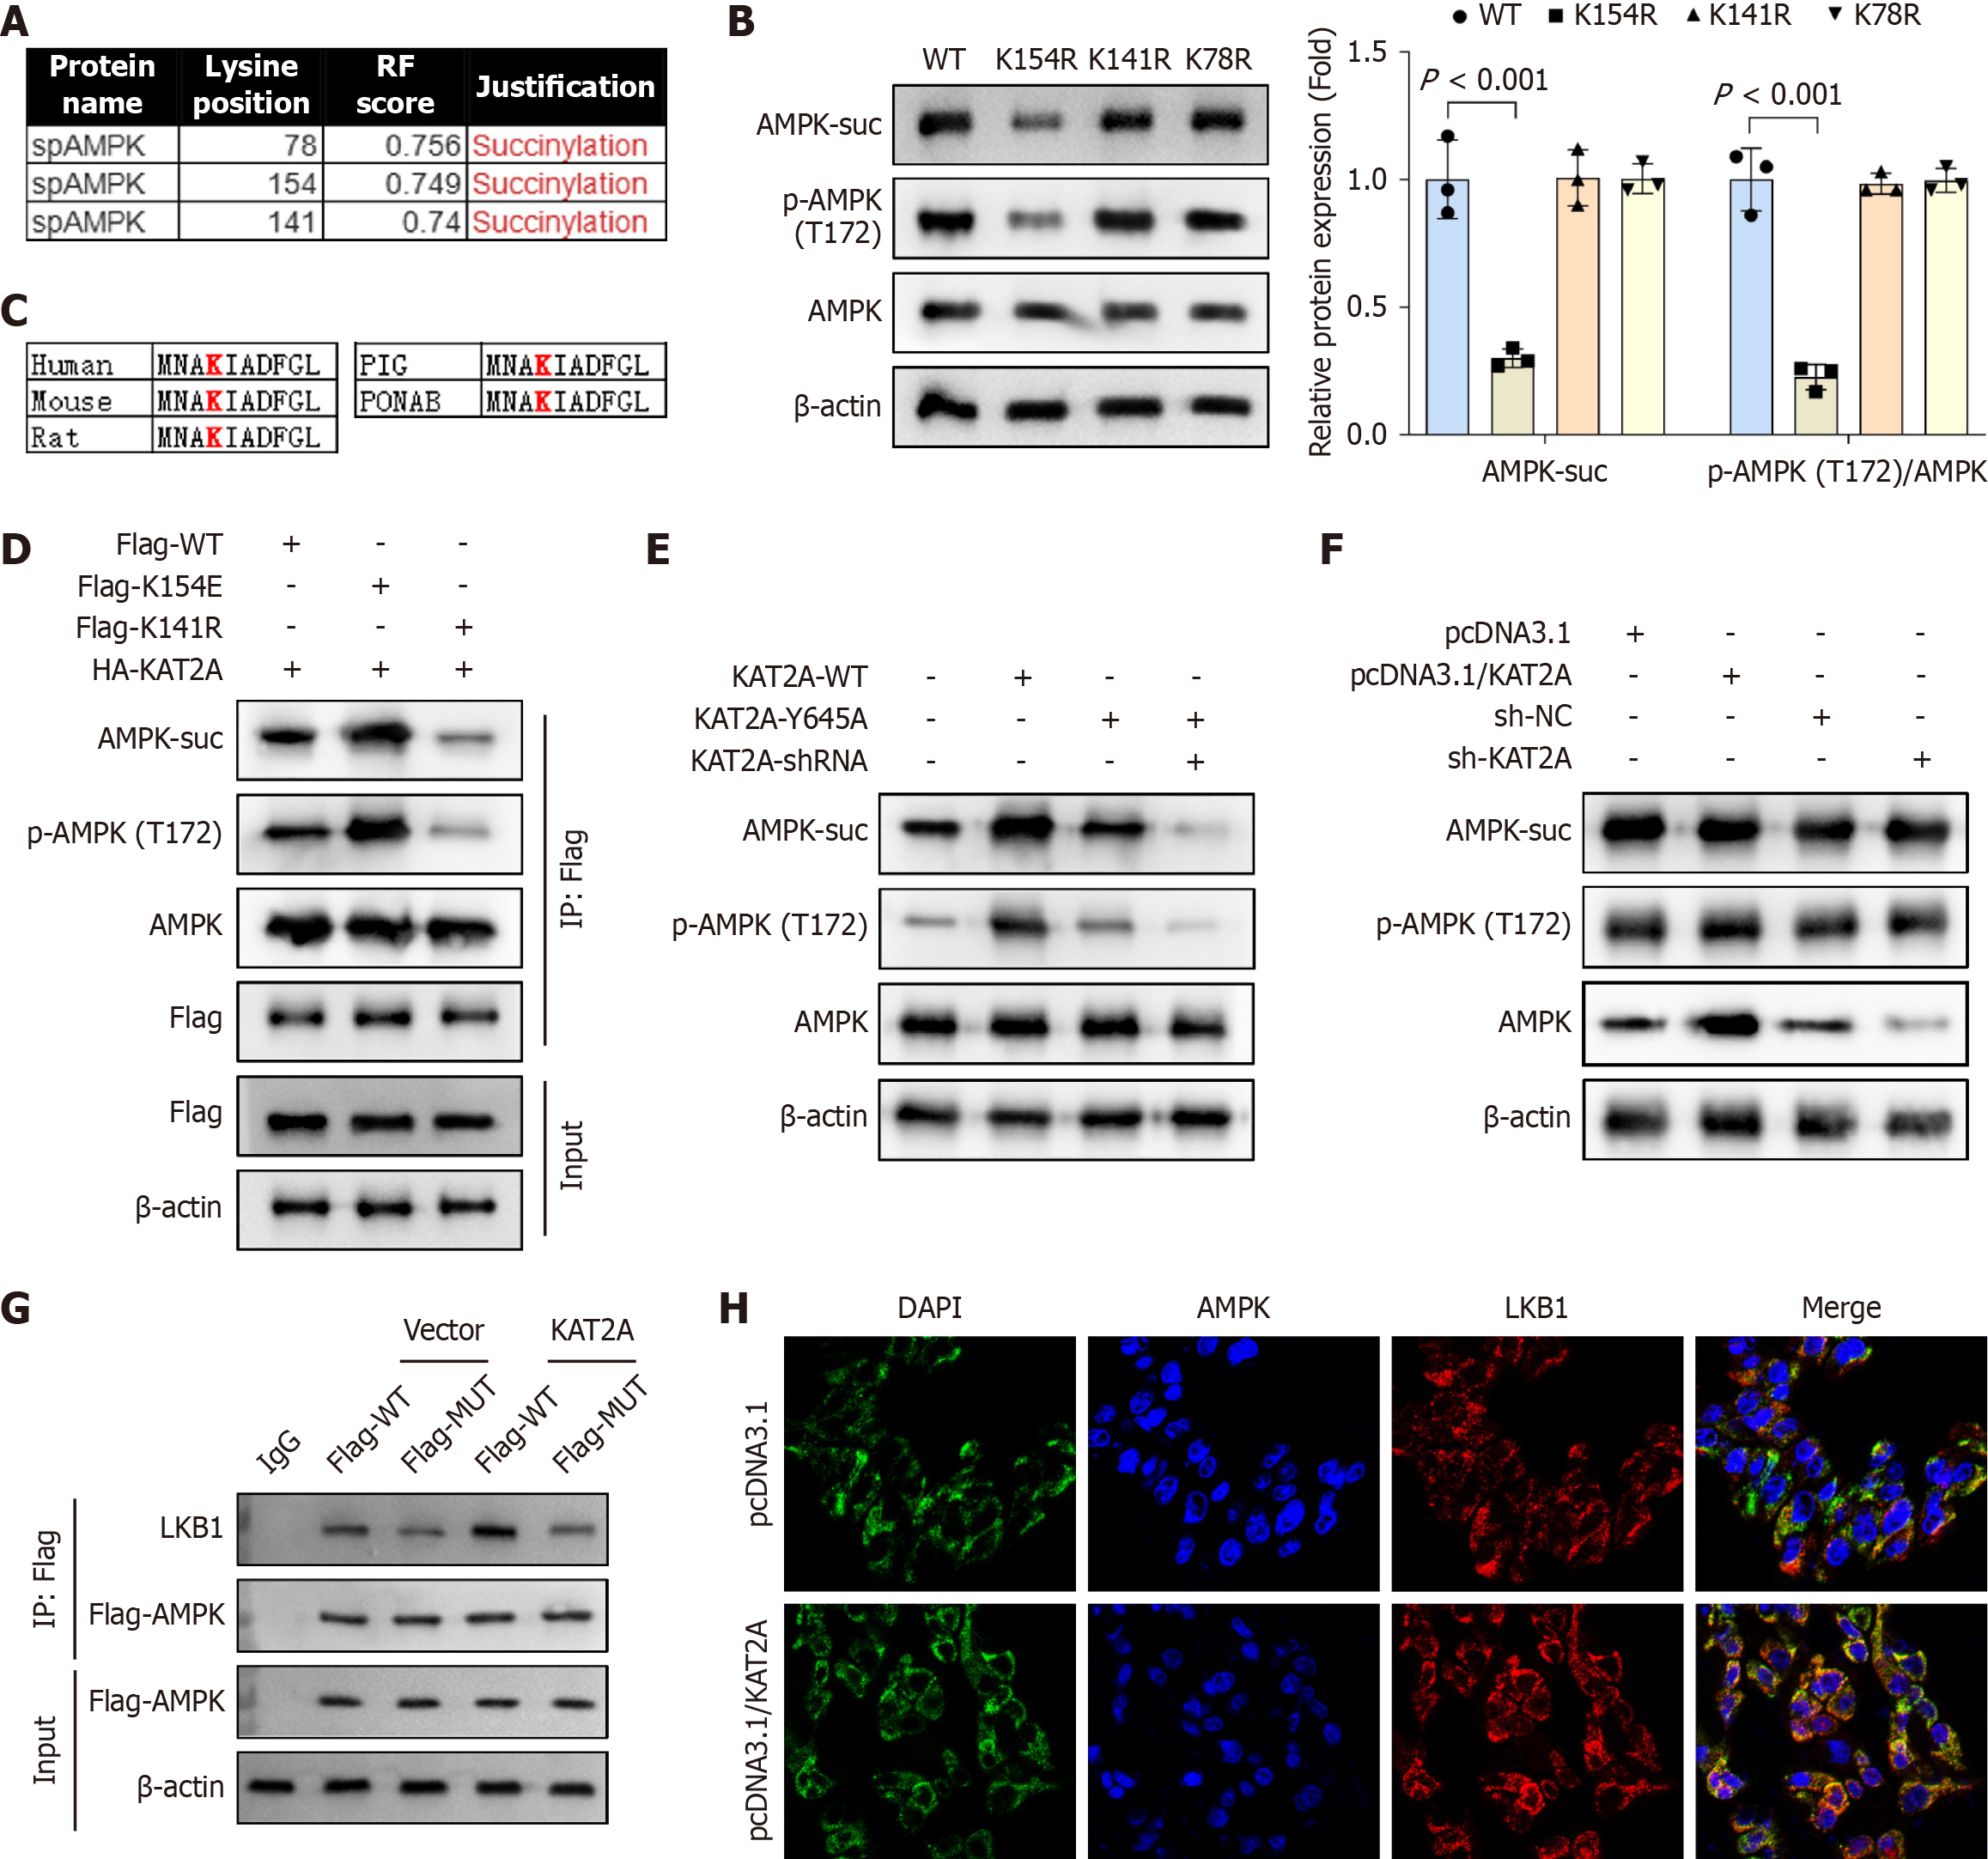
Figure 4 Adenosine monophosphate-activated protein kinase was succinylated at K170 site in gallbladder mucosal epithelial cells.
A: The protein levels of adenosine monophosphate-activated protein kinase (AMPK) succinylation (AMPK-suc), phospho-AMPK (p-AMPK), and AMPK after lysine acetyltransferase 2A (KAT2A) overexpression were detected by immunoprecipitation (IP) and western bot assays (n = 3); B: After mutating K179, K170, and K204 to K179R, K170R, and K204R, IP and western blot were performed to analyze the protein levels of AMPK-suc, p-AMPK, and AMPK (n = 3); C: K154 was highly conserved in different species, including human, mouse, rat, pig, and pongo abelii; D and E: Gallbladder mucosal epithelial cells (GMECs) were transfected with flag-WT, flag-K154E, flag-K154R, HA-KAT2A, KAT2A-WT, KAT2A-Y645A, and KAT2A-shRNA plasmids, and the protein levels of AMPK-suc and p-AMPK/AMPK was analyzed by IP and western blot (n = 3); F: After transfecting pcDNA3.1, pcDNA3.1/KAT2A, sh-KAT2A, and sh-NC plasmids, the protein levels of liver kinase B1 (LKB1)-suc, LKB1, and KAT2A were analyzed by IP and western blot (n = 3); G: Co-immunoprecipitation (Co-IP) was performed to detect the interaction between LKB1 and AMPK in GMECs (n = 3); H: Immunofluorescence (IF) was performed to analyze the binding of LKB1 and AMPK in GMECs (n = 3). DAPI: 4',6-diamidino-2-phenylindole.
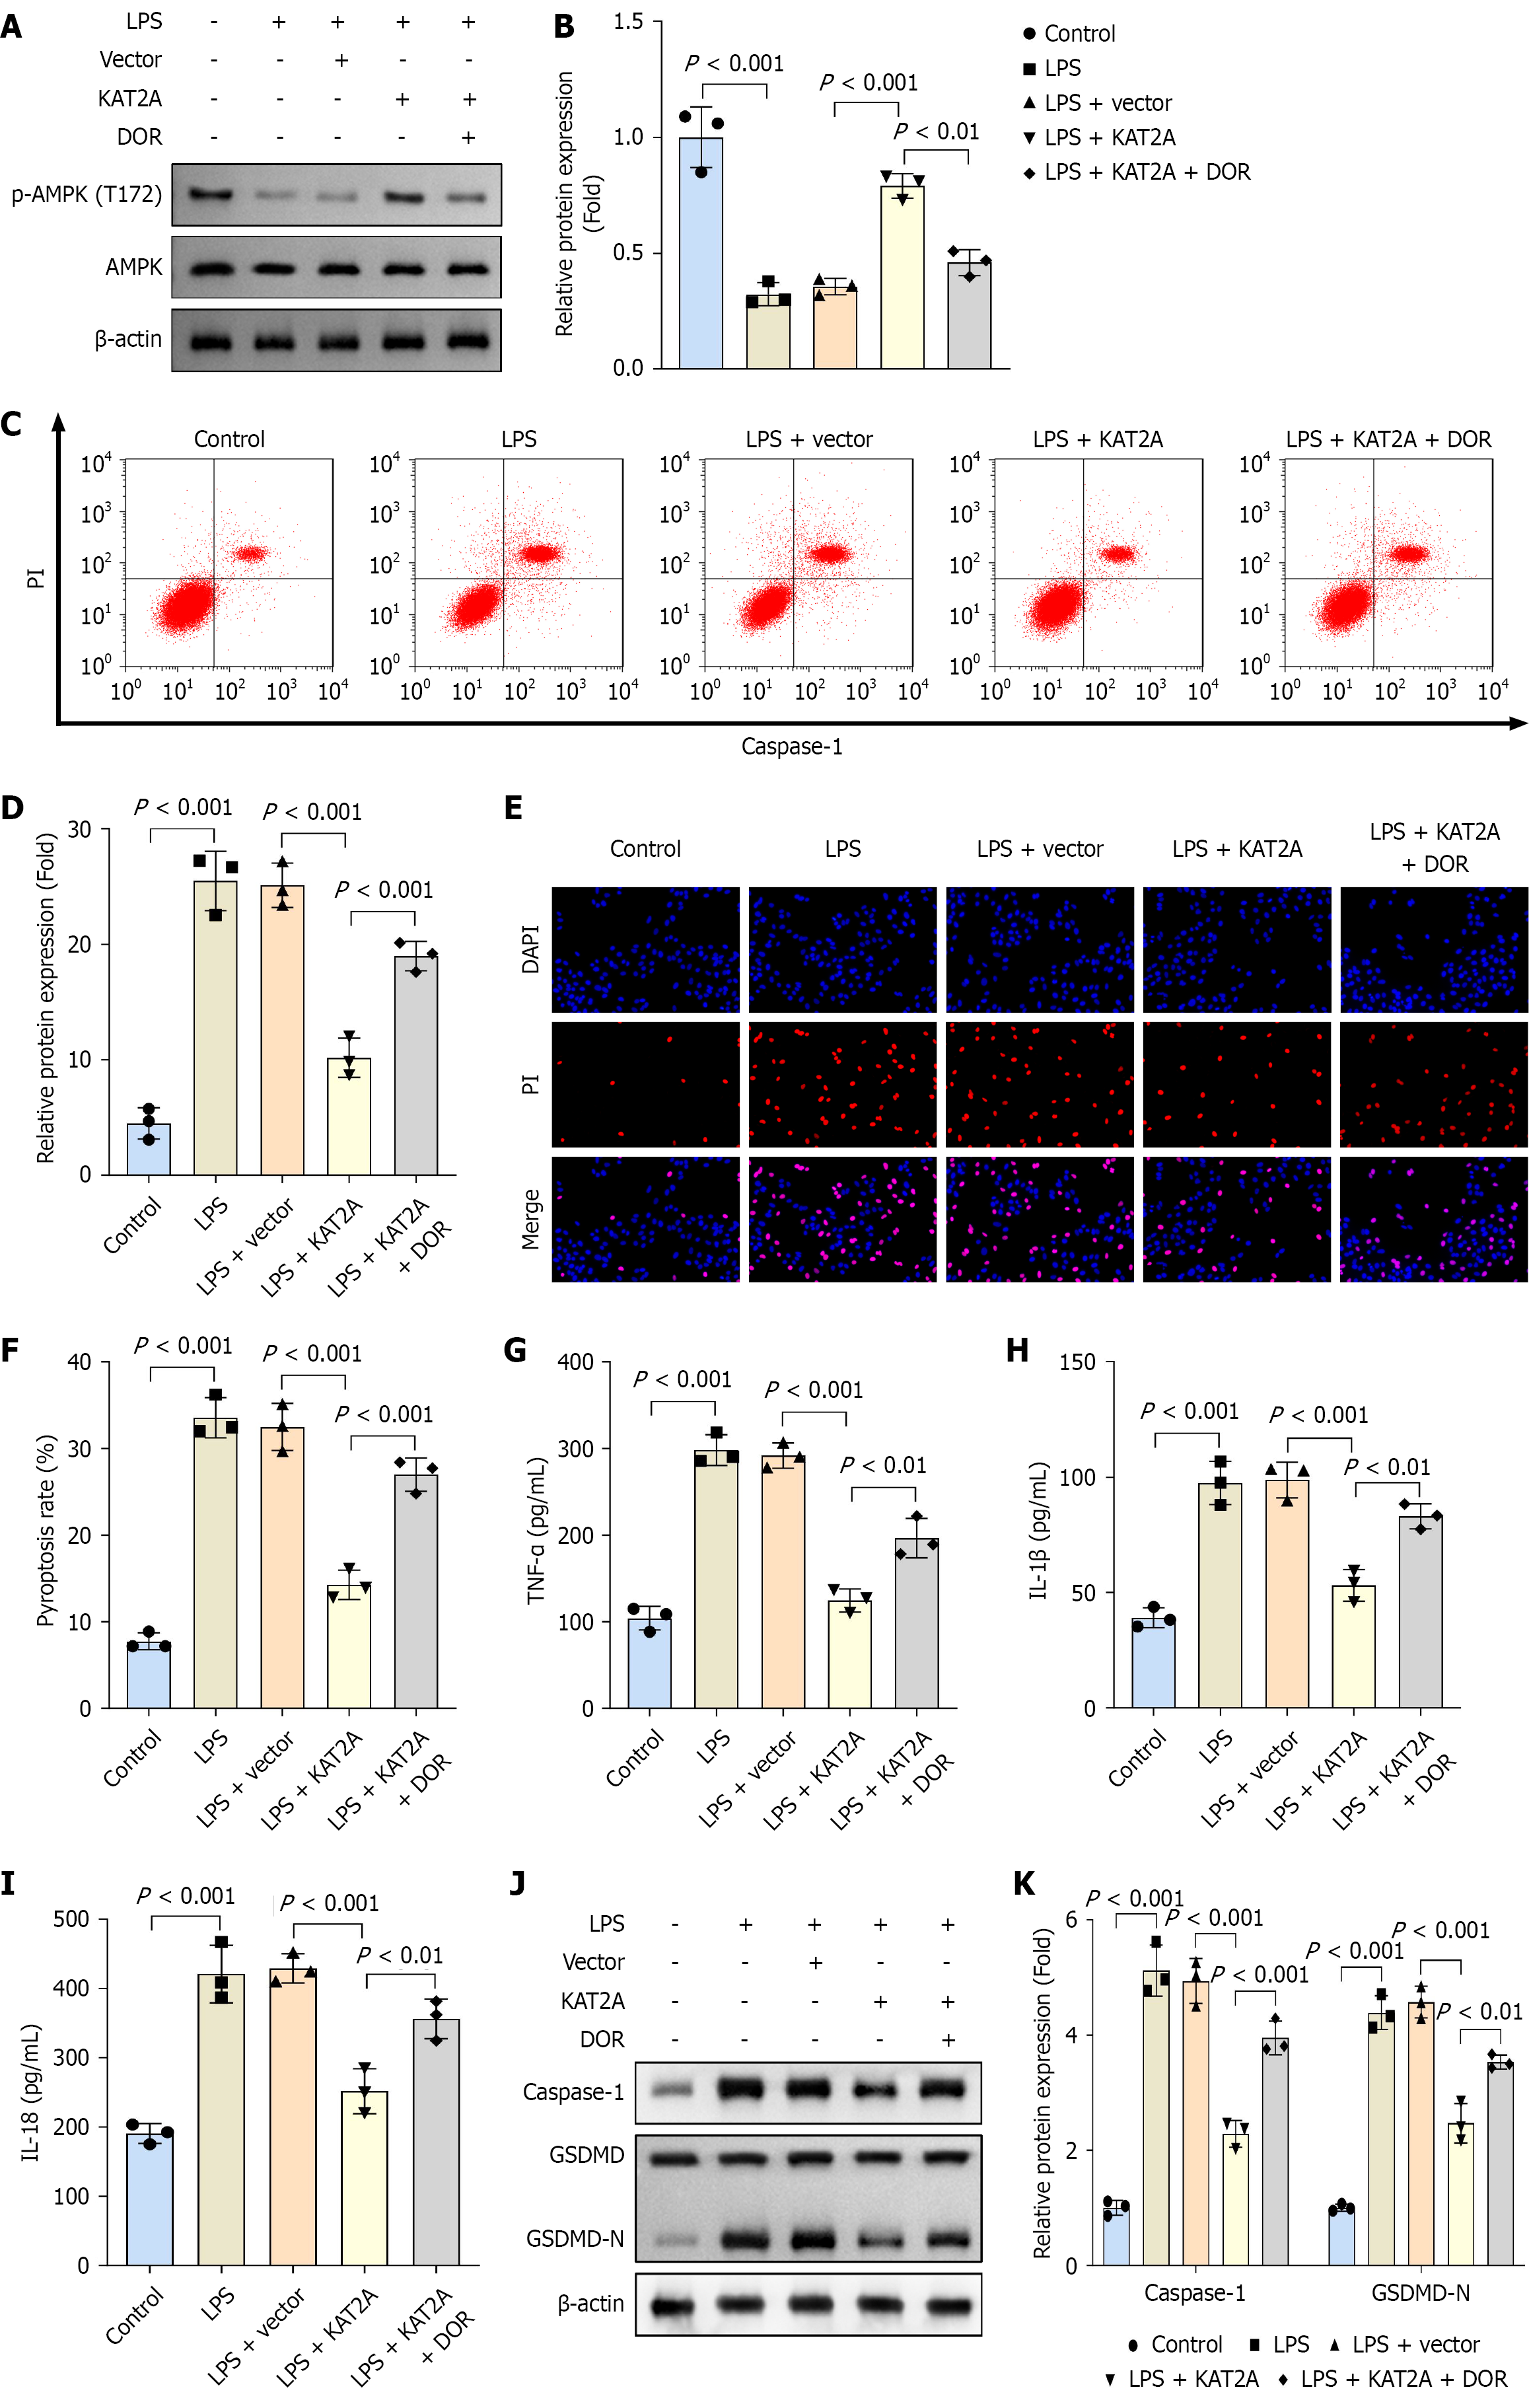
Figure 5 Dorsomorphin treatment increased pyroptosis and inflammation in gallbladder mucosal epithelial cells.
A: Western blot was performed to analyze the protein level of phospho-adenosine monophosphate-activated protein kinase (AMPK) (p-AMPK) (T172)/AMPK in gallbladder mucosal epithelial cells (GMECs) (n = 3); B: Quantification of relative protein level of p-AMPK (T172)/AMPK in each group (n = 3); C and D: Flow cytometry was performed to assess the pyroptosis rate in GMECs in each group (n = 3); E and F: Propidium iodide staining was used to analyze cell death in each group (n = 3); G: Enzyme-linked immunosorbent assay was used to measure the concentrations of tumor necrosis factor-α; H: Interleukin (IL)-1β; I: IL-18 in each group (n = 3); J and K: Western blot was performed to assess the protein levels of caspase-1 and gasdermin D-N in each group (n = 3). LPS: Lipopolysaccharide; DOR: Dorsomorphin.
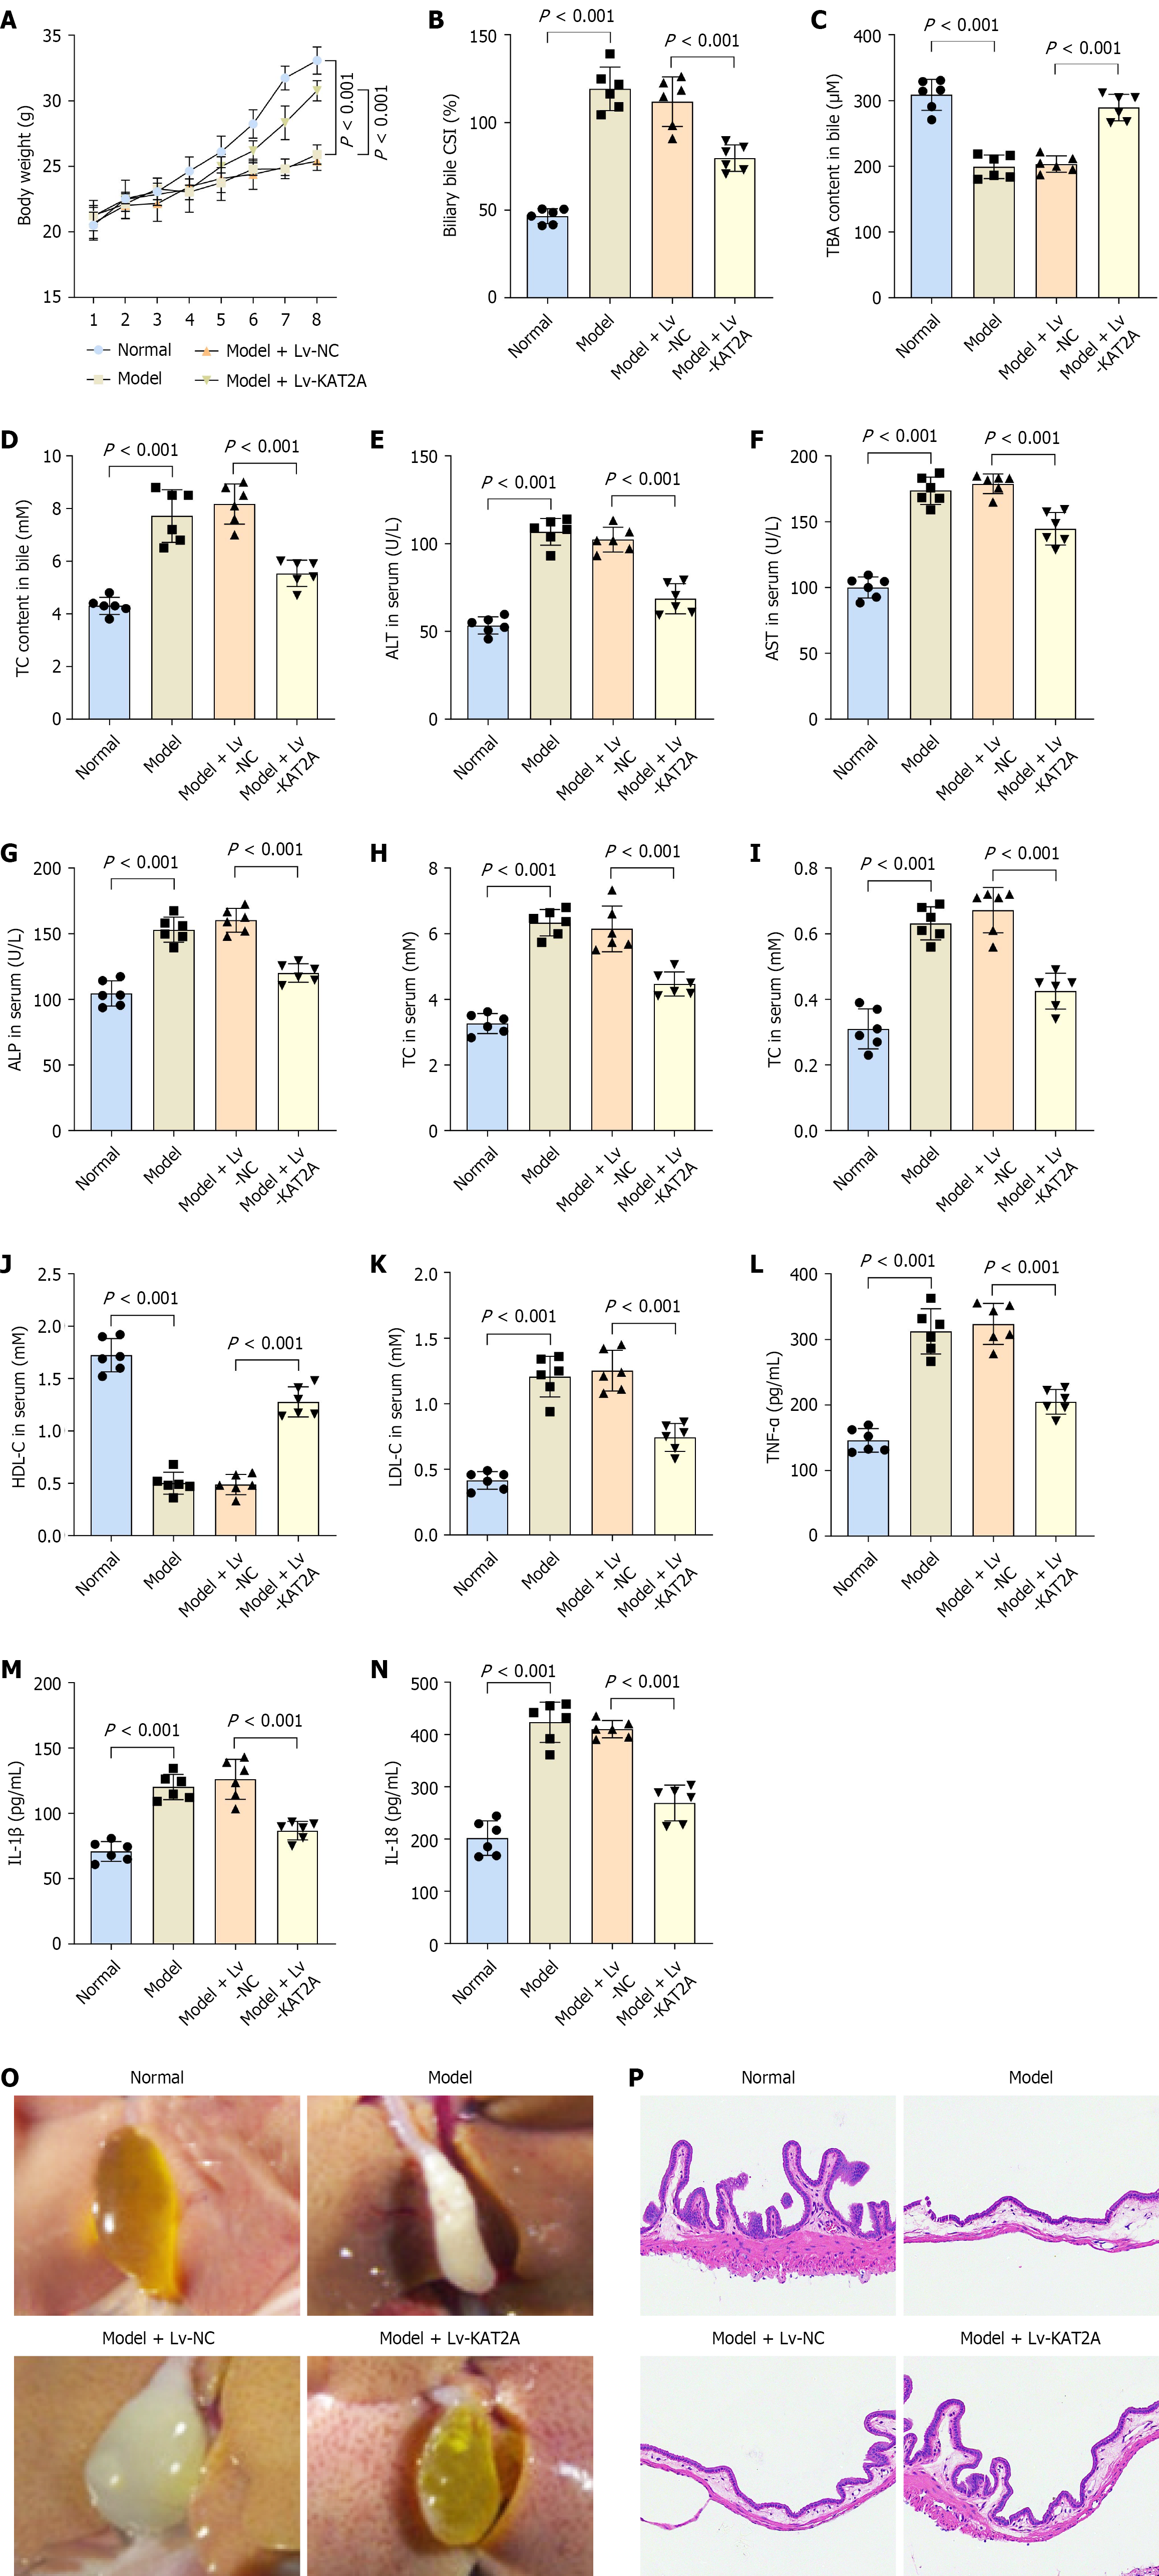
Figure 6 Lysine acetyltransferase 2A overexpression inhibited the apoptosis and the inflammation in gallbladder mucosal epithelial cells.
A: Body weight of each group (n = 6); B: Biliary bile cholesterol saturation index; C: Total bile acids content; D: Total cholesterol (TC) content in bile of each group were measured (n = 6); E: Enzyme-linked immunosorbent assay analysis of the concentrations alanine aminotransferase; F: Aspartate aminotransferase; G: Alkaline phosphatase; H: TC; I: Total triglycerides; J: High density lipoprotein cholesterol; K: Low density lipoprotein cholesterol; L: Tumor necrosis factor-α; M: Interleukin (IL)-1β; N: IL-18 (n = 6); O: Representive image of gallbladder stones of each group mice; P: Histological examination of each group gallbladder by hematoxylin and eosin staining. KAT2A: Lysine acetyltransferase 2A.
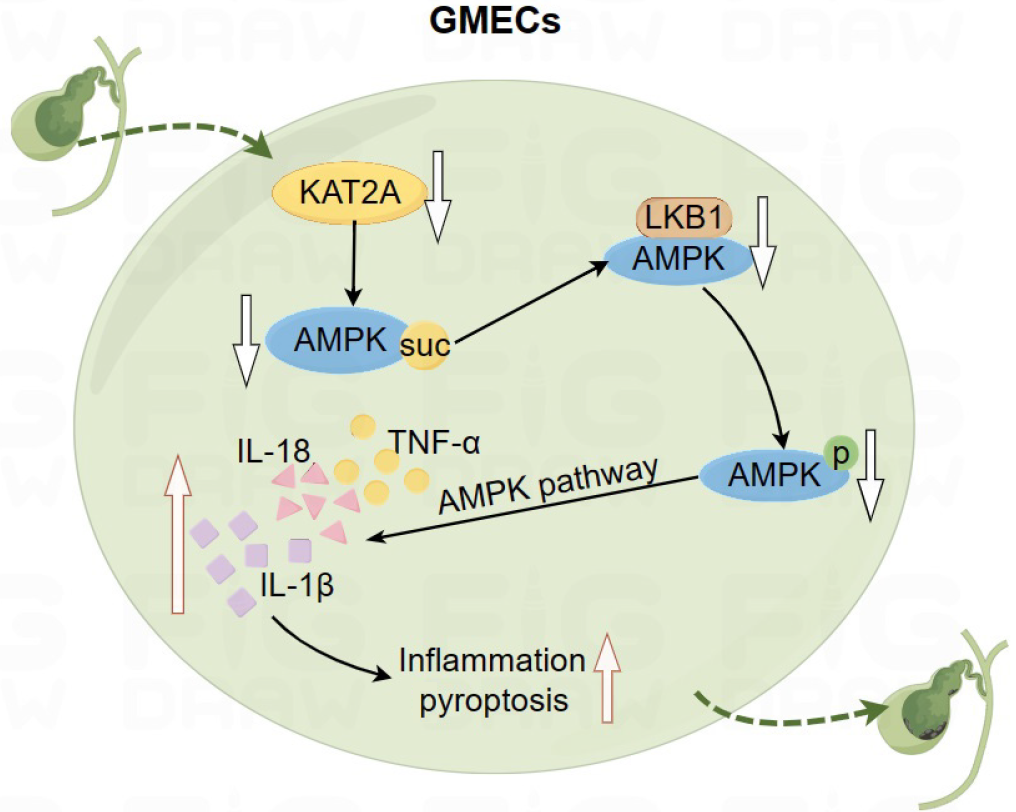
Figure 7 The molecular mechanism diagram.
Down-regulation of lysine acetyltransferase 2A reduces adenosine monophosphate-activated protein kinase (AMPK) succinylation. Reduced AMPK succinylation inhibits the interaction between AMPK and liver kinase B1, thereby suppressing AMPK phosphorylation. Inhibition of AMPK phosphorylation promotes pyroptosis and inflammation in gallbladder mucosal epithelial cells, ultimately leading to gallstone formation. TNF-α: Tumor necrosis factor; IL: Interleukin; suc: Succinylation; GMECs: Gallbladder mucosal epithelial cells.
- Citation: Wang XX, Ma MZ, Zhu LC, Dai LF, Qin C, Shao S, Xu XW, Gao RX, Zhang ZH. Lysine acetyltransferase 2A-mediated succinylation of adenosine monophosphate-activated protein kinase suppresses gallstone formation by inhibiting inflammation and pyroptosis. World J Gastroenterol 2025; 31(39): 110115
- URL: https://www.wjgnet.com/1007-9327/full/v31/i39/110115.htm
- DOI: https://dx.doi.org/10.3748/wjg.v31.i39.110115


