Copyright
©The Author(s) 2025.
World J Gastroenterol. Oct 7, 2025; 31(37): 110829
Published online Oct 7, 2025. doi: 10.3748/wjg.v31.i37.110829
Published online Oct 7, 2025. doi: 10.3748/wjg.v31.i37.110829
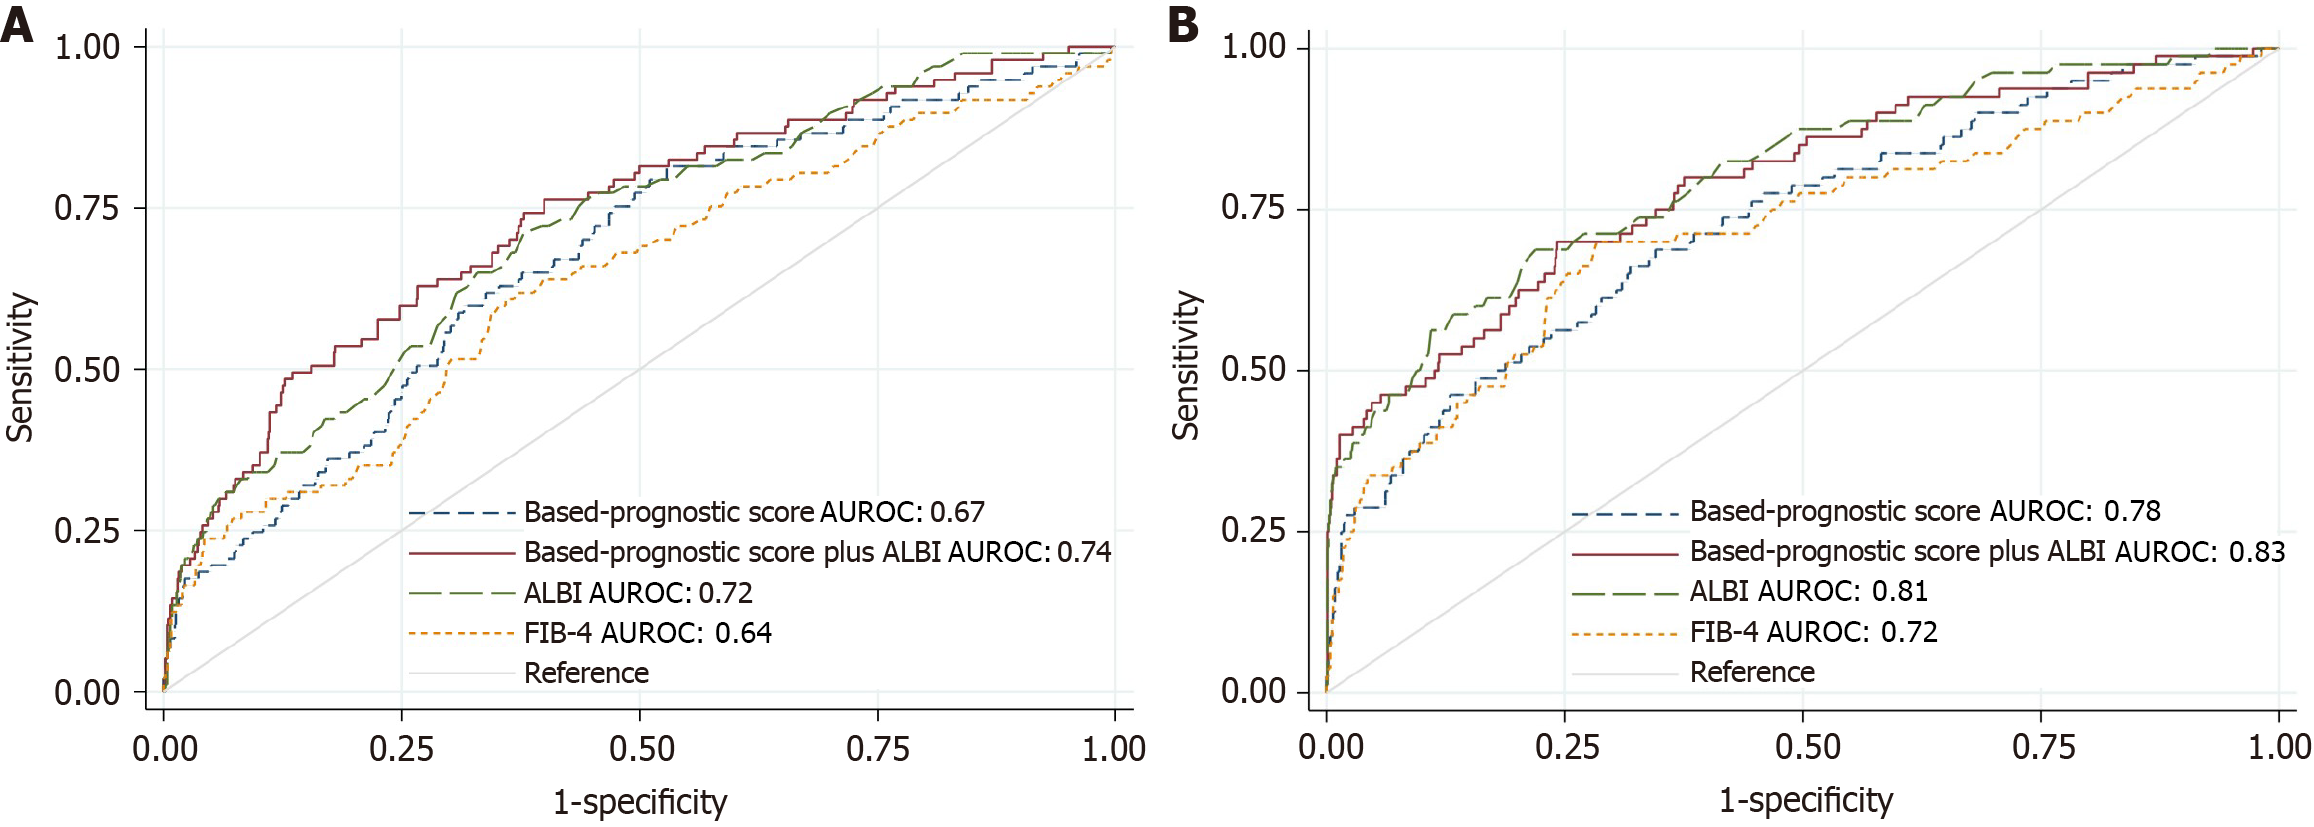
Figure 1 Area under the receiver operating characteristic curve of albumin-bilirubin, fibrosis-4 and prognostic scores from multivariable logistic regression including determinants.
A: 8-year liver-related complications; B: 8-year all-cause mortality. AUROC: Area under the receiver operating characteristic curve; ALBI: Albumin-bilirubin; FIB-4: Fibrosis-4.
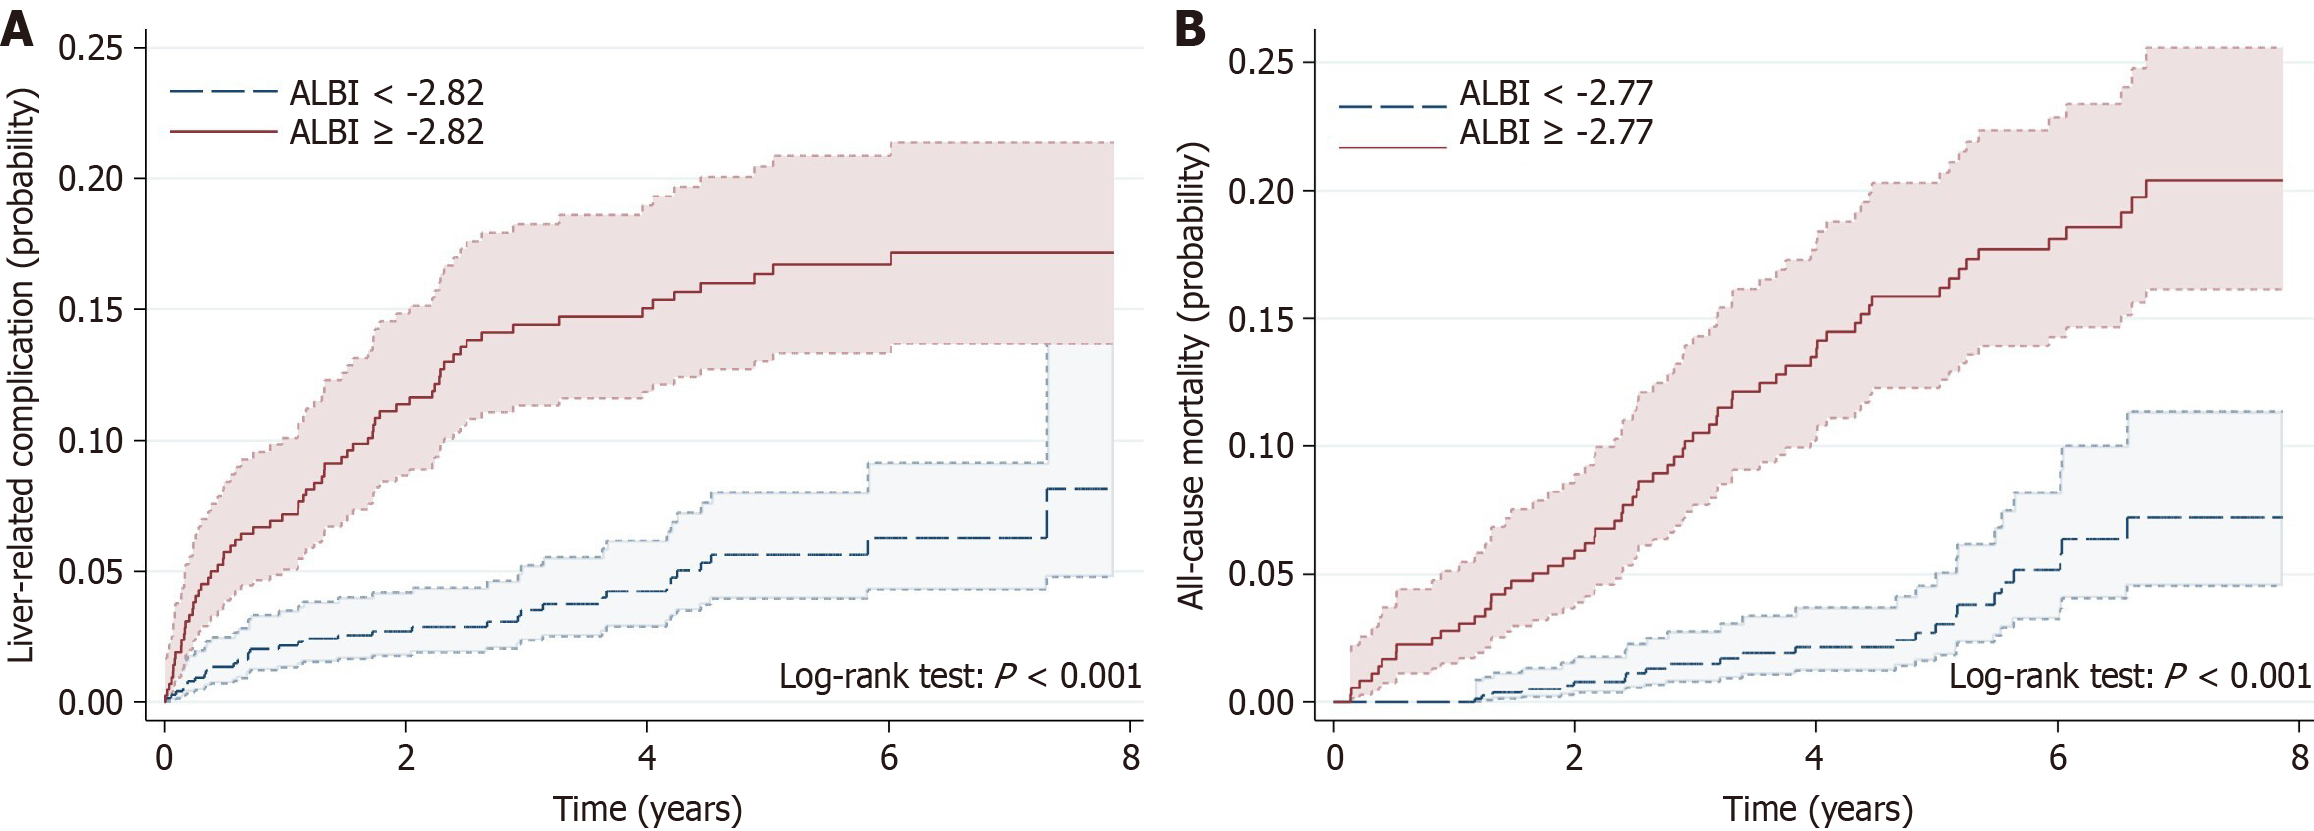
Figure 2 Kaplan-Meier plot of estimated.
A: 8-year liver-related complications; B: 8-year all-cause mortality according to the optimum cut point of albumin-bilirubin. Short-dashed line with shaded areas indicates a 95% confidence interval. ALBI: Albumin-bilirubin.
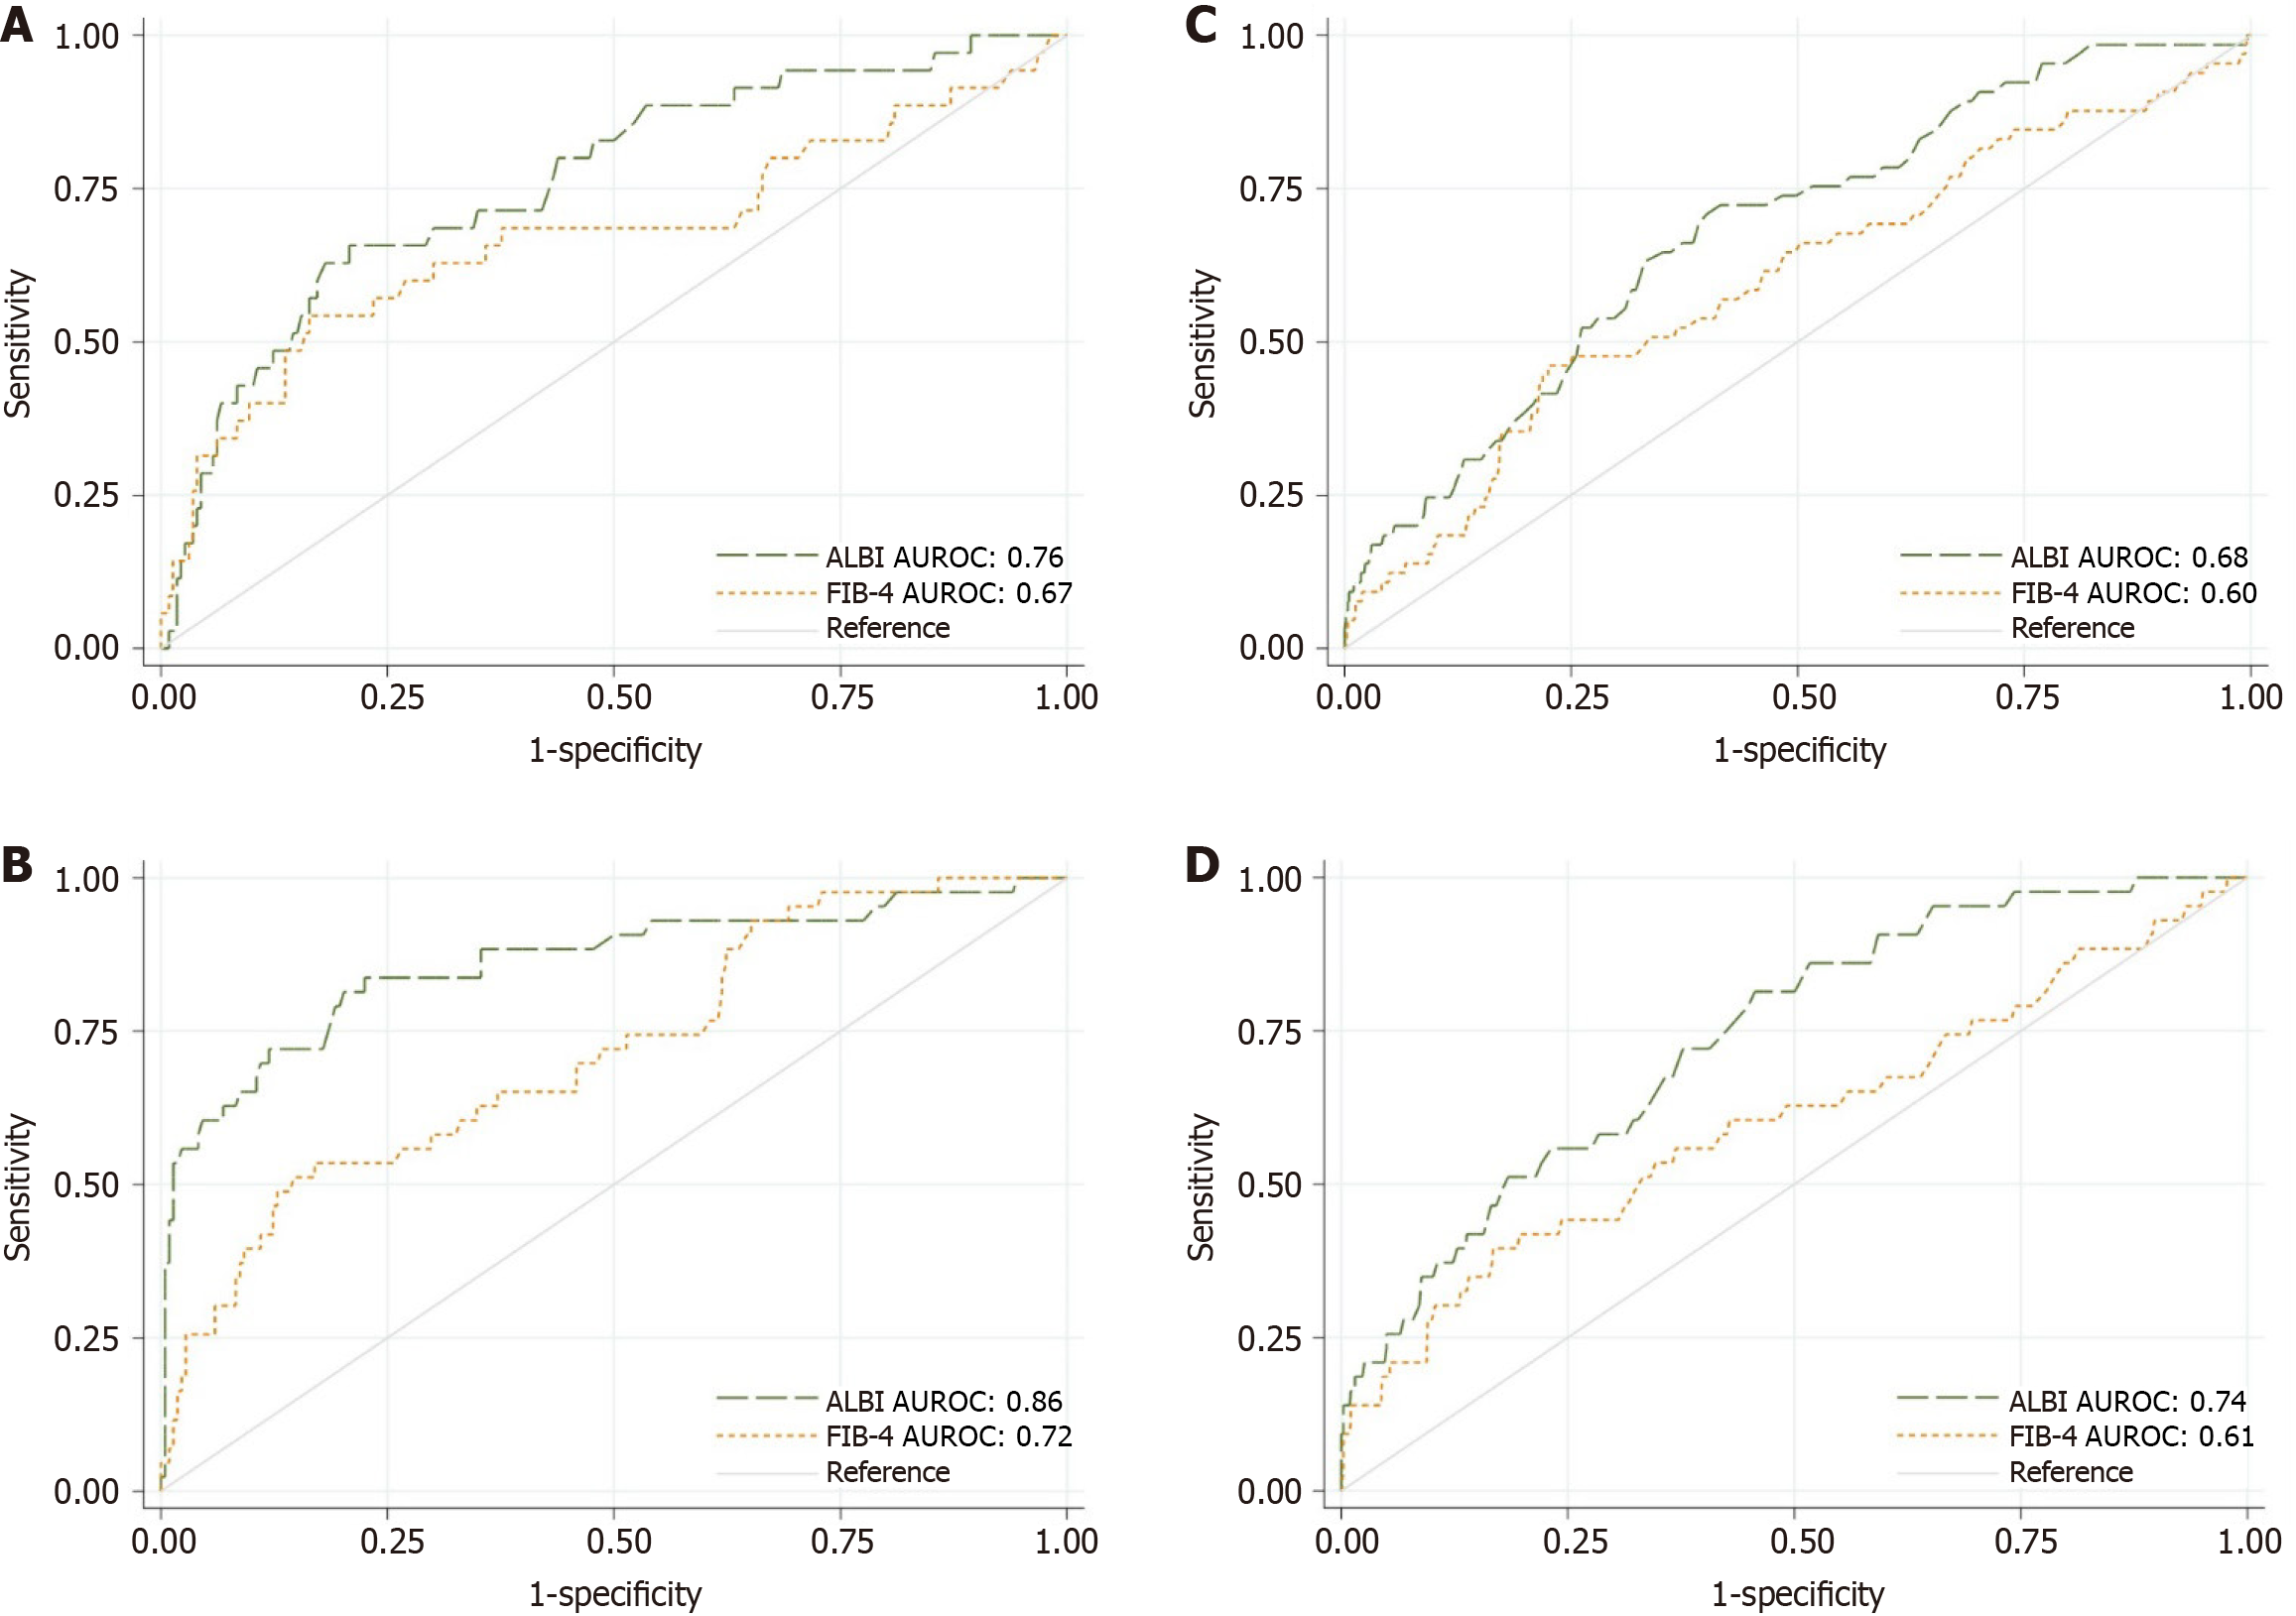
Figure 3 Area under the receiver operating characteristic curve of albumin-bilirubin, fibrosis-4 determinants.
A: 8-year liver-related complications in advance fibrosis group; B: 8-year all- cause mortality in advance fibrosis group; C: 8-year liver-related complications in non-advance fibrosis group; D: 8-year all caused mortality in non-advance fibrosis group. AUROC: Area under the receiver operating characteristic curve; ALBI: Albumin-bilirubin; FIB-4: Fibrosis-4.
- Citation: Sethasine S, Teerawongsakul P, Ruamtawee W, Treerasoradaj N, Navadurong H. Added value of the albumin-bilirubin score in predicting liver-related complications and mortality in metabolic-associated steatotic liver disease. World J Gastroenterol 2025; 31(37): 110829
- URL: https://www.wjgnet.com/1007-9327/full/v31/i37/110829.htm
- DOI: https://dx.doi.org/10.3748/wjg.v31.i37.110829


