Copyright
©The Author(s) 2025.
World J Gastroenterol. Sep 7, 2025; 31(33): 109562
Published online Sep 7, 2025. doi: 10.3748/wjg.v31.i33.109562
Published online Sep 7, 2025. doi: 10.3748/wjg.v31.i33.109562
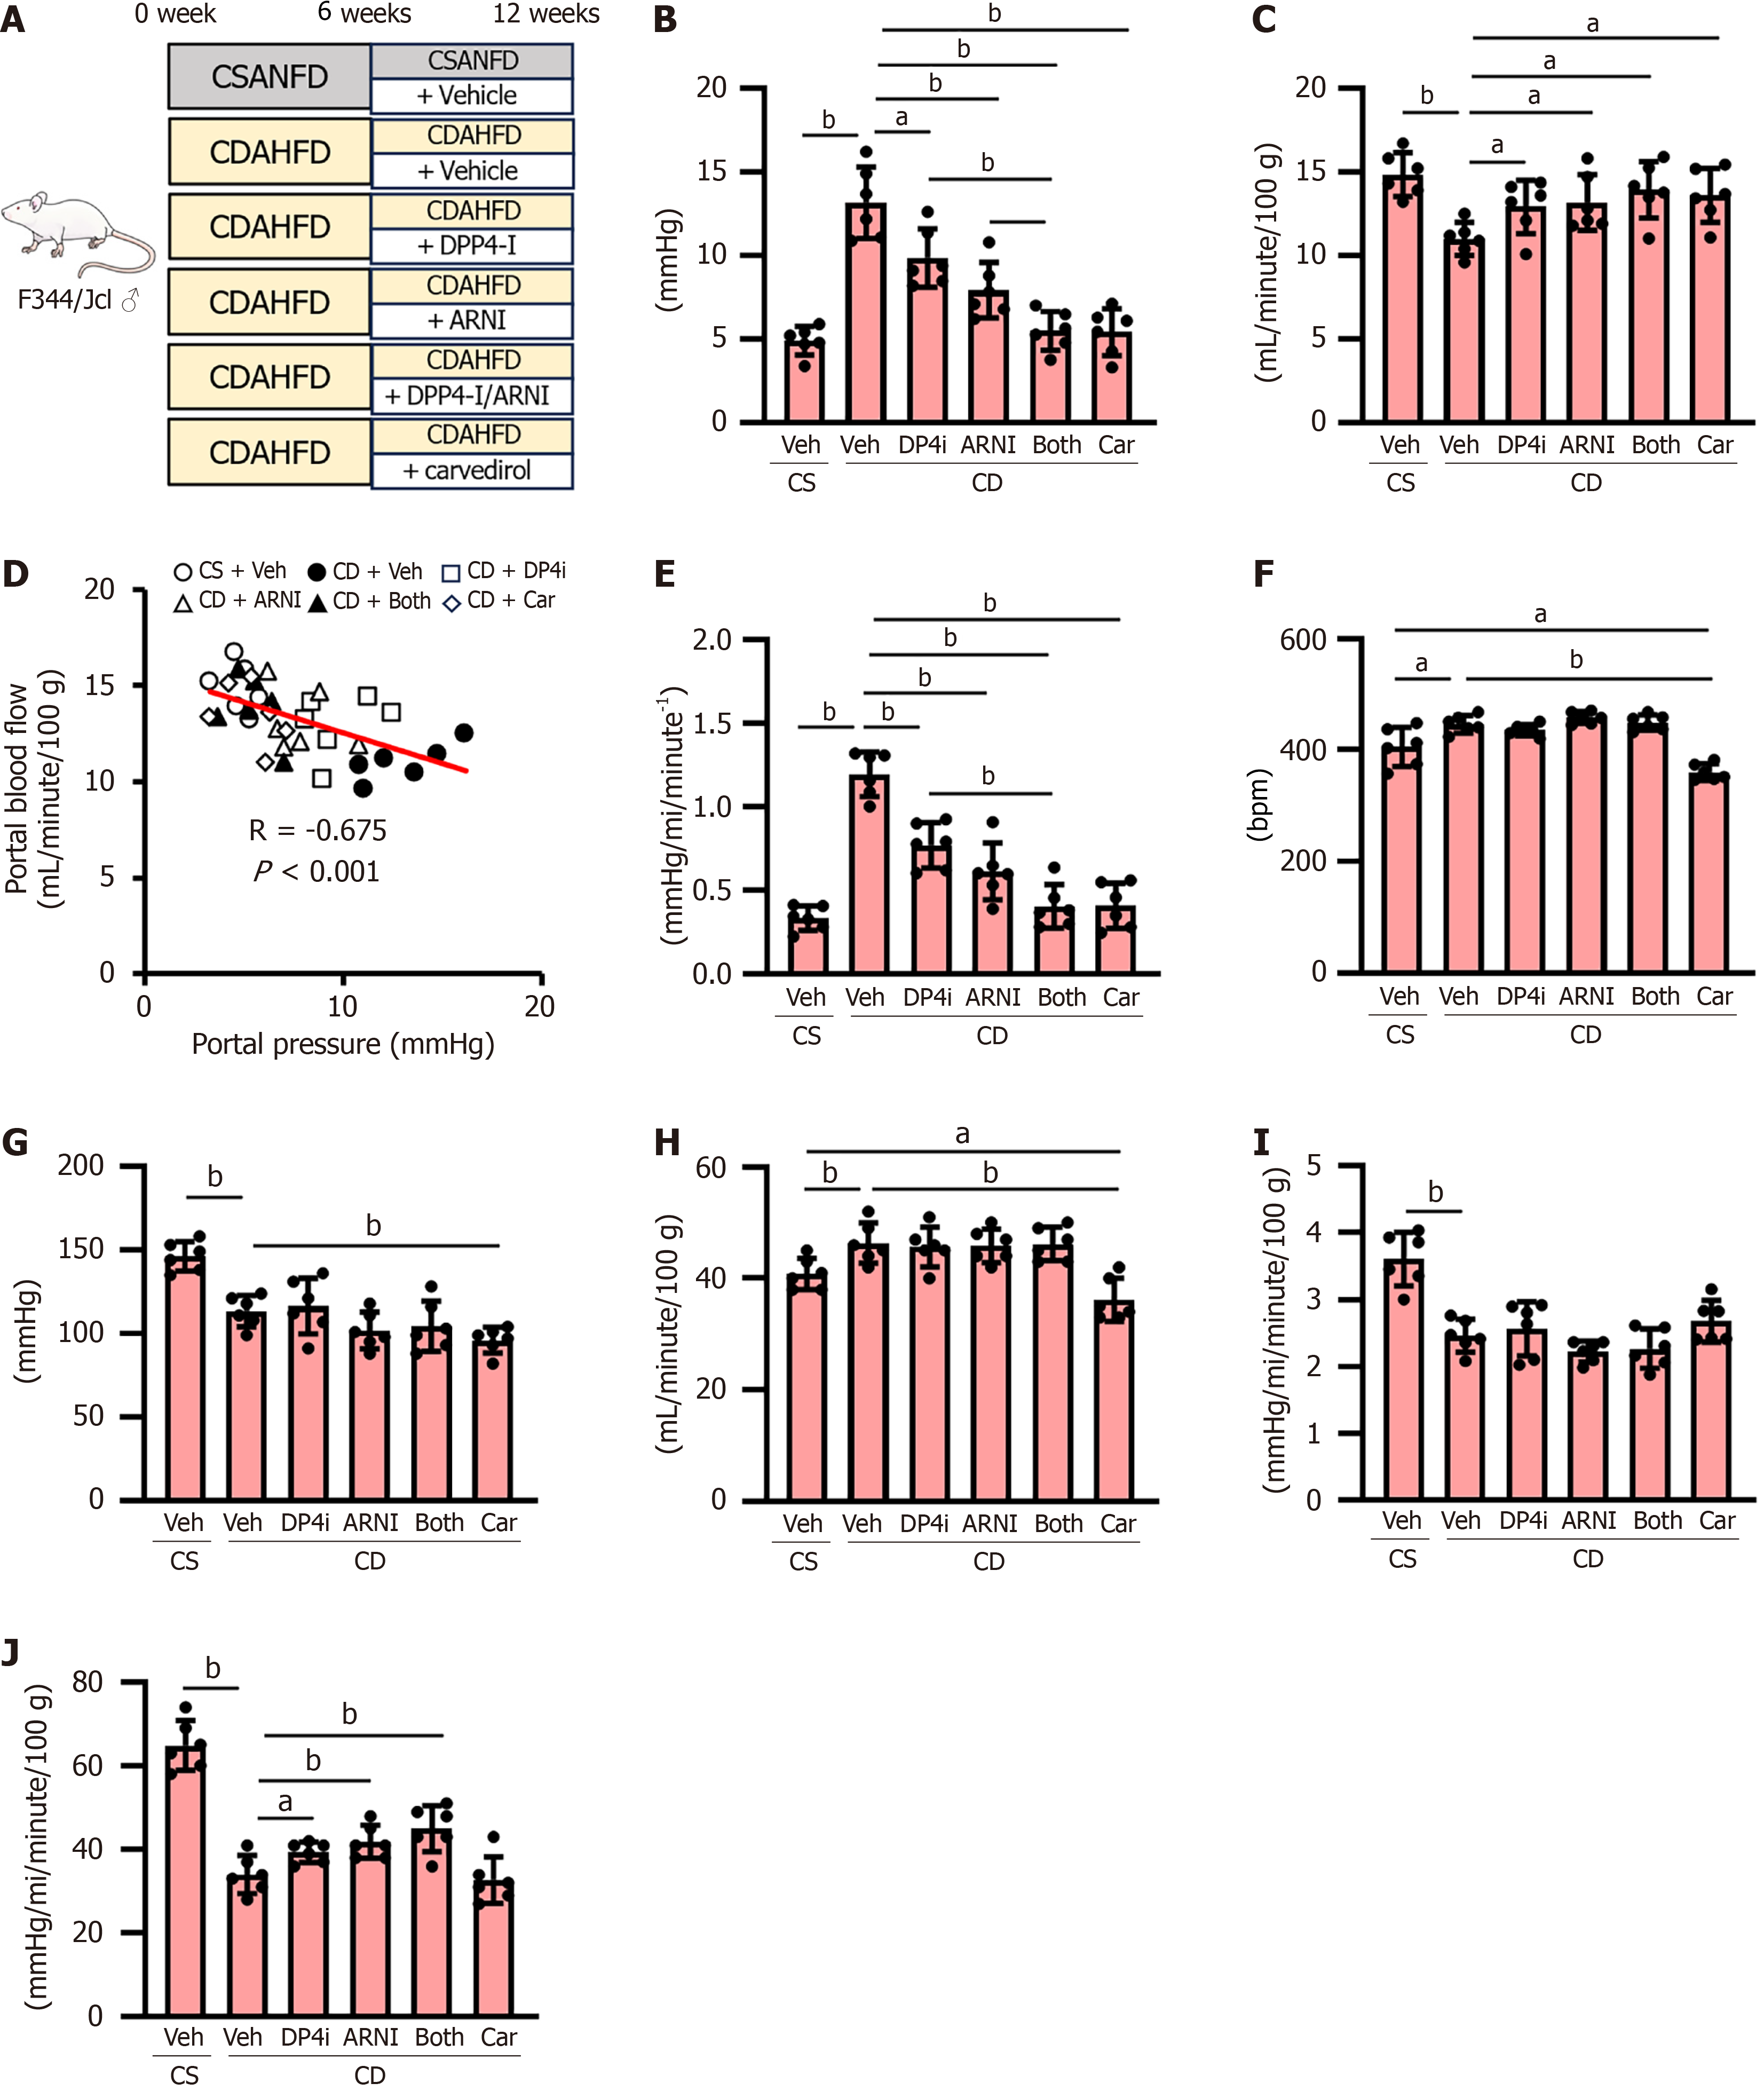
Figure 1 Portal and systemic hemodynamics in choline-deficient, L-amino acid-defined, high-fat diet-fed rats.
A: Experimental design of choline-deficient, L-amino acid-defined, high-fat diet-fed rats; B and C: Portal vein pressure (B) and portal blood flow (C) at the end of experiment; D: Pearson’s correlation between portal vein pressure and portal blood flow in all of experimental rats; E: Intrahepatic vascular resistance (calculated as portal vein pressure/portal blood flow); F-H: Heart rates (F), mean arterial pressure (G), and cardiac index (H) (calculated as cardiac output/100 g body weight) at the end of experiment; I: Systemic vascular resistance (calculated as mean arterial pressure/cardiac index); J: Superior mesenteric artery (SMA) resistance (calculated as mean arterial pressure/SMA blood flow). Data are the mean ± SD (n = 6). aP < 0.05. bP < 0.01. Significant difference between groups determined by Student’s t-test. CSANFD: Choline-supplemented L-amino acid-defined, normal-fat diet; CDAHFD: Choline-deficient, L-amino acid-defined, high-fat diet; DPP4-I: Dipeptidyl peptidase-4 inhibitor; ARNI: Angiotensin receptor-neprilysin inhibitor; Veh: Vehicle (saline)-treated groups; DP4i: Dipeptidyl peptidase-4 inhibitor (vildagliptin)-treated group; Car: Carvedilol-treated group; ARNI group: Angiotensin receptor-neprilysin inhibitor (sacubitril/valsartan)-treated group; CS: Choline-supplemented L-amino acid-defined, normal-fat diet-fed group; CD: Choline-deficient, L-amino acid-defined, high-fat die-fed groups. “Both group” defined dipeptidyl peptidase-4 inhibitor and angiotensin receptor-neprilysin inhibitor-treated group.
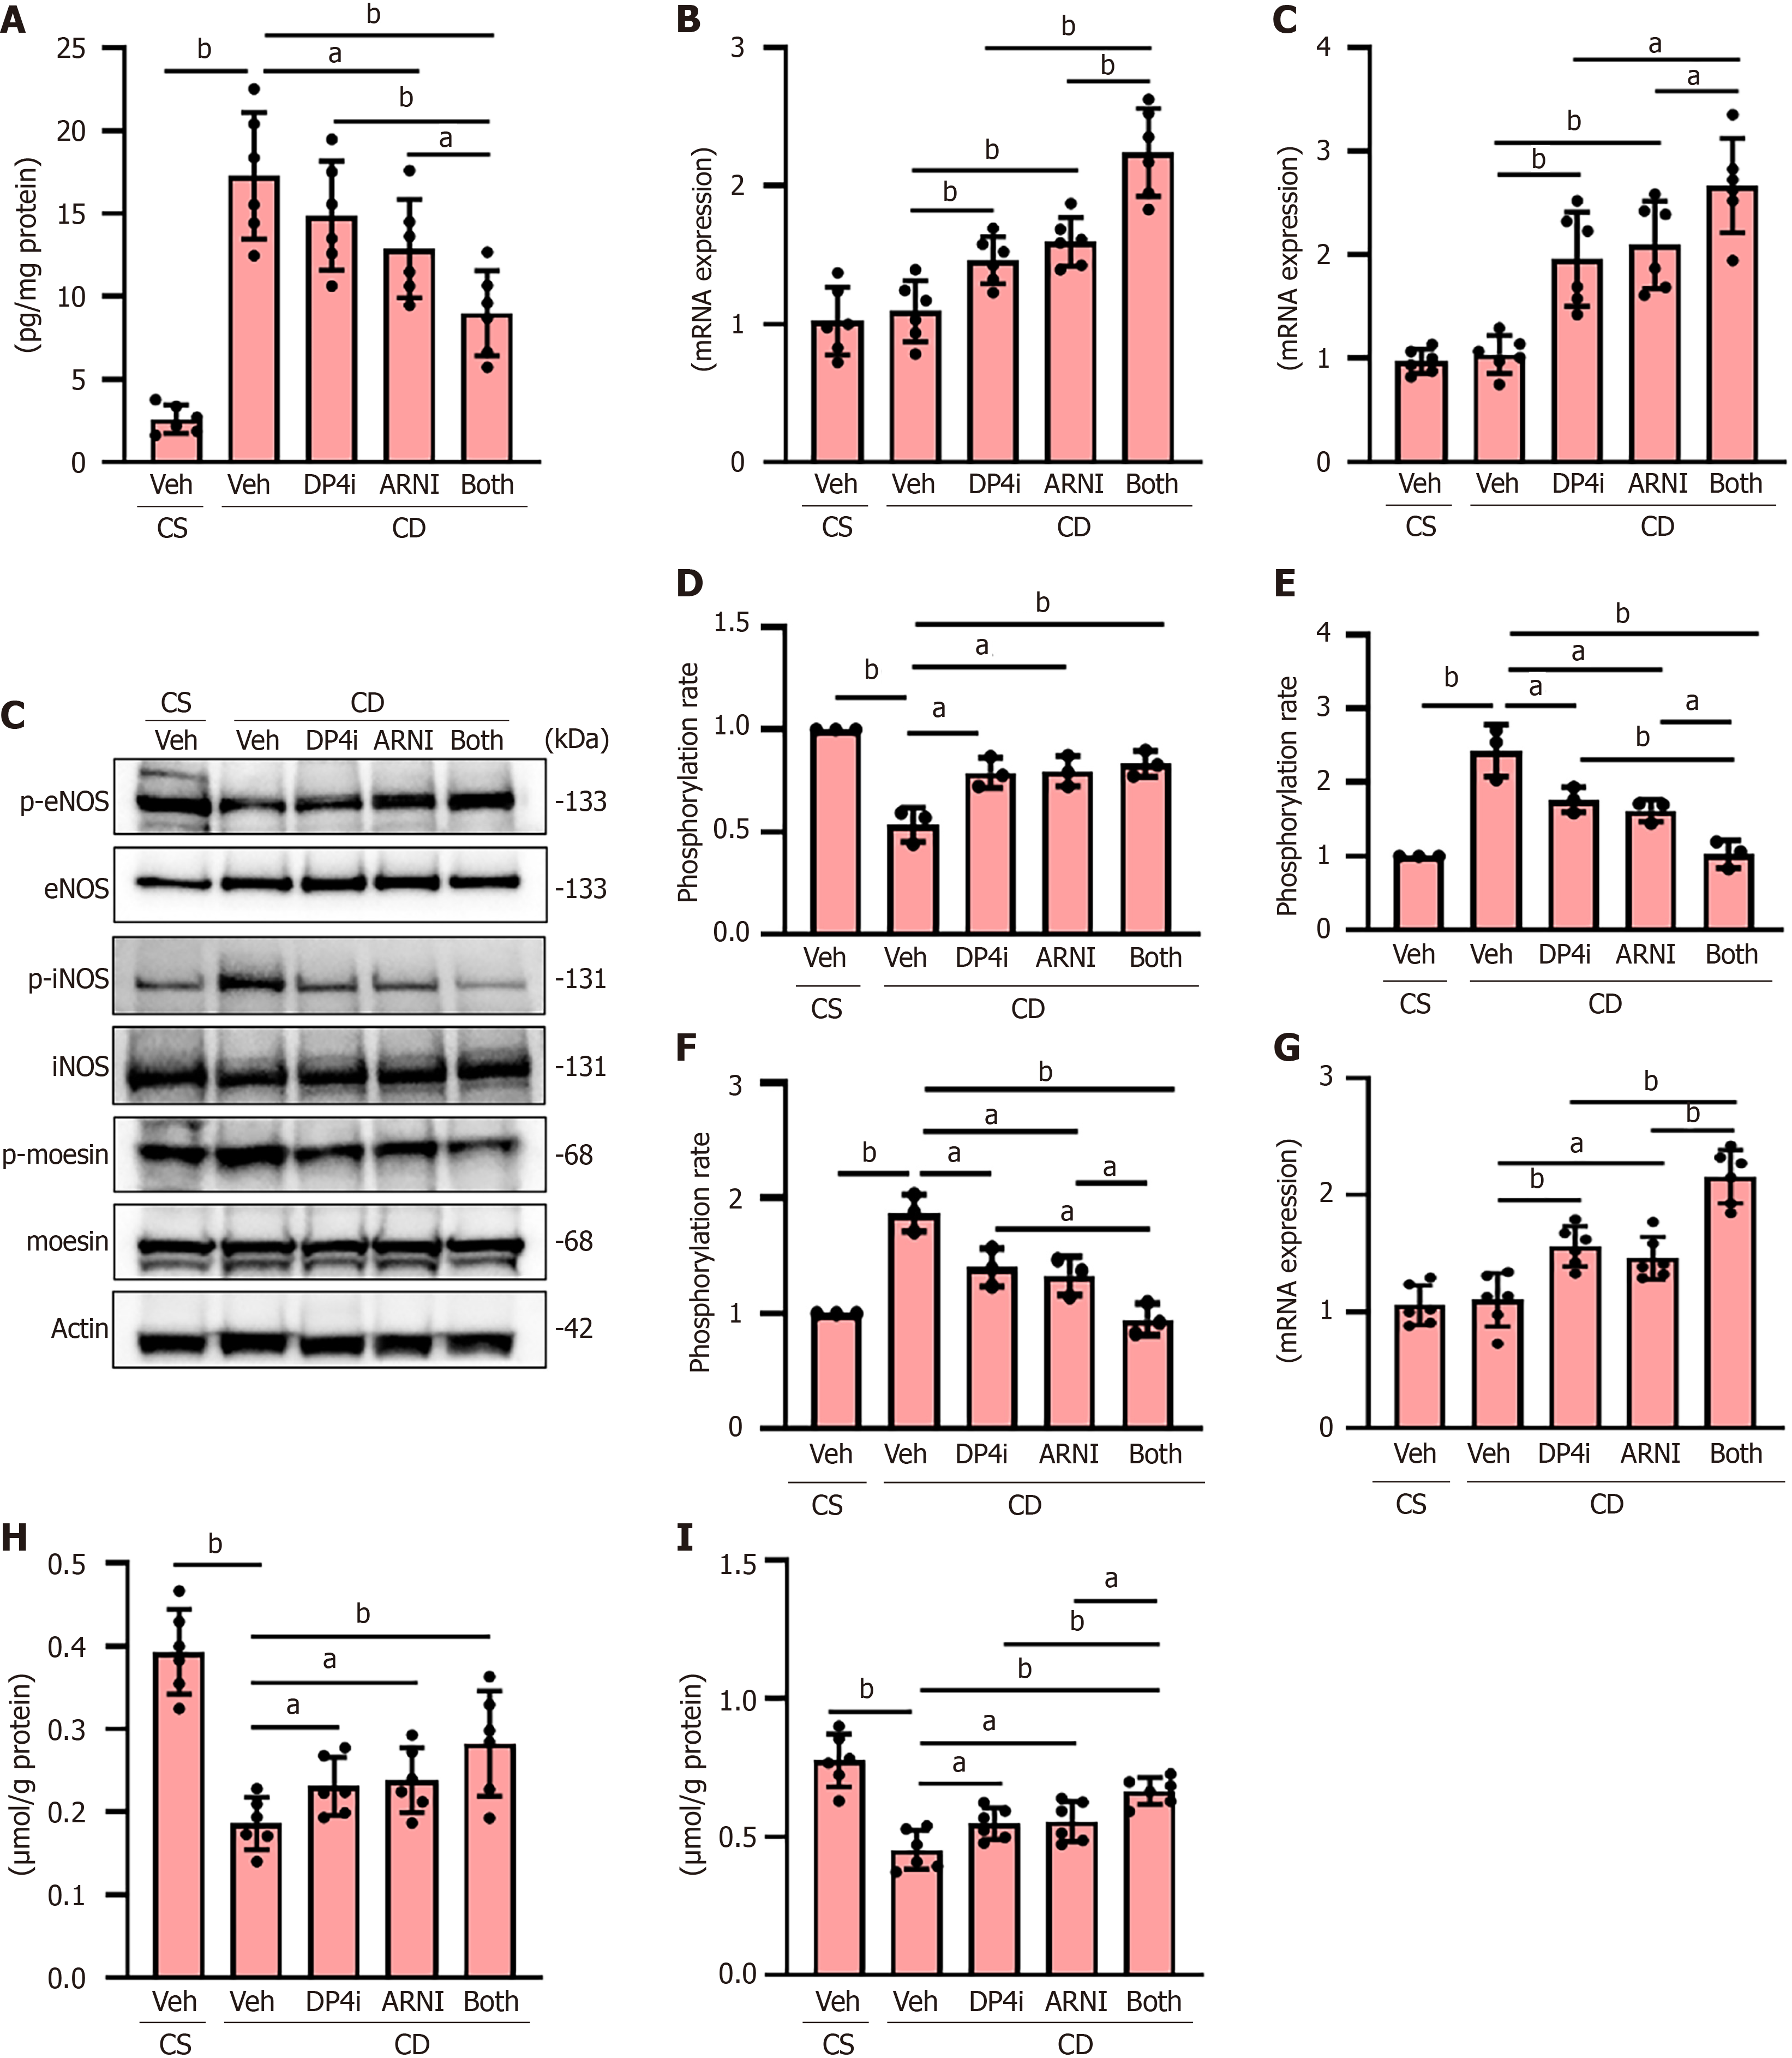
Figure 2 Intrahepatic vasoconstriction and vascular resistance in choline-deficient, L-amino acid-defined, high-fat diet-fed rats.
A: Hepatic level of endothelin-1; B: Hepatic message RNA (mRNA) levels of cystathionine γ-lyase and dimethylarginine dimethyl amino-hydrolase 1; C: Western blotting for the phosphorylation of endothelial nitric oxide (NO) synthase (eNOS), inducible NO synthase (iNOS) and moesin in liver tissues; D-F: Quantitative phosphorylation rate of phospho-eNOS/total eNOS (D), phospho-iNOS/total iNOS (E) and phospho-moesin/total moesin (F). Actin was used as the loading control; G: Hepatic mRNA levels of guanosine triphosphate cyclohydrolase 1; H: Hepatic level of NO (quantified as the total amount of nitrate and nitrite); I: Hepatic level of cyclic guanosine monophosphate. The mRNA expression levels were measured by quantitative real-time polymerase chain reaction, and glyceraldehyde-3-phosphate dehydrogenase was used as internal control. Quantitative values are indicated as fold changes to the values of choline-supplemented L-amino acid-defined, normal-fat diet-fed group + vehicle (saline)-treated group (B, D-G). Data are the mean ± SD (A, B, G-I: n = 6; D-F: n = 3). aP < 0.05. bP < 0.01. Significant difference between groups determined by Student’s t-test (A, B, G-I) or Mann-Whitney U test (D-F). mRNA: Message RNA; eNOS: Endothelial nitric oxide synthase; iNOS: Inducible nitric oxide synthase; p-eNOS: Phospho-endothelial nitric oxide synthase; p-iNOS: Phospho-inducible nitric oxide synthase; Veh: Vehicle (saline)-treated groups; DP4i: Dipeptidyl peptidase-4 inhibitor (vildagliptin)-treated group; ARNI group: Angiotensin receptor-neprilysin inhibitor (sacubitril/valsartan)-treated group; CS: Choline-supplemented L-amino acid-defined, normal-fat diet-fed group; CD: Choline-deficient, L-amino acid-defined, high-fat die-fed groups. “Both group” defined dipeptidyl peptidase-4 inhibitor and angiotensin receptor-neprilysin inhibitor-treated group.
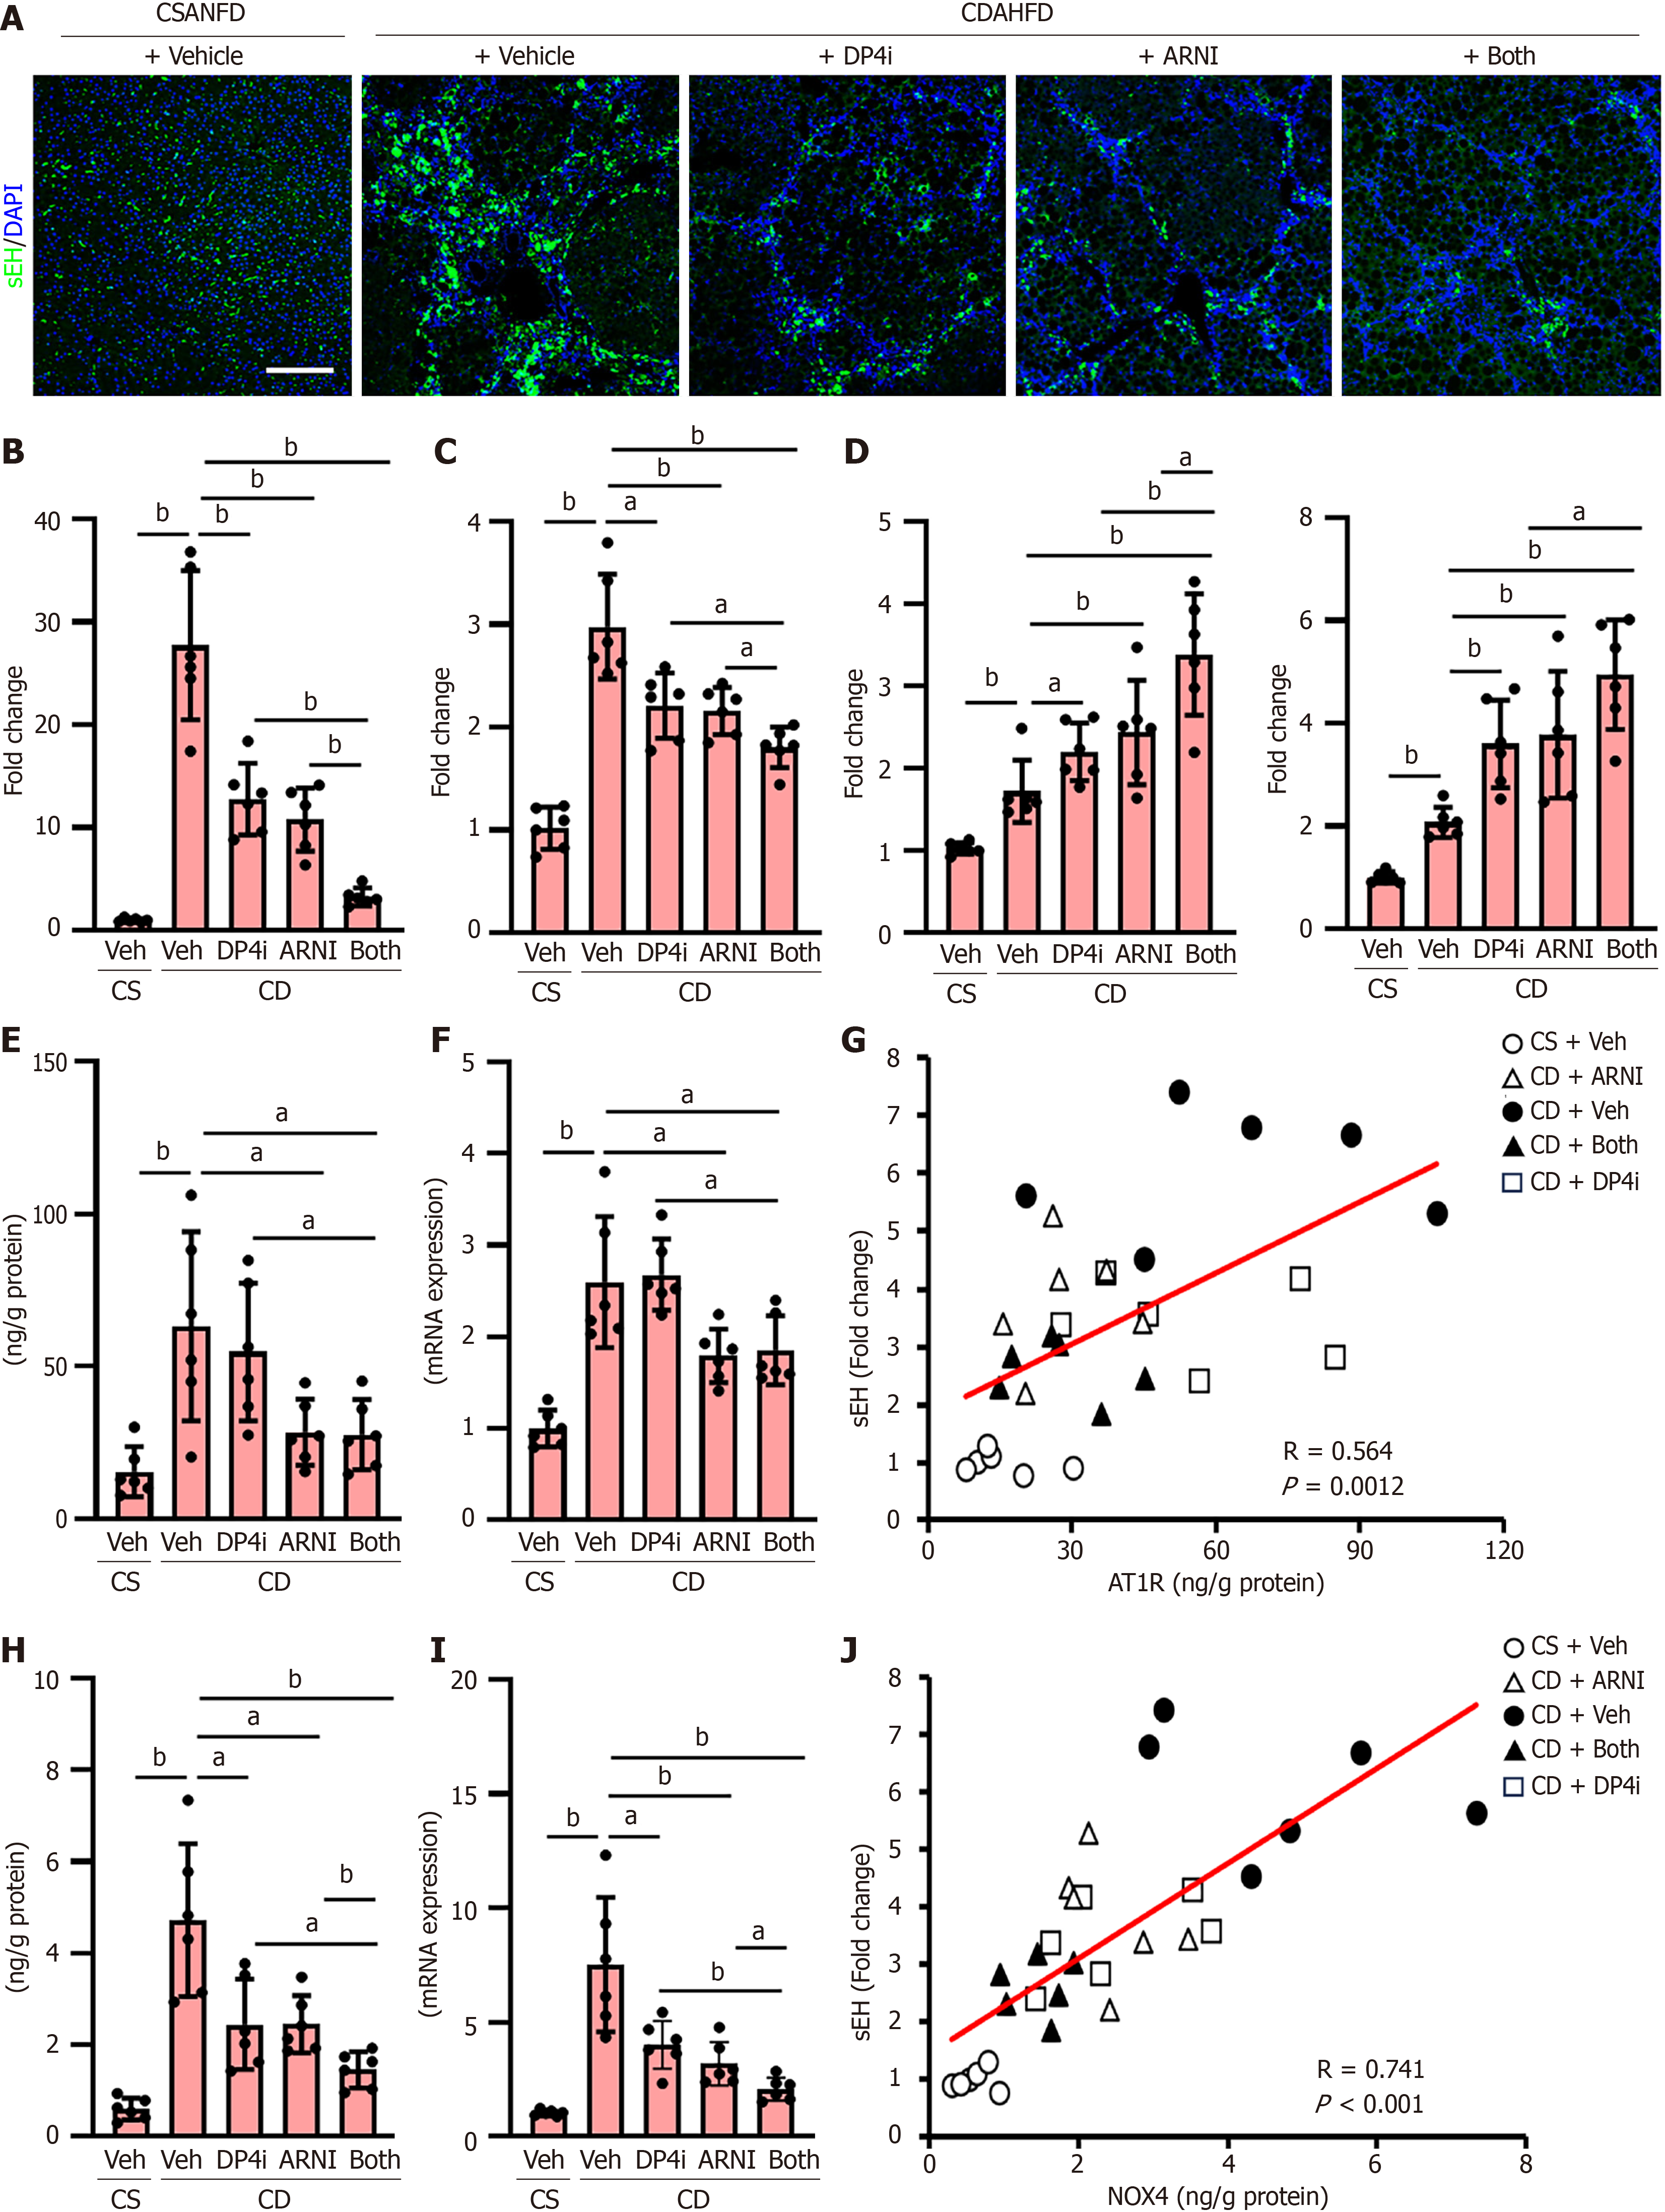
Figure 3 Hepatic soluble epoxide hydrolase status and epoxyeicosatrienoic acids level in choline-deficient, L-amino acid-defined, high-fat diet-fed rats.
A: Immunofluorescence with soluble epoxide hydrolase (sEH) in liver tissues. Scale bar: 50 μm. Nuclei were stained by 4’,6-diamidino-2-phenylindole; B: Quantification of sEH positive area in liver tissues; C: SEH activity in liver tissues; D: Hepatic levels of 11,12-epoxyeicosatrienoic acids (EET) and 14,15-EET; E and F: Protein (E) and message RNA (mRNA) (F) levels of angiotensin II receptor type 1 (AT1R) in liver tissues; G: Pearson’s correlation between sEH expression and AT1R protein level in all of experimental rats; H and I: Protein (H) and mRNA (I) levels of nicotinamide adenine dinucleotide phosphate hydrogen oxidase 4 (NOX4) in liver tissues; J: Pearson’s correlation between sEH expression and NOX4 protein level in all of experimental rats. The mRNA expression levels were measured by quantitative real-time polymerase chain reaction, and glyceraldehyde-3-phosphate dehydrogenase was used as internal control. Quantitative values are indicated as fold changes to the values of choline-supplemented L-amino acid-defined, normal-fat diet-fed group + vehicle (saline)-treated group (B-D, F, I). Data are the mean ± SD (n = 6, B-F, H, I). aP < 0.05. bP < 0.01. Significant difference between groups determined by Student’s t-test. mRNA: Message RNA; DAPI: 4’,6-diamidino-2-phenylindole; CSANFD: Choline-supplemented L-amino acid-defined, normal-fat diet; CDAHFD: Choline-deficient, L-amino acid-defined, high-fat diet; sEH: Soluble epoxide hydrolase; Veh: Vehicle (saline)-treated groups; DP4i: Dipeptidyl peptidase-4 inhibitor (vildagliptin)-treated group; ARNI group: Angiotensin receptor-neprilysin inhibitor (sacubitril/valsartan)-treated group; CS: Choline-supplemented L-amino acid-defined, normal-fat diet-fed group; CD: Choline-deficient, L-amino acid-defined, high-fat die-fed groups. “Both group” defined dipeptidyl peptidase-4 inhibitor and angiotensin receptor-neprilysin inhibitor-treated group.
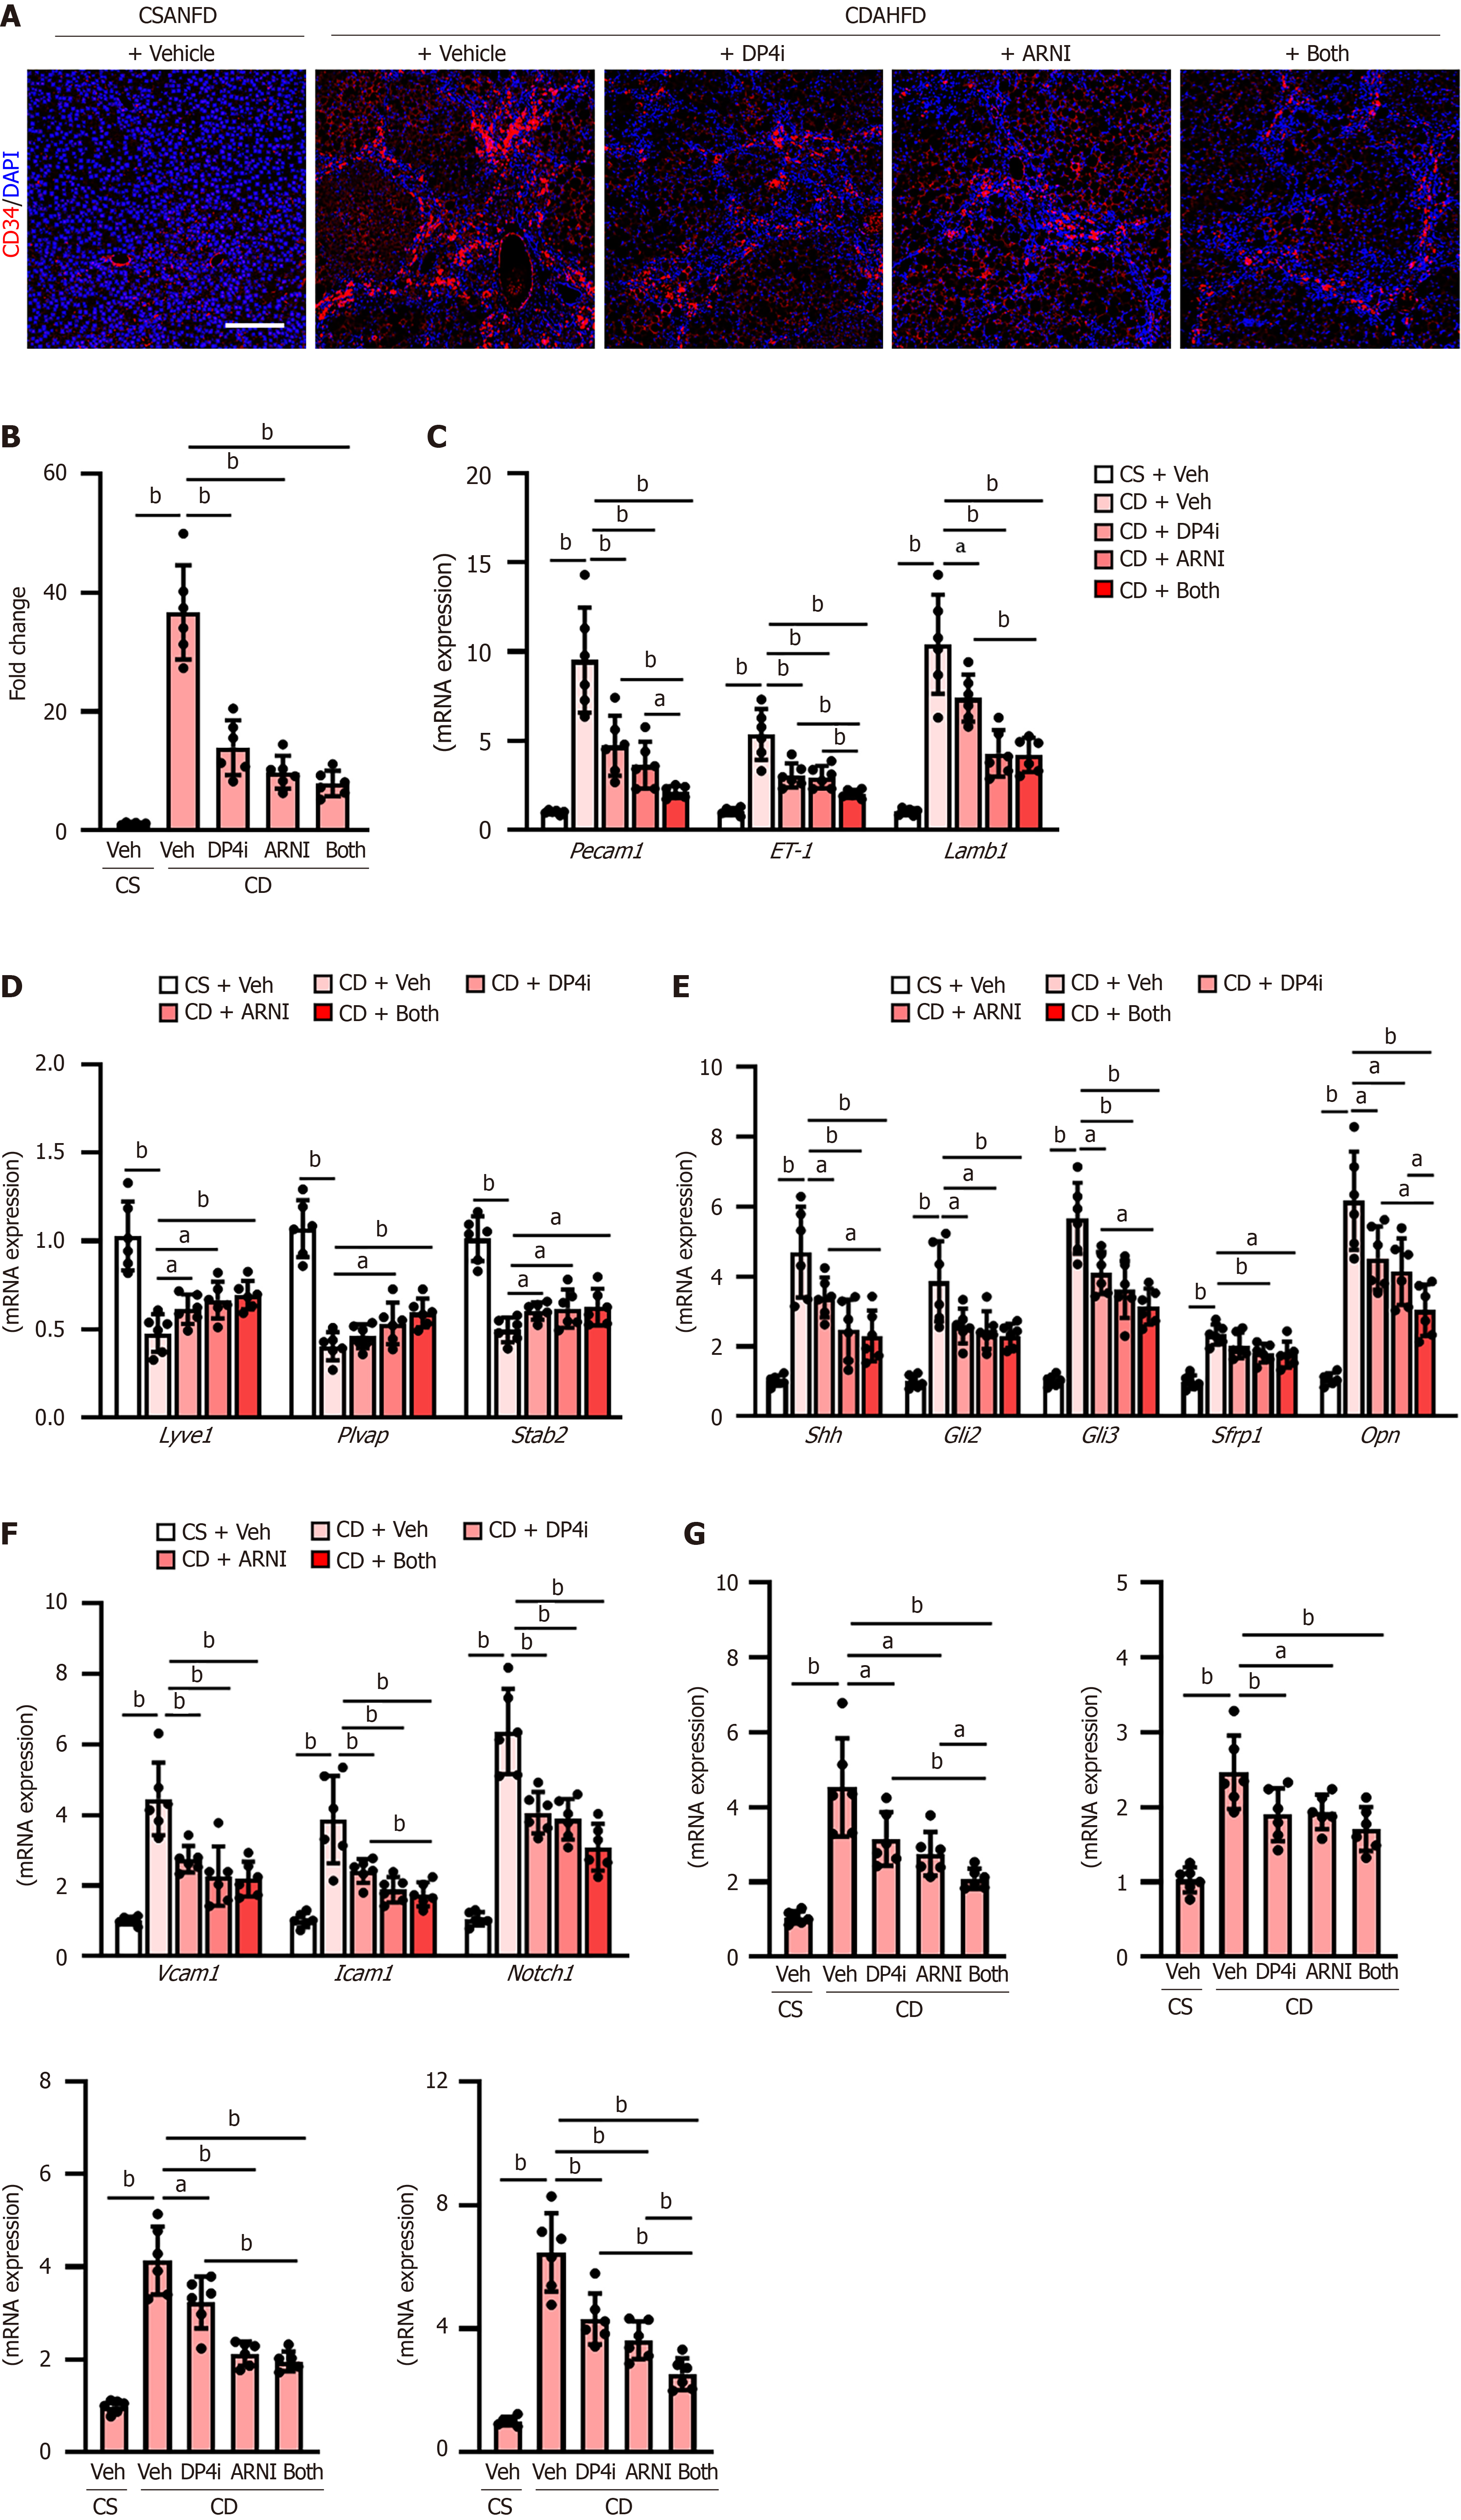
Figure 4 Sinusoidal capillarization and intrahepatic angiogenesis in choline-deficient, L-amino acid-defined, high-fat diet-fed rats.
A: Immunofluorescence with cluster of differentiation 34 in liver tissues. Scale bar: 50 μm. Nuclei were stained by 4’,6-diamidino-2-phenylindole; B: Quantification of cluster of differentiation 34-positive sinusoidal capillarization; C: Hepatic message RNA (mRNA) levels of capillary markers (platelet endothelial cell adhesion molecule-1, endothelin-1 and laminin subunit beta-1); D: Hepatic mRNA levels of sinusoidal endothelial markers (lymphatic vessel endothelial hyaluronan receptor 1, plasmalemma vesicle-associated protein and stabilin-2; E: Hepatic mRNA levels of Hedgehog signaling-related genes (Shh, Gli2, Gli3, Sfrp1 and Opn); F: Hepatic mRNA levels of genes related to vascular injury (vascular cell adhesion molecule 1, intercellular adhesion molecule 1, and neurogenic locus notch homolog protein 1); G: Hepatic mRNA levels of proangiogenic factors (Vegfa, Ptgs2, Pigf and Vwf). The mRNA expression levels were measured by quantitative real-time polymerase chain reaction, and glyceraldehyde-3-phosphate dehydrogenase was used as internal control. Quantitative values are indicated as fold changes to the values of choline-supplemented L-amino acid-defined, normal-fat diet-fed group + vehicle (saline)-treated group (B-G). Data are the mean ± SD (n = 6, B-G). aP < 0.05; bP < 0.01. Significant difference between groups determined by Student’s t-test. CD34: Cluster of differentiation 34; mRNA: Message RNA; DAPI: 4’,6-diamidino-2-phenylindole; CSANFD: Choline-supplemented L-amino acid-defined, normal-fat diet; CDAHFD: Choline-deficient, L-amino acid-defined, high-fat diet; Pecam1: Platelet endothelial cell adhesion molecule-1; ET-1: Endothelin-1; Lamb1: Laminin subunit beta-1; Lyve1: Lymphatic vessel endothelial hyaluronan receptor 1; Plvap: Plasmalemma vesicle-associated protein; Stab2: Stabilin-2; Vcam1: Vascular cell adhesion molecule 1; Icam1: Intercellular adhesion molecule 1; Notch1: Neurogenic locus notch homolog protein 1; Veh: Vehicle (saline)-treated groups; DP4i: Dipeptidyl peptidase-4 inhibitor (vildagliptin)-treated group; ARNI group: Angiotensin receptor-neprilysin inhibitor (sacubitril/valsartan)-treated group; CS: Choline-supplemented L-amino acid-defined, normal-fat diet-fed group; CD: Choline-deficient, L-amino acid-defined, high-fat die-fed groups. “Both group” defined dipeptidyl peptidase-4 inhibitor and angiotensin receptor-neprilysin inhibitor-treated group.
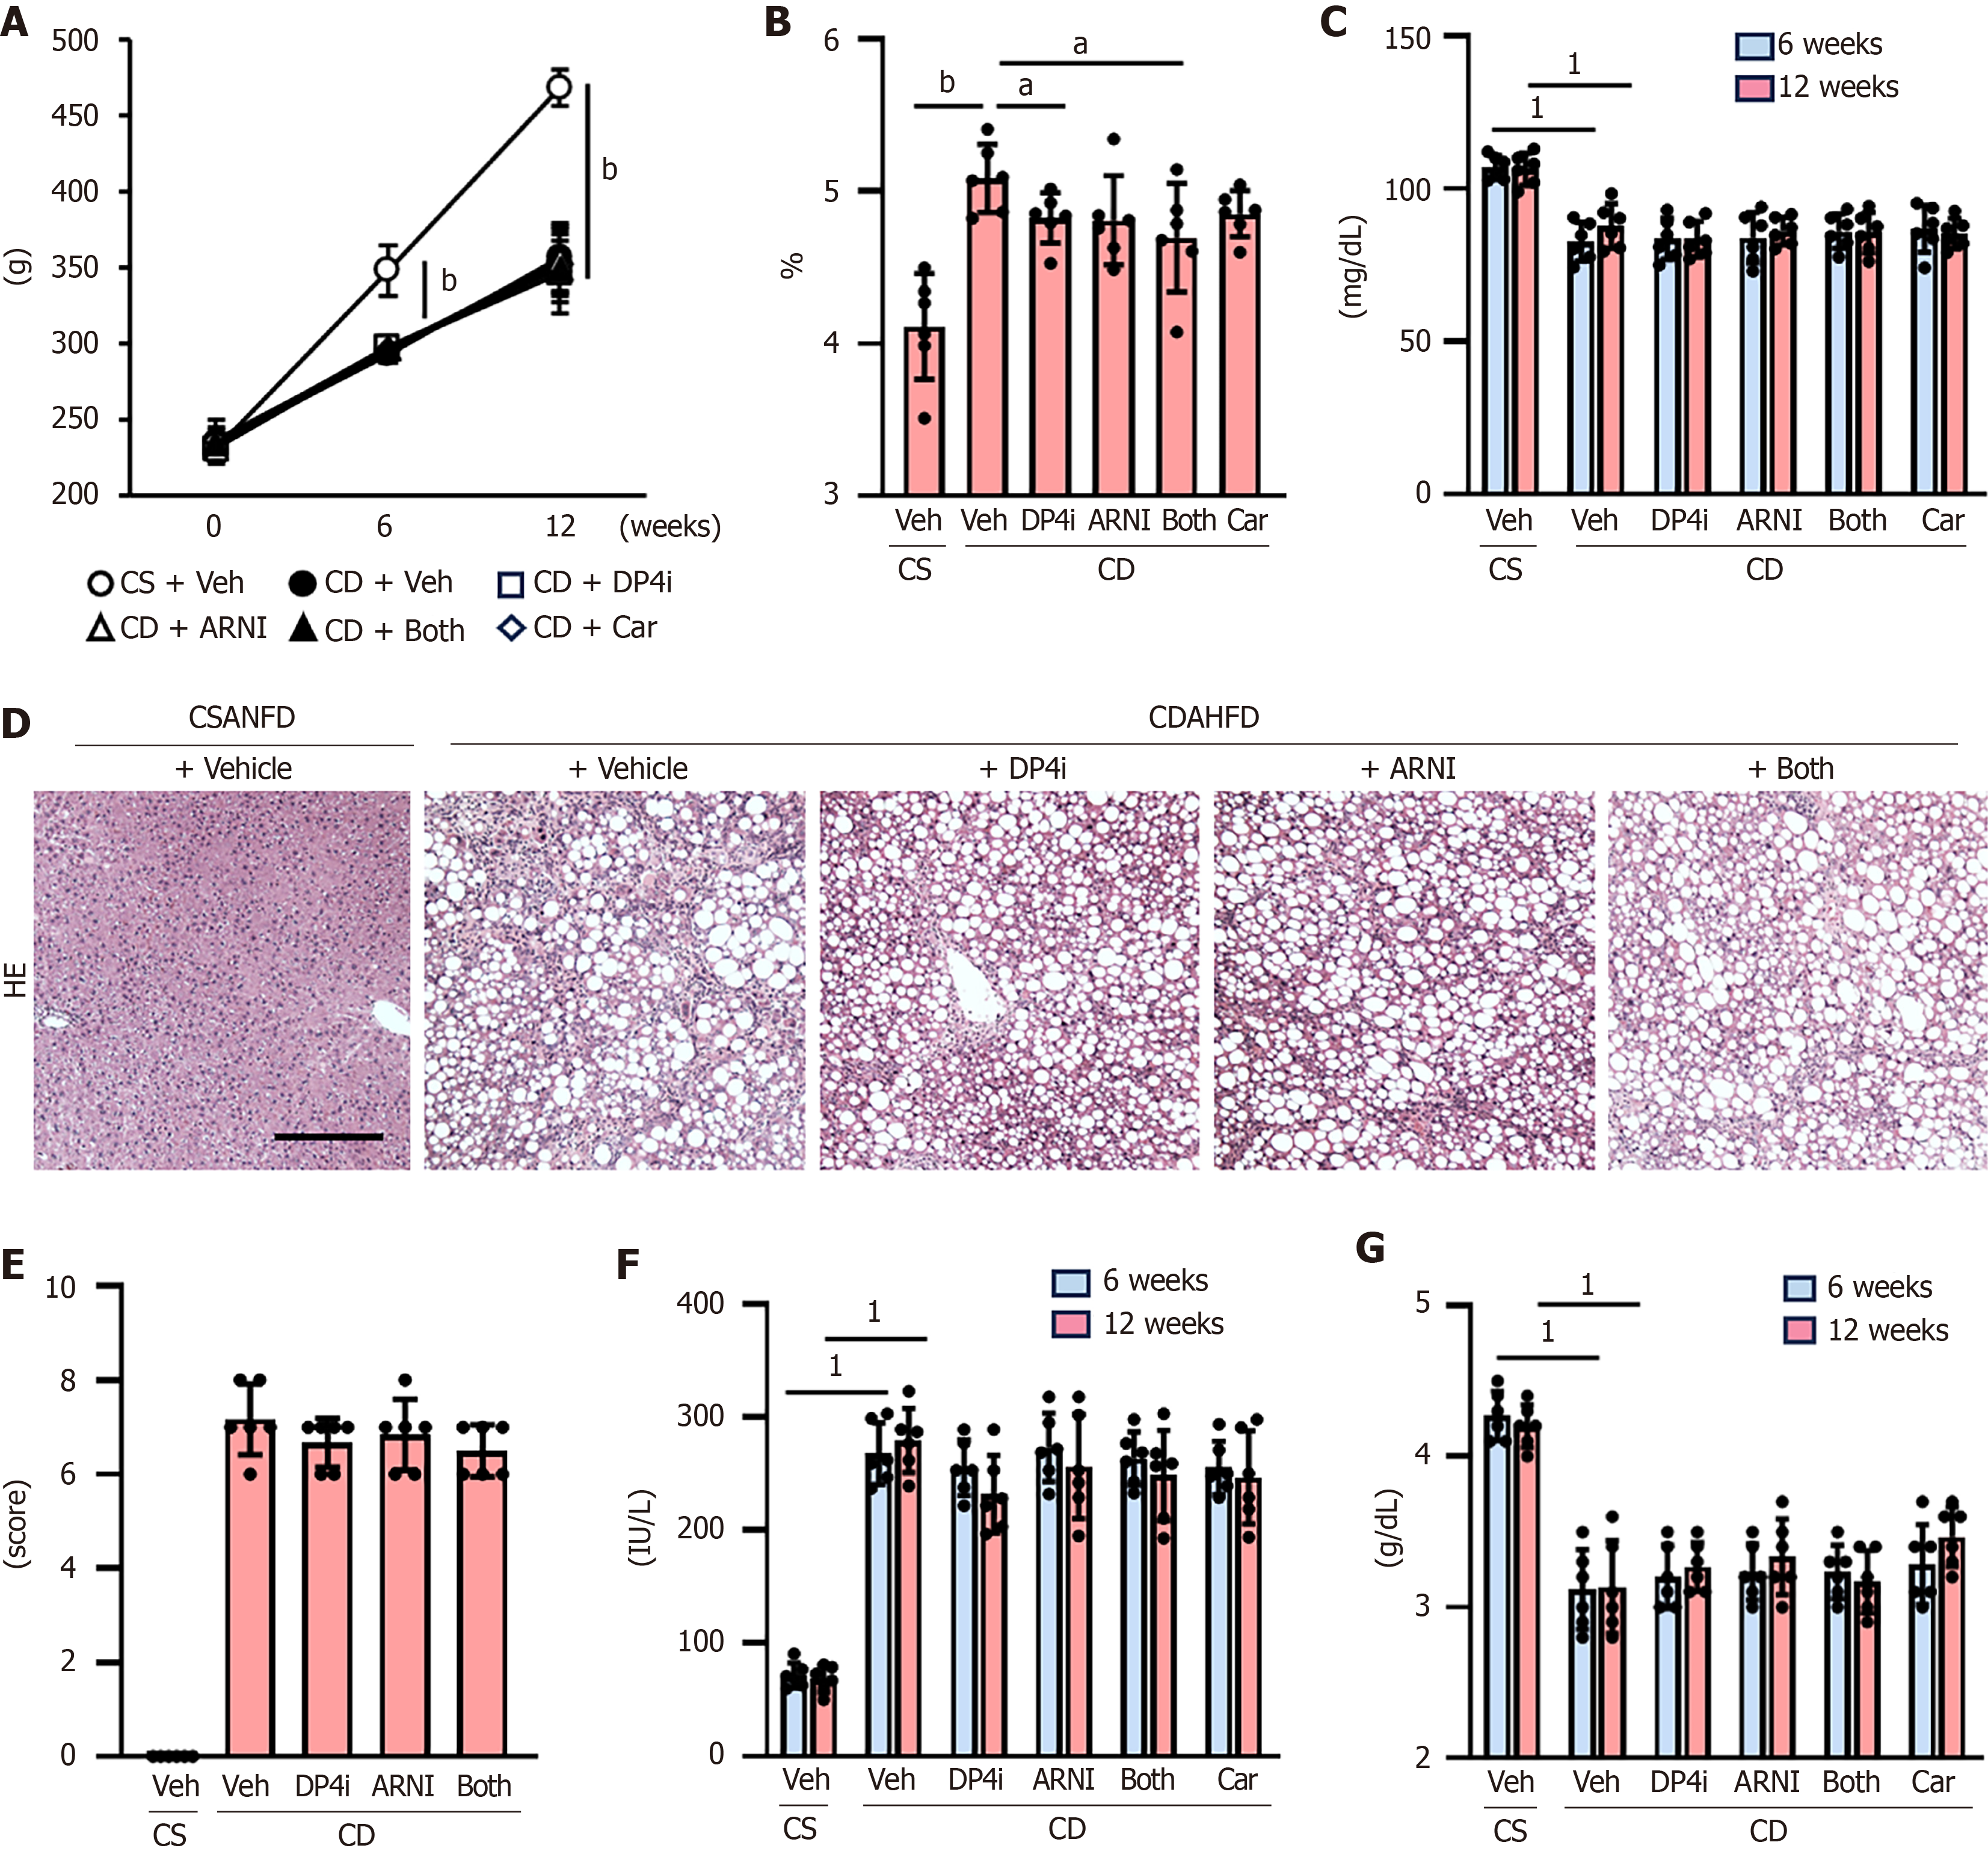
Figure 5 Glycemic status and steatohepatitis in choline-deficient, L-amino acid-defined, high-fat diet-fed rats.
A: Changes in the body weights during the experimental period; B: Liver/body weight at the end of experiment; C: Serum glucose levels after 6 and 12 weeks of the experiment; D: Hematoxylin and eosin (HE) staining in liver tissues. Scale bar: 50 μm; E: Non-alcoholic fatty liver disease activity score based on HE staining; F and G: Serum alanine aminotransferase and albumin levels after 6 and 12 weeks of the experiment. Data are the mean ± SD (n = 6, A-C, E-G). aP < 0.05; bP < 0.01. 1P vs choline-supplemented L-amino acid-defined, normal-fat diet-fed group + vehicle (saline)-treated group at 12 weeks (C, F and G) determined by Student’s t-test. Significant difference between groups (A and B). CSANFD: Choline-supplemented L-amino acid-defined, normal-fat diet; CDAHFD: Choline-deficient, L-amino acid-defined, high-fat diet; HE: Hematoxylin and eosin; Veh: Vehicle (saline)-treated groups; DP4i: Dipeptidyl peptidase-4 inhibitor (vildagliptin)-treated group; Car: Carvedilol-treated group; ARNI group: Angiotensin receptor-neprilysin inhibitor (sacubitril/valsartan)-treated group; CS: Choline-supplemented L-amino acid-defined, normal-fat diet-fed group; CD: Choline-deficient, L-amino acid-defined, high-fat die-fed groups. “Both group” defined dipeptidyl peptidase-4 inhibitor and angiotensin receptor-neprilysin inhibitor-treated group.
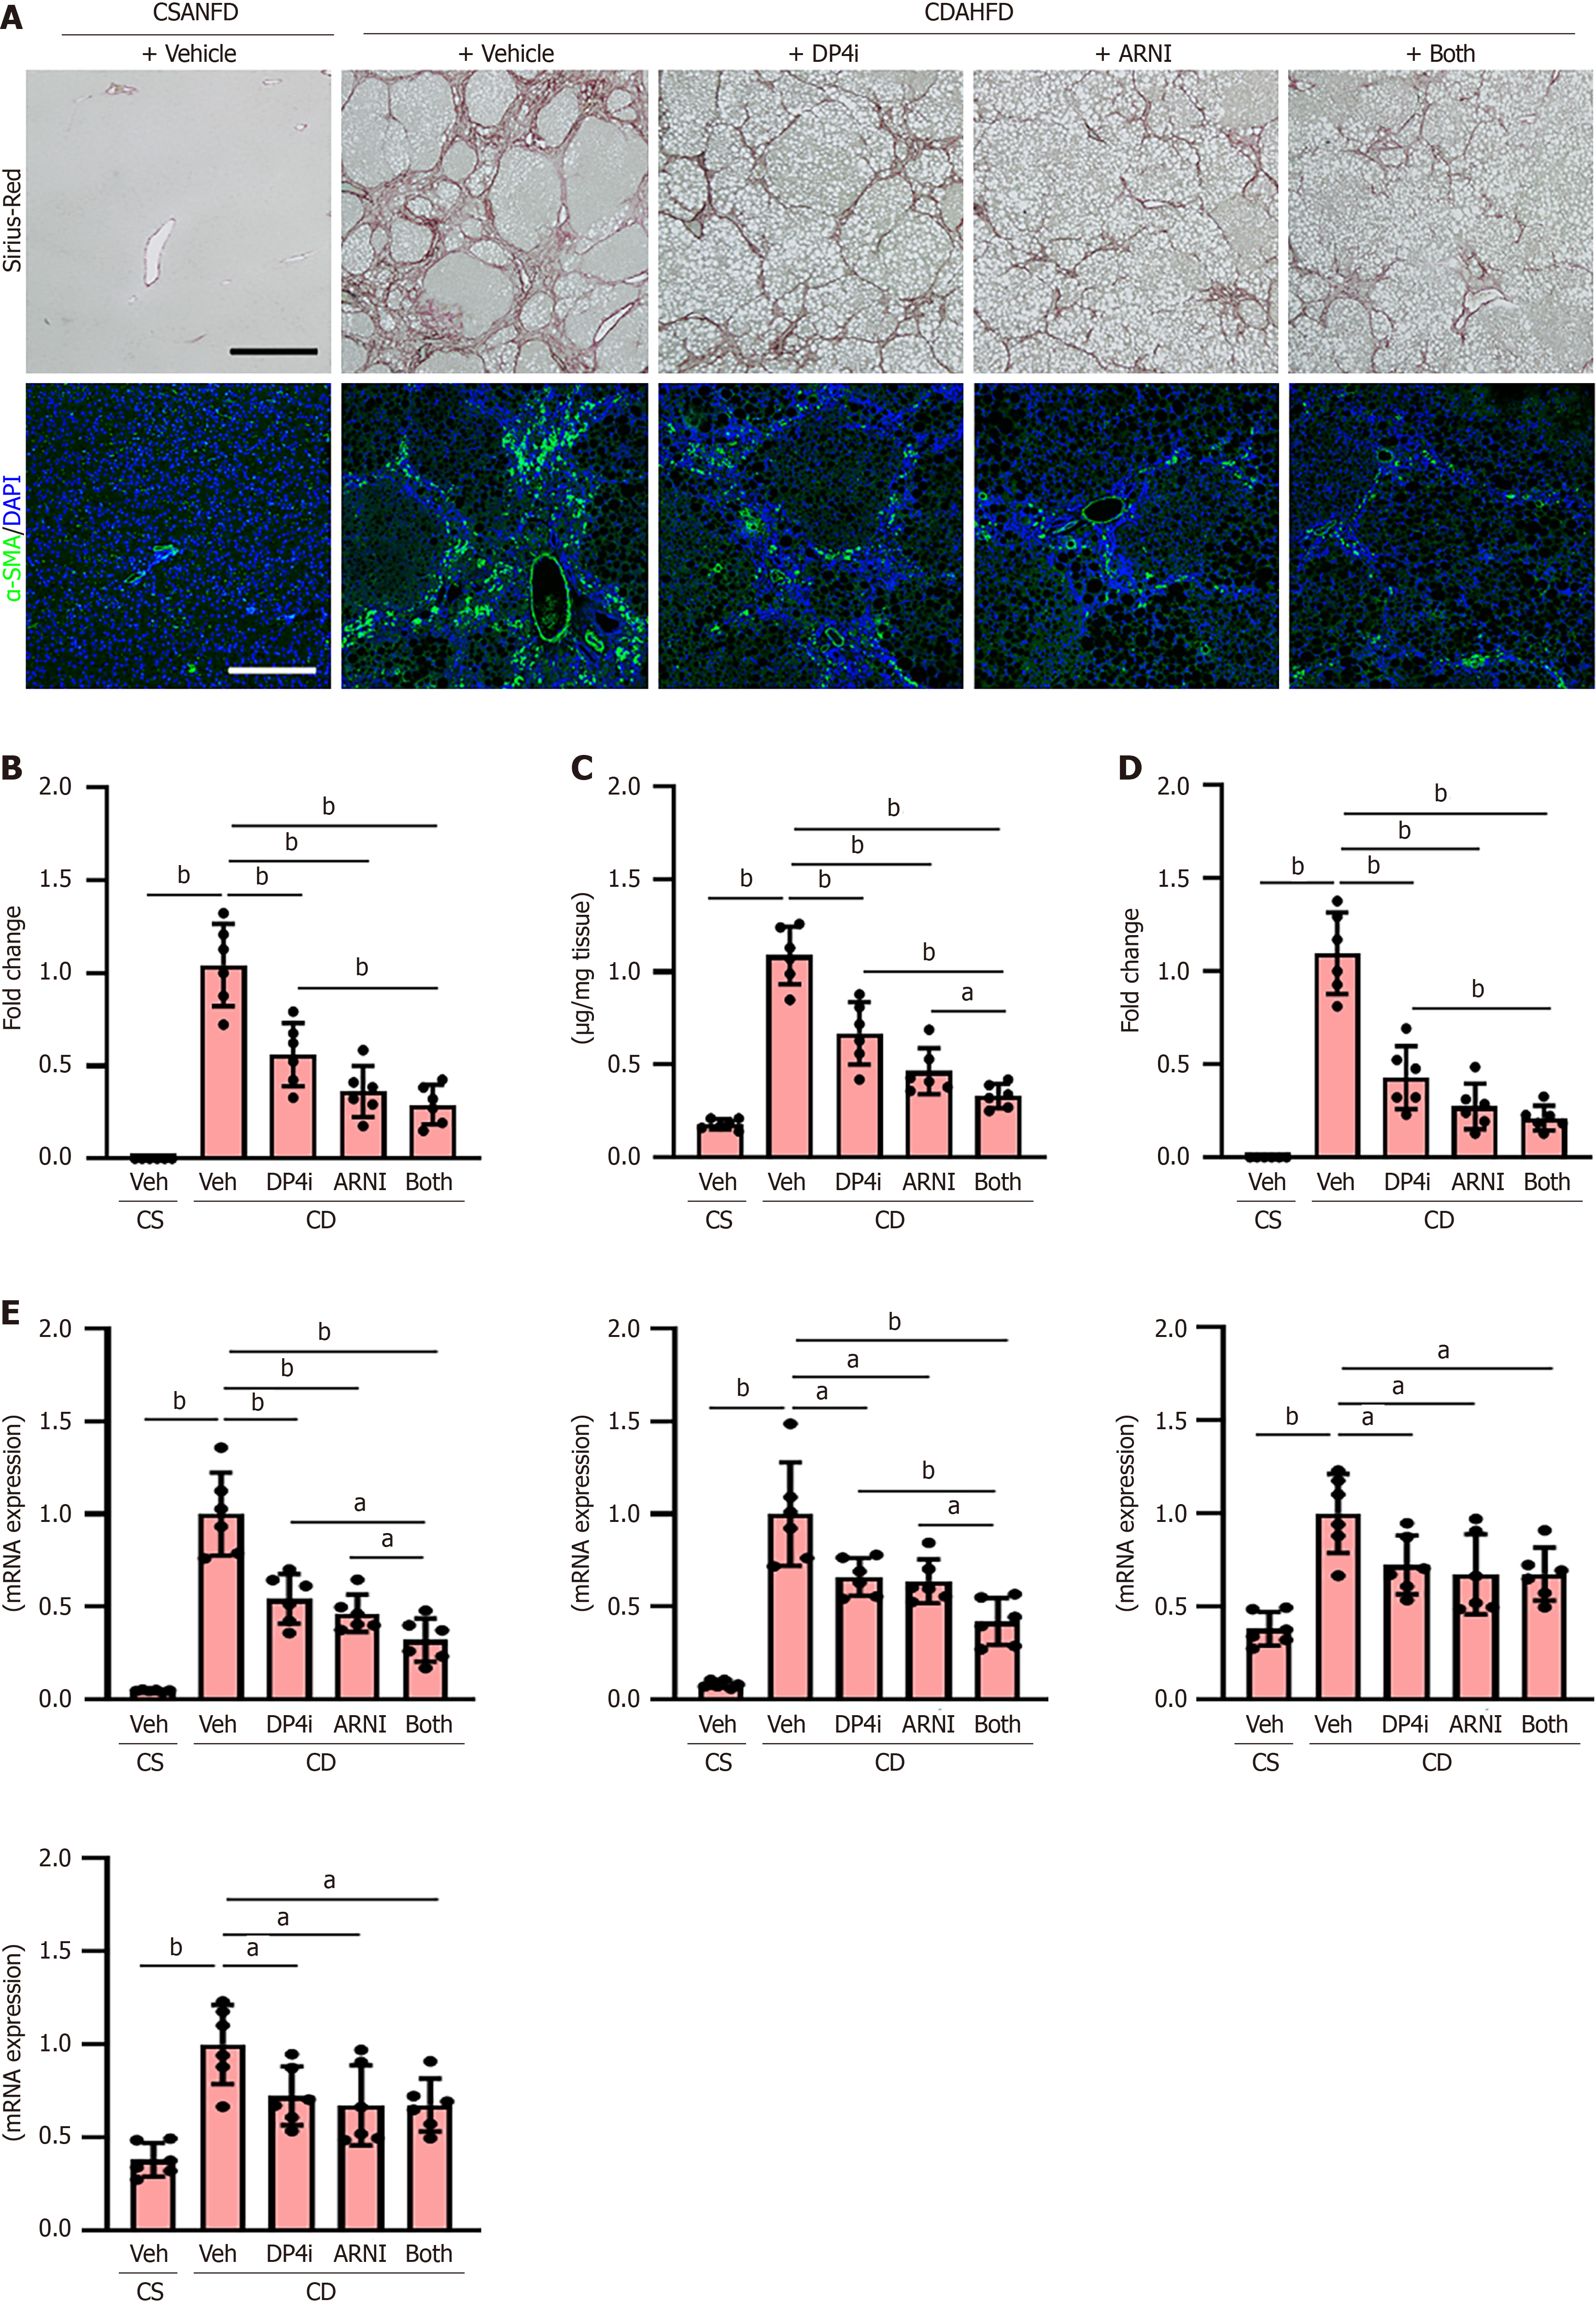
Figure 6 Hepatic fibrosis development in choline-deficient, L-amino acid-defined, high-fat diet-fed rats.
A: Sirius-red staining and immunofluorescence with alpha-smooth muscle actin (α-SMA) in liver tissues. Scale bar: 50 μm. Nuclei were stained by 4’,6-diamidino-2-phenylindole; B: Quantification of Sirius-red-stained fibrotic area; C: Hepatic content of hydroxyproline; D: Quantification of α-SMA-positive hepatic stellate cells; E: Hepatic message RNA (mRNA) levels of profibrogenic markers (Acta2, Col1a1, Tgfb1 and Ctgf). The mRNA expression levels were measured by quantitative real-time polymerase chain reaction, and glyceraldehyde-3-phosphate dehydrogenase was used as internal control. Quantitative values are indicated as fold changes to the values of choline-deficient, L-amino acid-defined, high-fat die-fed groups + vehicle (saline)-treated group (B, D and E). Data are the mean ± SD (n = 6, B-E). aP < 0.05. bP < 0.01. Significant difference between groups determined by Student’s t-test. CSANFD: Choline-supplemented L-amino acid-defined, normal-fat diet; CDAHFD: Choline-deficient, L-amino acid-defined, high-fat diet; mRNA: Message RNA; DAPI: 4’,6-diamidino-2-phenylindole; α-SMA: Alpha-smooth muscle actin; Veh: Vehicle (saline)-treated groups; DP4i: Dipeptidyl peptidase-4 inhibitor (vildagliptin)-treated group; ARNI group: Angiotensin receptor-neprilysin inhibitor (sacubitril/valsartan)-treated group; CS: Choline-supplemented L-amino acid-defined, normal-fat diet-fed group; CD: Choline-deficient, L-amino acid-defined, high-fat die-fed groups. “Both group” defined dipeptidyl peptidase-4 inhibitor and angiotensin receptor-neprilysin inhibitor-treated group.
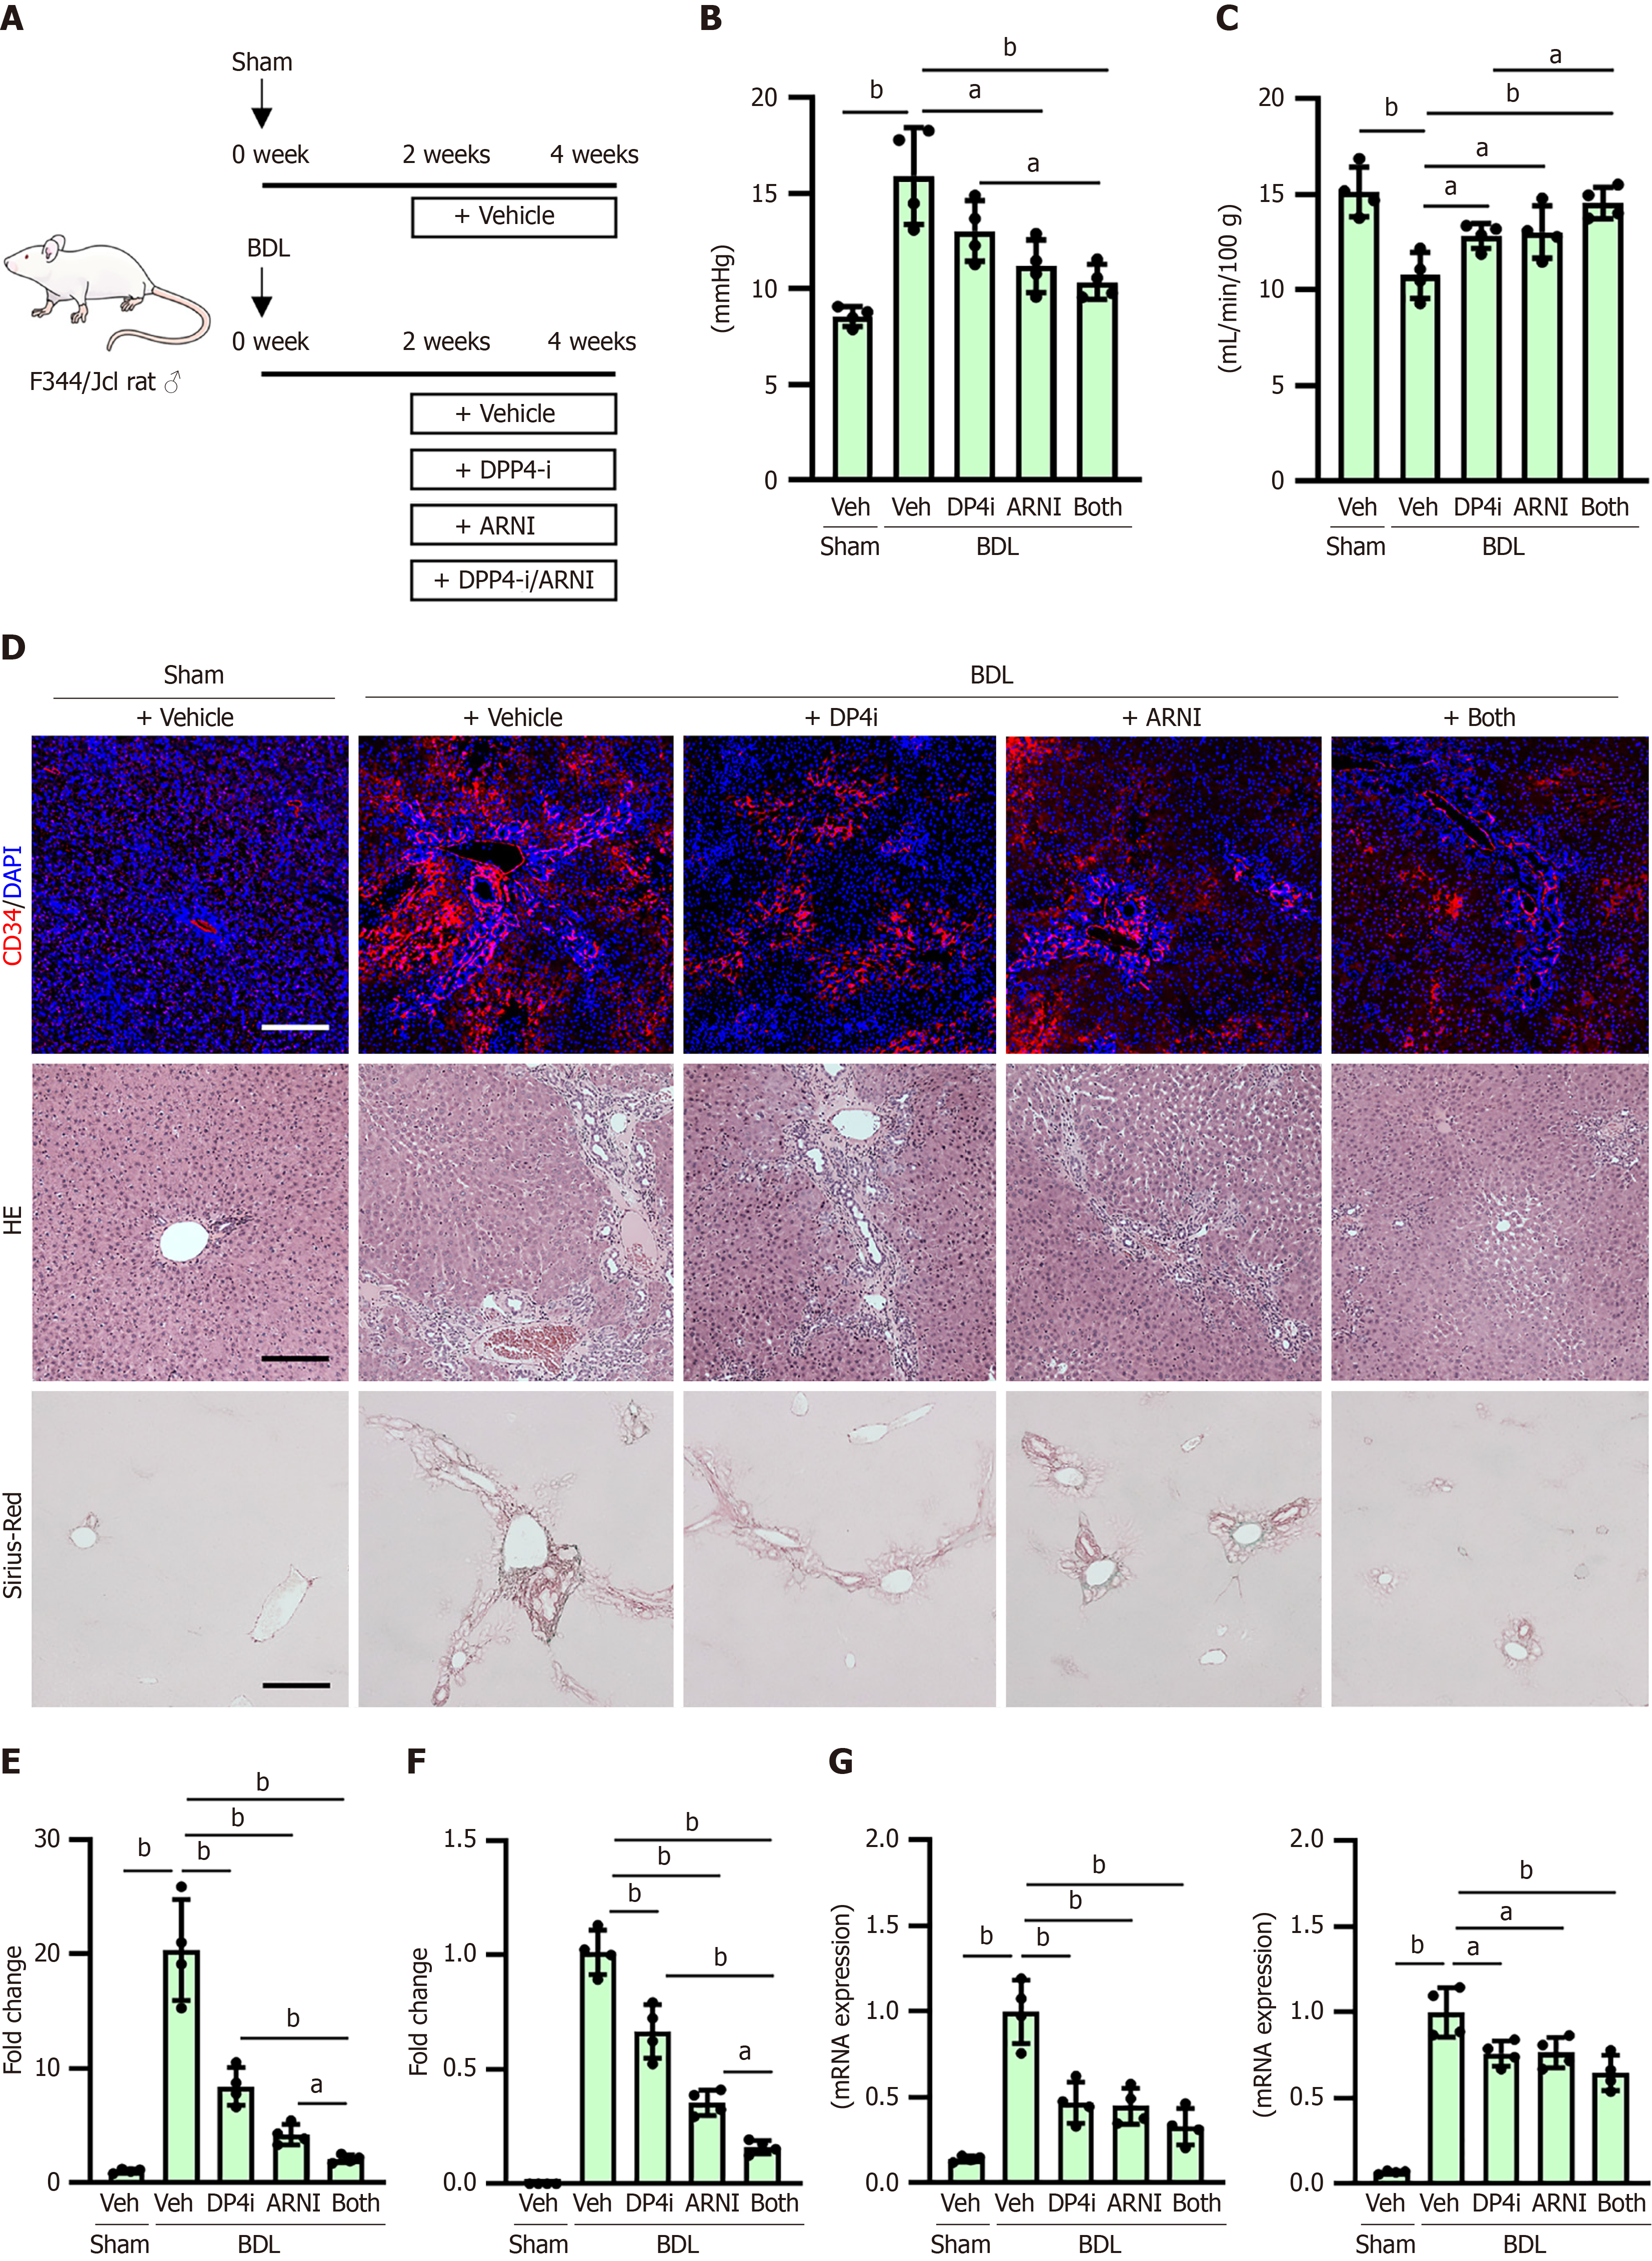
Figure 7 Portal pressure, sinusoidal capillarization and hepatic fibrosis in bile duct-ligated rats.
A: Experimental design of bile duct-ligated rats; B and C: Portal vein pressure (B) and portal blood flow (C) at the end of experiment; D: Immunofluorescence with cluster of differentiation 34, hematoxylin and eosin and Sirius-red staining in liver tissues; E: Quantification of cluster of differentiation 34-positive sinusoidal capillarization; F: Quantification of Sirius-red-stained fibrotic area; G: Hepatic message RNA (mRNA) levels of Acta2 and Col1a1. The mRNA expression levels were measured by quantitative real-time polymerase chain reaction, and glyceraldehyde-3-phosphate dehydrogenase was used as internal control. Quantitative values are indicated as fold changes to the values of sham-operated group + vehicle (saline)-treated group (E) or bile duct-ligated groups + vehicle (saline)-treated group (F and G). Data are the mean ± SD (n = 4, B, C and E-G). aP < 0.05; bP < 0.01. Significant difference between groups determined by Mann-Whitney U test. BDL: Bile duct-ligated; mRNA: Message RNA; DAPI: 4’,6-diamidino-2-phenylindole; CD34: Cluster of differentiation 34; HE: Hematoxylin and eosin; Sham: Sham-operated group; Veh: Vehicle (saline)-treated groups; DP4i: Dipeptidyl peptidase-4 inhibitor (vildagliptin)-treated group; ARNI group: Angiotensin receptor-neprilysin inhibitor (sacubitril/valsartan)-treated group; “Both group” defined dipeptidyl peptidase-4 inhibitor and angiotensin receptor-neprilysin inhibitor-treated group.
- Citation: Oyama M, Kaji K, Nishimura N, Hanatani J, Nakatani T, Nishimura N, Shibamoto A, Asada S, Tsuji Y, Kitagawa K, Sato S, Namisaki T, Yoshiji H. Dual therapy with vildagliptin and sacubitril/valsartan alleviates portal hypertension and inhibits soluble epoxide hydrolase in cirrhotic rats. World J Gastroenterol 2025; 31(33): 109562
- URL: https://www.wjgnet.com/1007-9327/full/v31/i33/109562.htm
- DOI: https://dx.doi.org/10.3748/wjg.v31.i33.109562


