©The Author(s) 2021.
World J Gastroenterol. Oct 21, 2021; 27(39): 6615-6630
Published online Oct 21, 2021. doi: 10.3748/wjg.v27.i39.6615
Published online Oct 21, 2021. doi: 10.3748/wjg.v27.i39.6615
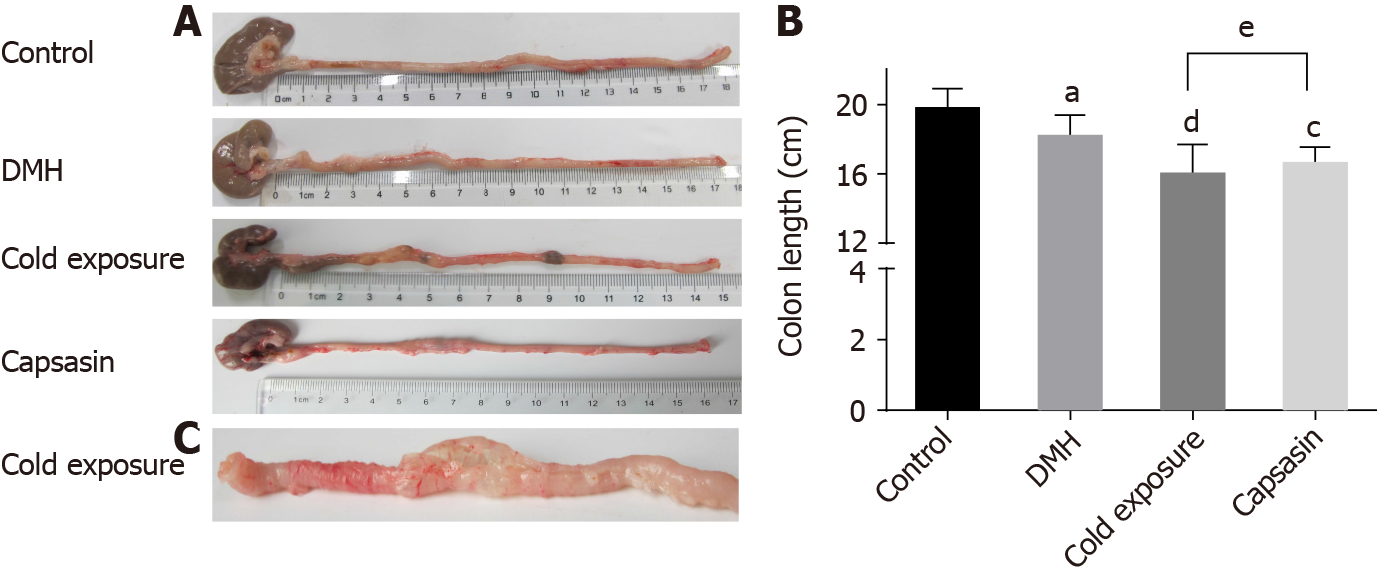
Figure 1 Colonic morphology of rats in different groups.
A and B: Changes in colon length and colonic morphology; C: Stiff colonic tissues in cold exposure group. aP < 0.05, control compared with 1,2-dimethylhyrazine (DMH); cP < 0.05, dP < 0.01, DMH compared with cold exposure and capsaicin-treated group; eP < 0.05, cold exposure compared with capsaicin-treated group.
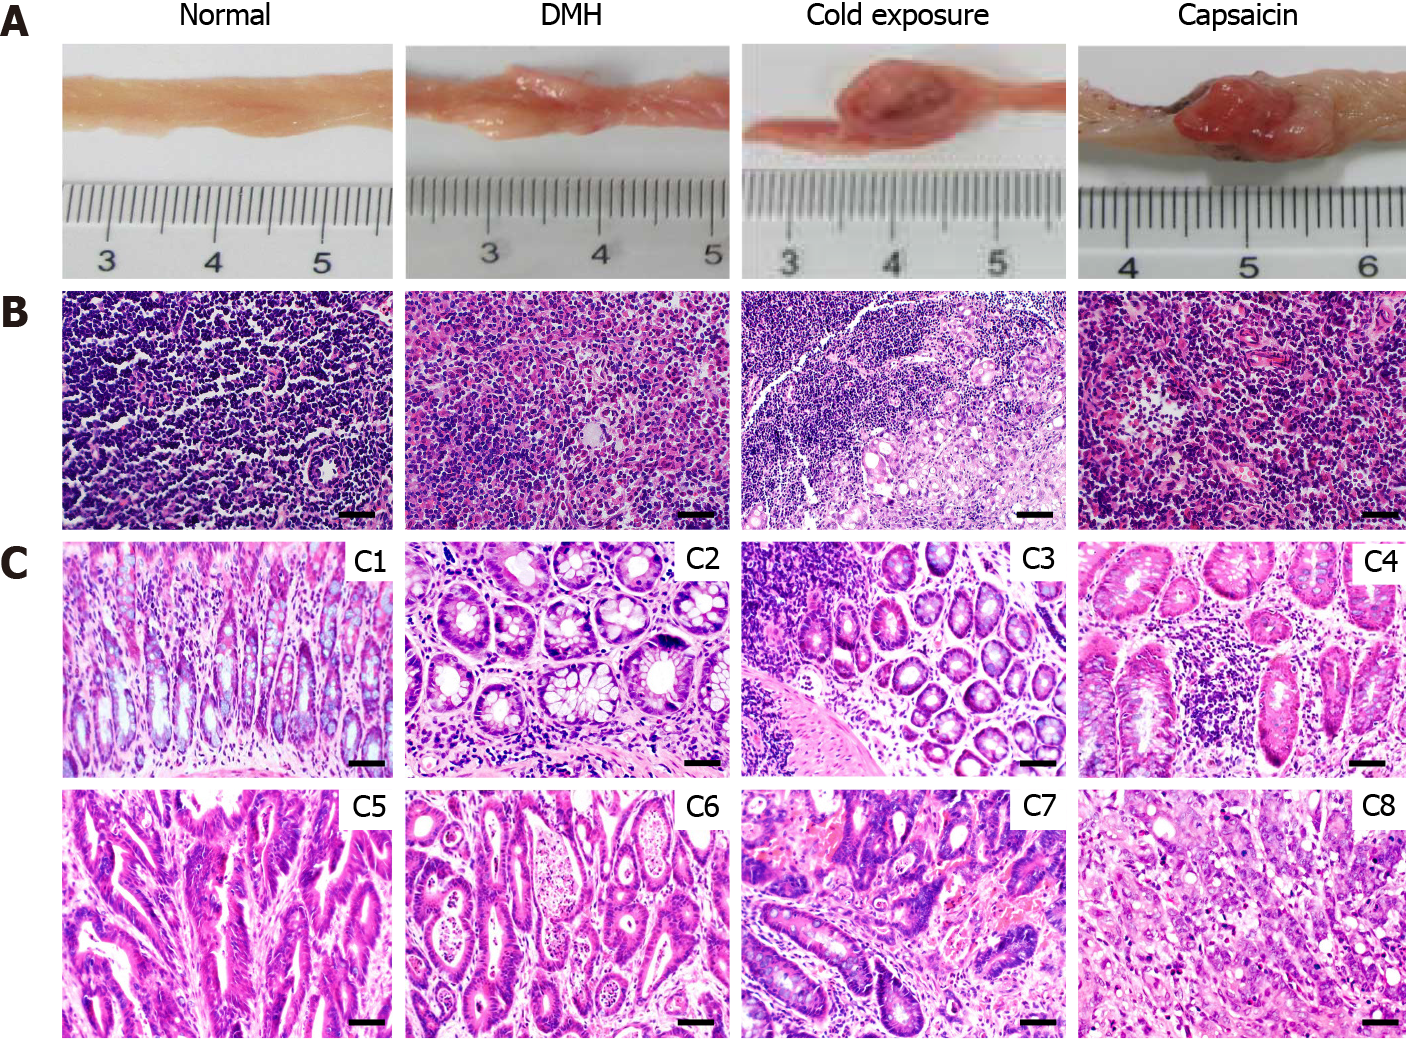
Figure 2 Pathological observation and lymph node metastases of different groups.
A: Macroscopic image of the colonic tumors; B: Representative sections stained with hematoxylin and eosin (HE) showing the histopathology of the mesocolic lymph node in the different groups; C: Representative sections stained with HE showing the histopathology of the colonic mucosa in the different groups. Normal architecture of colon was observed in the control groups (C1), adenoma with mild dysplasia with massive infiltration of inflammatory cells (C2). Histology of adenoma with moderate dysplasia in cold exposure groups (C3). Histology of adenoma with severe dysplasia (C4). Histology of well-differentiated tubular adenocarcinomas (C5). Histology of Moderately differentiated adenocarcinomas (C6). Histology of Poorly differentiated adenocarcinomas (C7). Histology of Mucinous adenocarcinoma with signet ring cells (C8) (HE staining, × 400, scalar bar 20 μm). DMH: 1,2-Dimethylhyrazine.
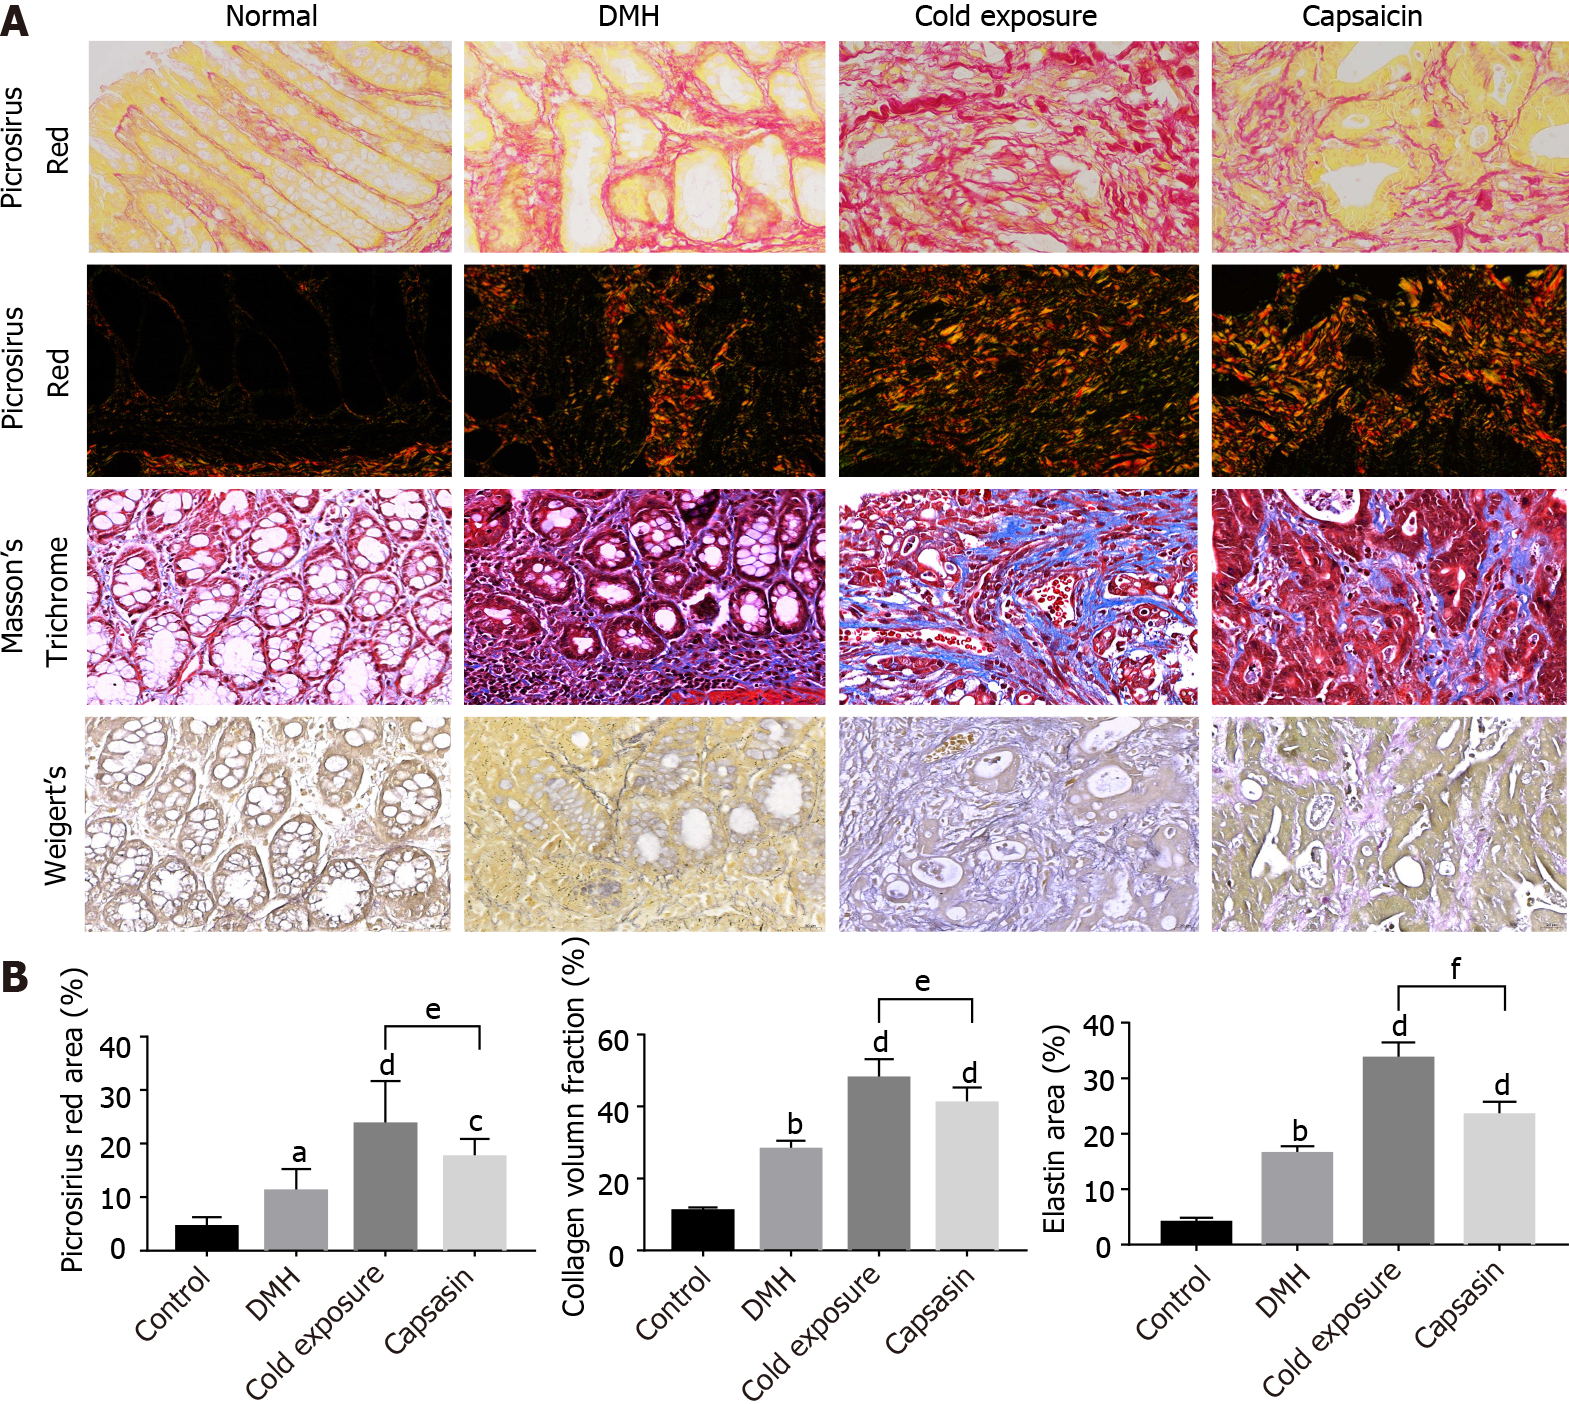
Figure 3 Changes in extracellular matrix components (collagen fibers and elastin) in colonic mucosa of different treatment groups.
A: Representative photographs of colonic tissues in rats of normal, 1,2-dimethylhyrazine (DMH), cold exposure and capsaicin groups using Masson’s trichrome: collagen (blue), nuclei and cytoplasm (red); picrosirius red in bright-field: collagen (red); polarized light: collagen (yellow-orange to green birefringence) and Weigert’s Resorcin-Fuschin: elastin (blue-black), myofibers (yellow). Magnification, × 400, scalar bar 20 μm; B: Quantitative analysis of picrosirius red staining, trichrome and Weigert’s staining as a measure of collagen and elastin density.
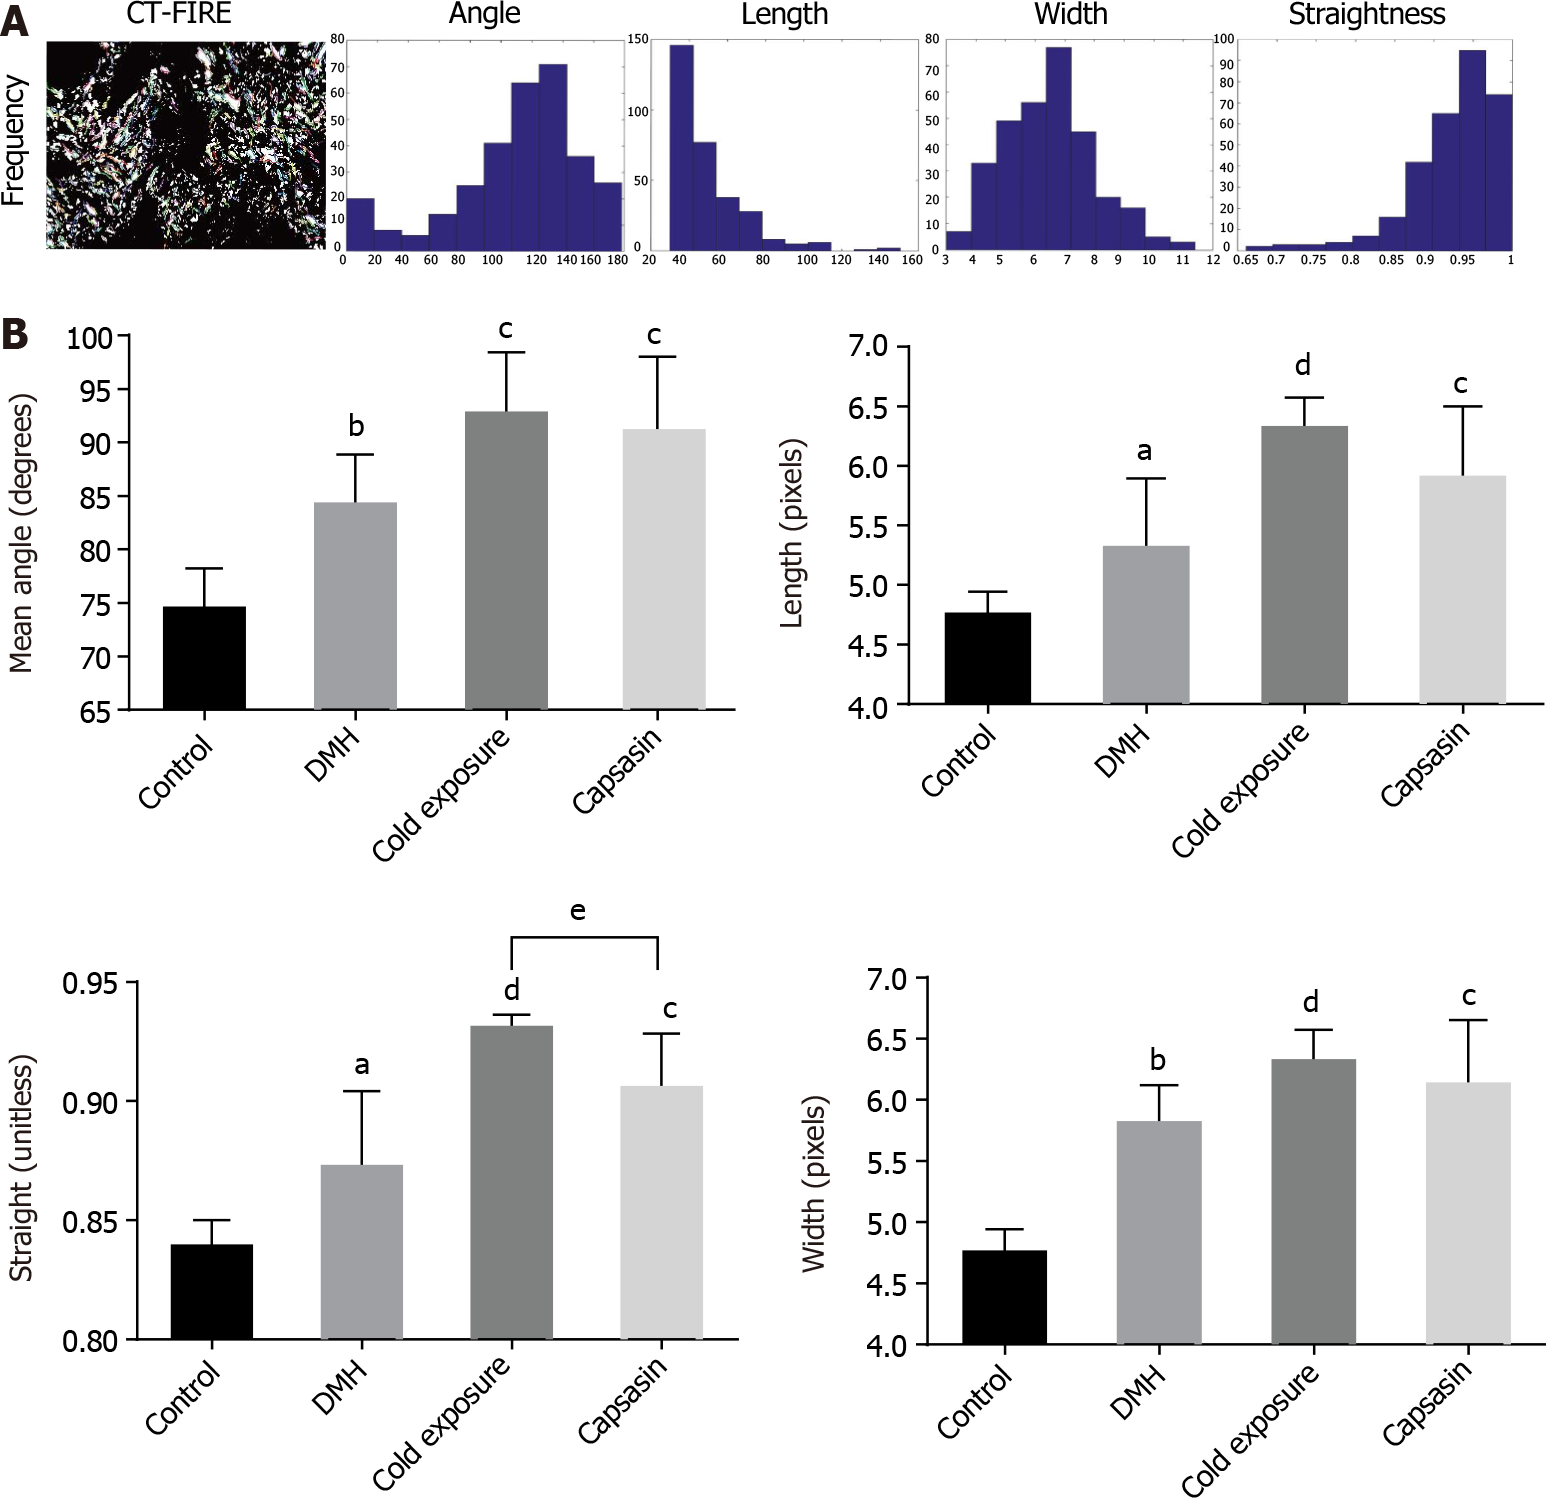
Figure 4 Collagen fibers were automatically extracted for analysis using open-source software CT-FIRE.
A: Histograms were generated to show the distribution of various parameters in each polarized light microscopy imaging; B: Quantitative analysis of collagen fibers from polarized light microscopy imaging in the colonic mucosa of different treatment groups. Data are mean ± SE of three images per tissues region. aP < 0.05, bP < 0.01, control compared with 1,2-dimethylhyrazine (DMH); cP < 0.05, dP < 0.01, DMH compared with cold exposure and capsaicin-treated group; eP < 0.05, Cold exposure compared with capsaicin-treated group.
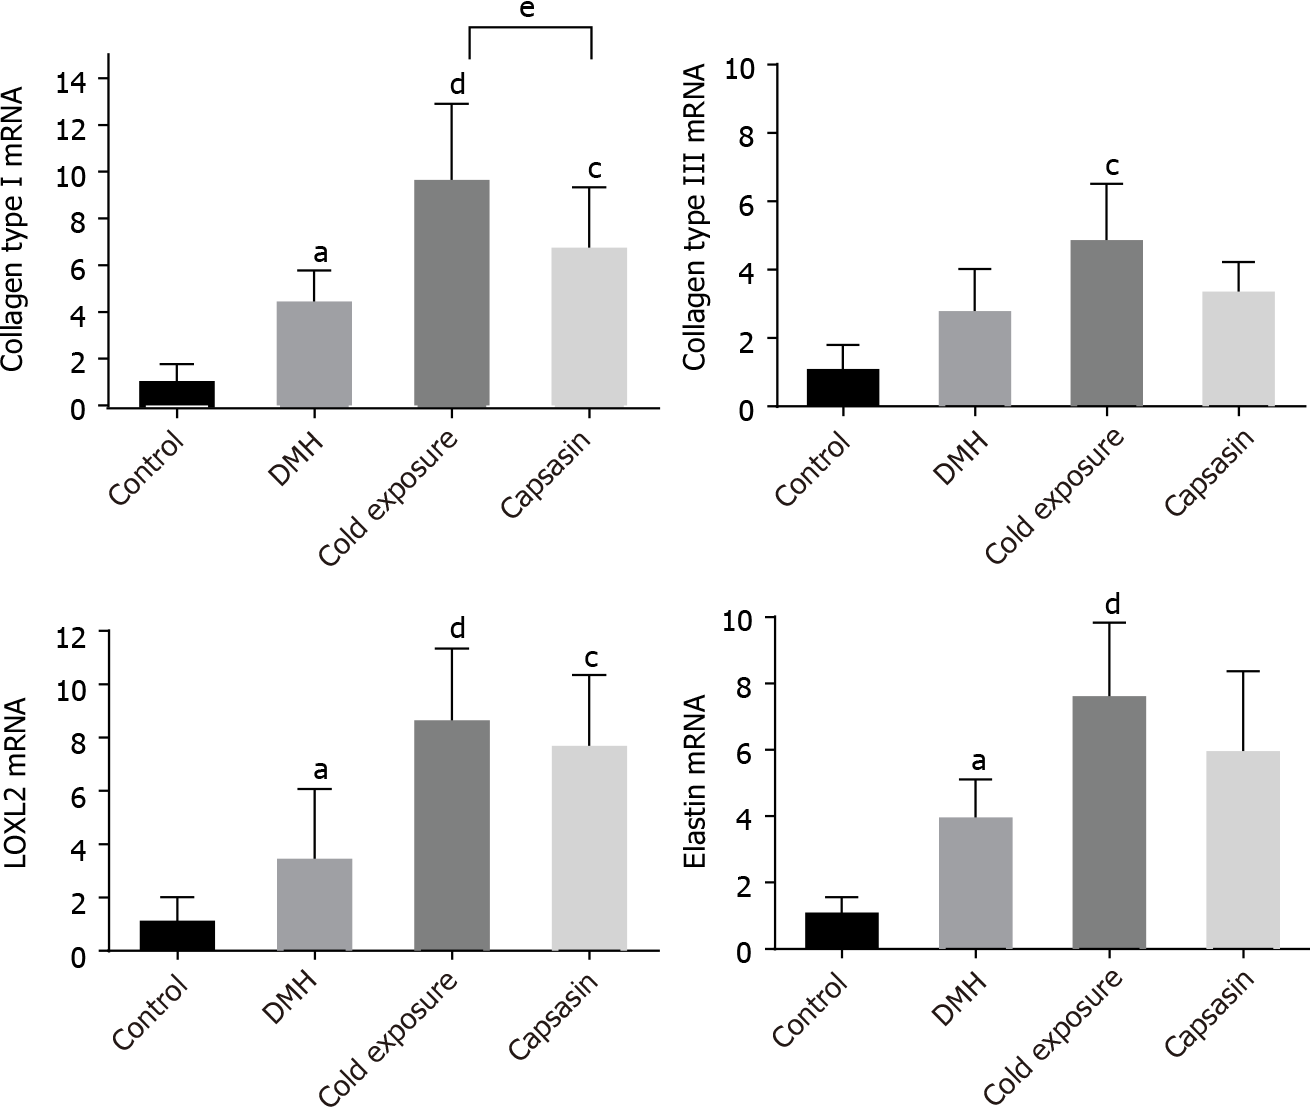
Figure 5 The mRNA expression levels of collagen type I, III, elastin and lysyl oxidase-like-2 in the colon tissues of rats in different groups.
Data were presented as the mean ± SD form six independent experiments. aP < 0.05, control compared with 1,2-dimethylhyrazine (DMH); cP < 0.05, dP < 0.01, DMH compared with cold exposure and capsaicin-treated group; eP < 0.05, cold exposure compared with capsaicin-treated group. LOXL2: Lysyl oxidase-like-2.
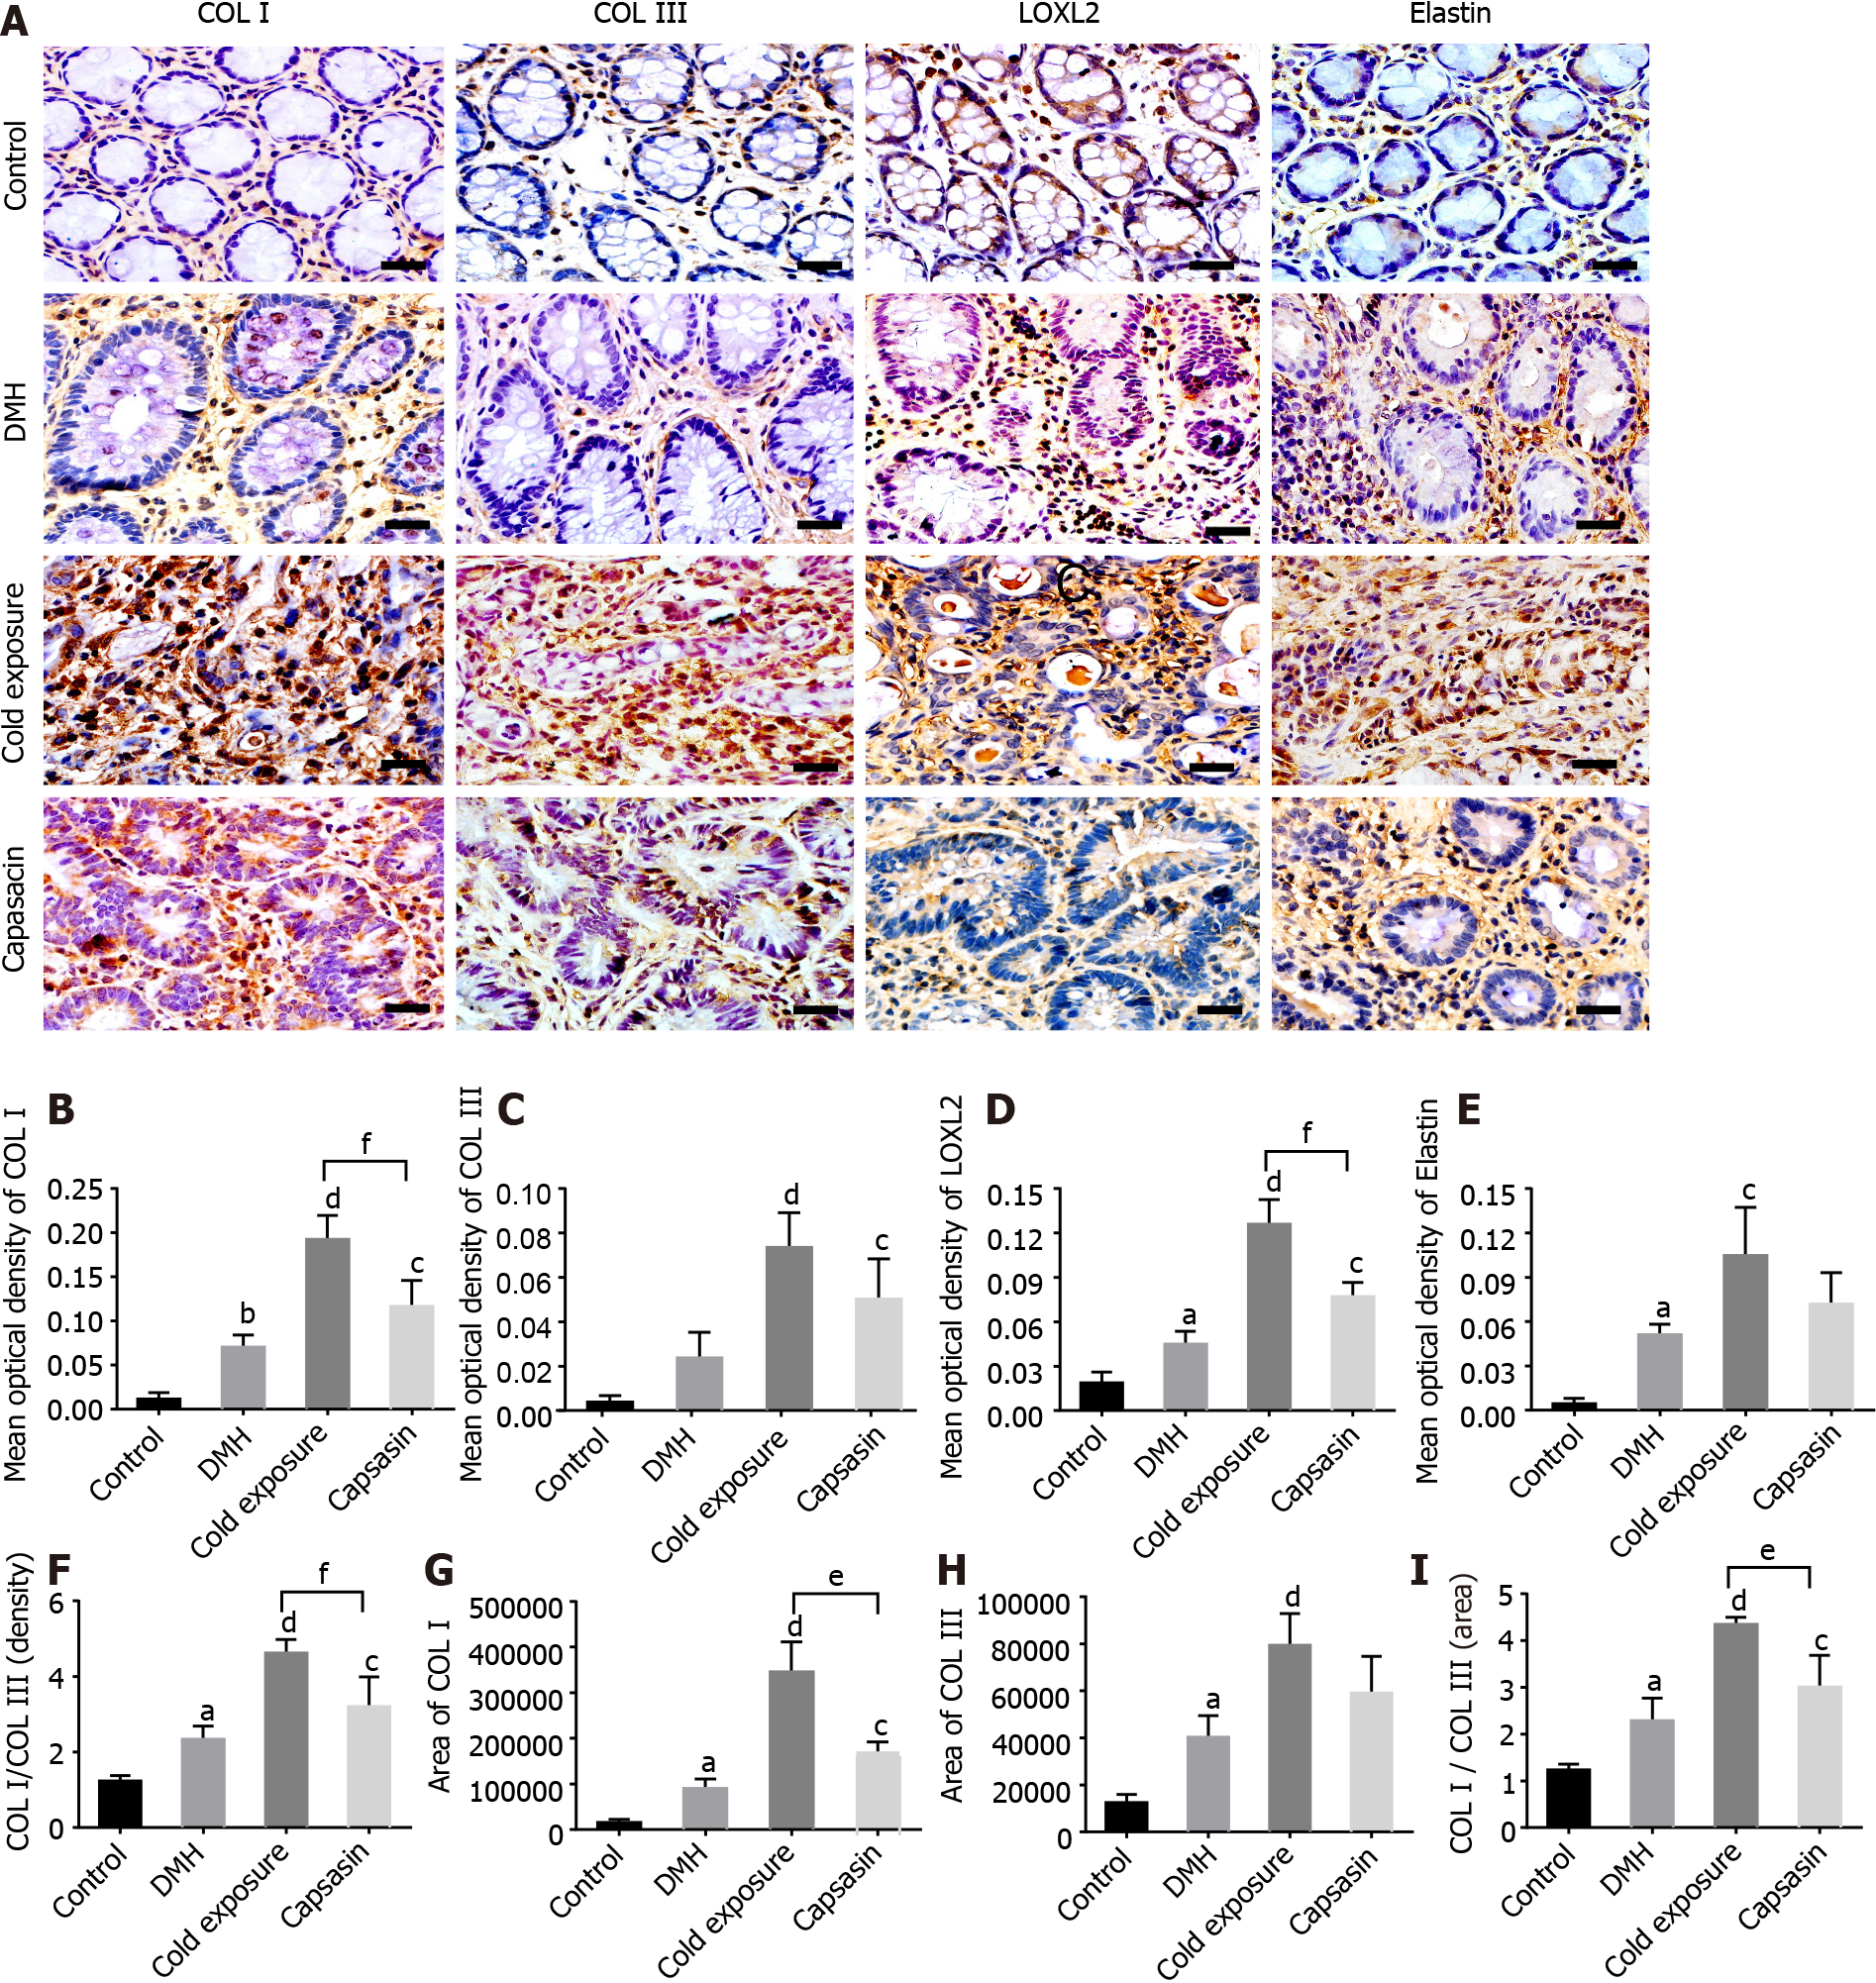
Figure 6 Changes in collagen, elastin and lysyl oxidase-like-2 proteins in the colonic tissues of different treatment groups.
A: Protein expressions of type I collagen (COL I), type III collagen (COL III), lysyl oxidase-like-2 (LOXL2), and elastin in the colonic tissues via immunohistochemical staining. Magnification, × 400, scalar bar 20 μm; B-I: Densitometric analysis of COL I (B), COL III (C), LOXL2 (D), elastin(E), COL I/COL III (F), COL I area (G), COL III area (H), and COL I area/COL III area (I) during immunohistochemical staining. aP < 0.05, bP < 0.01, control compared with 1,2-dimethylhyrazine (DMH); cP < 0.05, dP < 0.01, DMH compared with cold exposure and capsaicin-treated group; eP < 0.05, fP < 0.01, cold exposure compared with capsaicin-treated group.
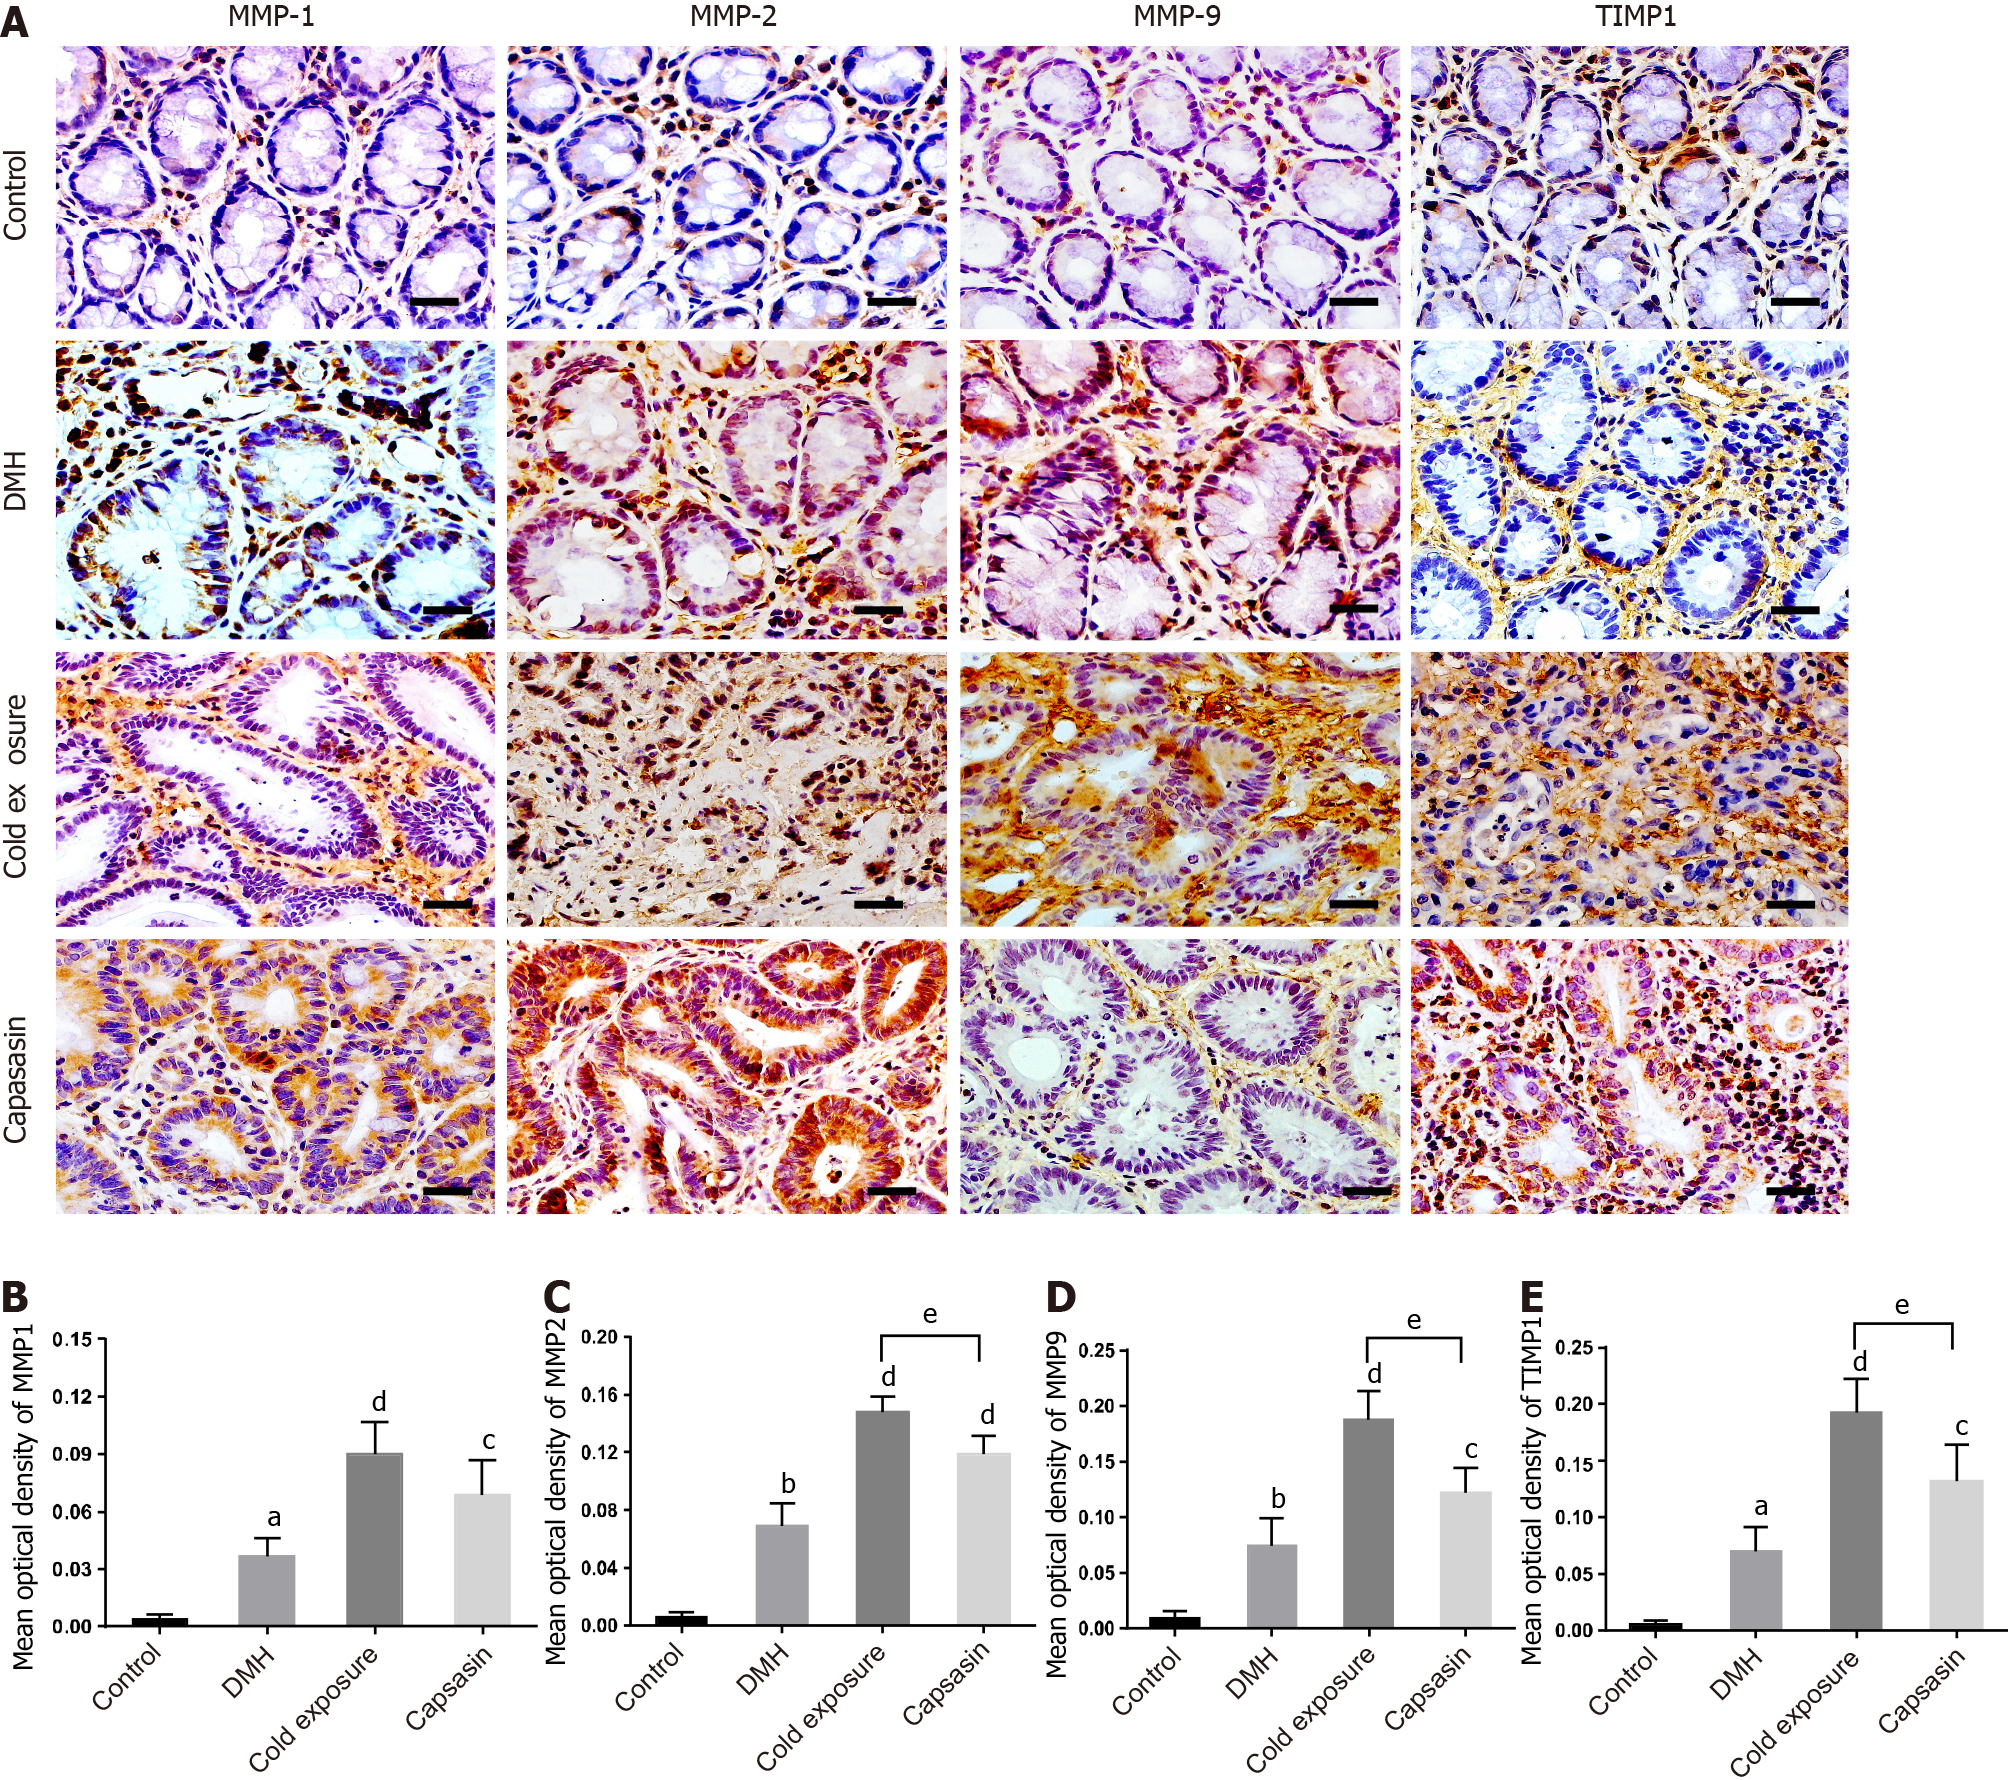
Figure 7 Changes in matrix metalloproteinase 1, matrix metalloproteinase 2, matrix metalloproteinase 9, and tissue-specific matrix metalloproteinase 1 proteins in the colonic tissues of different treatment groups.
A: Protein expressions of matrix metalloproteinase (MMP) 1, MMP2, MMP9 and tissue-specific matrix metalloproteinase 1 (TIMP1) in the colonic tissues via immunohistochemical staining. Magnification, × 400, scalar bar 20 μm; B-E: Densitometric analysis of MMP1 (B), MMP2 (C), MMP9 (D) and TIMP1 (E) during immunohistochemical staining. aP < 0.05, bP < 0.01, control compared with 1,2-dimethylhyrazine (DMH); cP < 0.05, dP < 0.01, DMH compared with cold exposure and capsaicin-treated group; eP < 0.05, cold exposure compared with capsaicin-treated group.
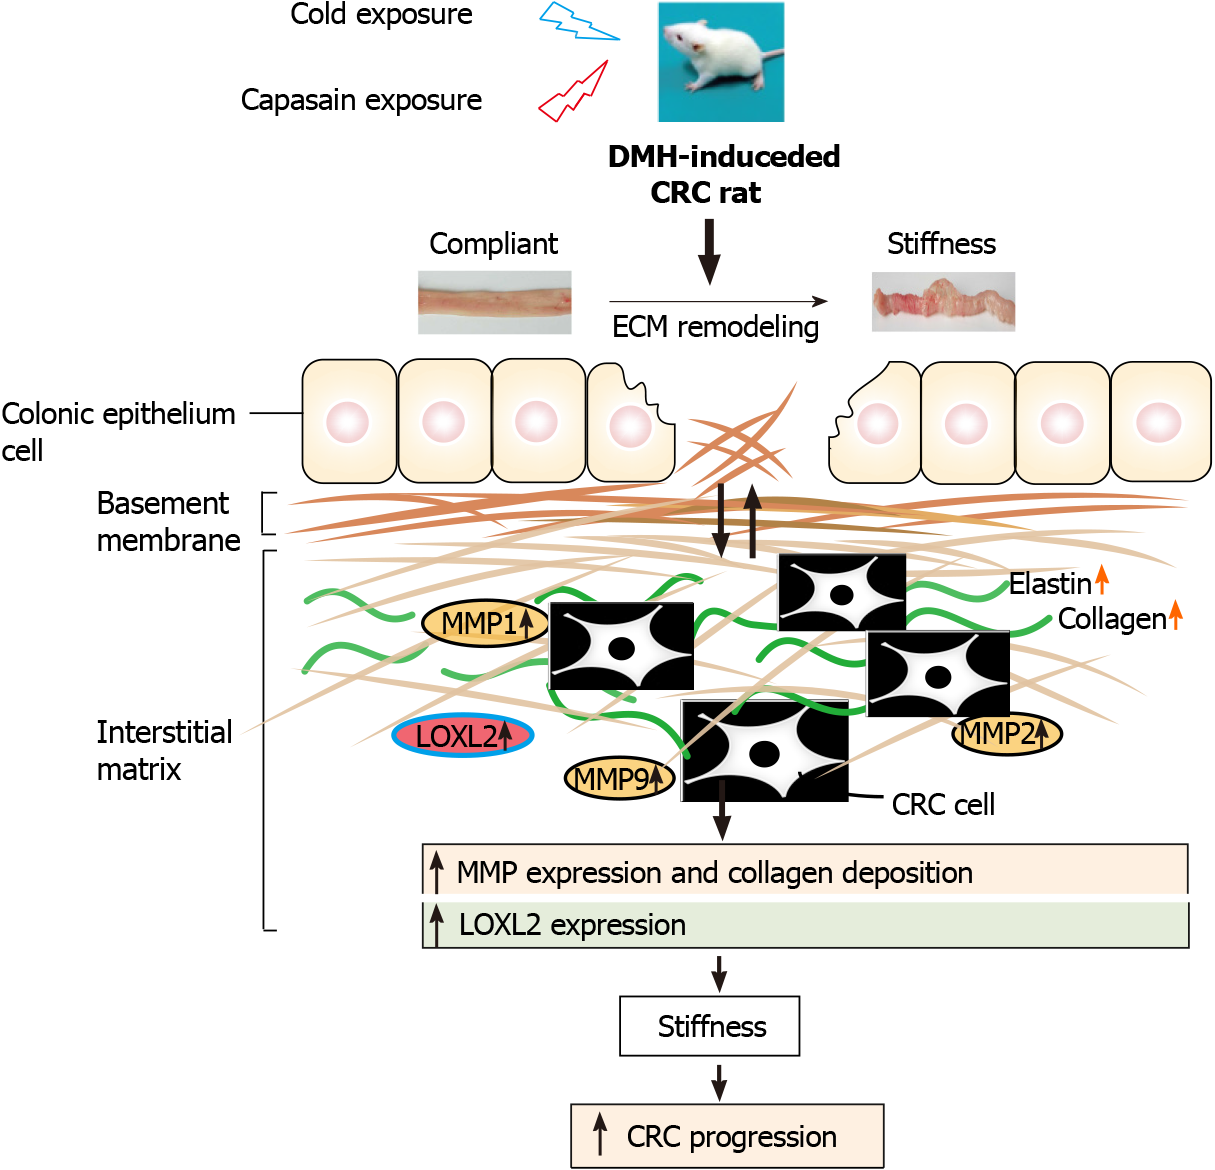
Figure 8 Schematic diagram depicting the role of extracellular matrix and extracellular matrix enzymes in promoting colorectal cancer pathogenesis.
Comparison with the normal rats, rats exposed to cold and capsaicin with profound remodeling of extracellular matrix (ECM) in the colonic tissue, which was mediated by ECM enzymes. These results implicate a crucial role of ECM remodeling on cold and capsaicin exposure colorectal cancer development and progression. CRC: Colorectal cancer; DMH: 1,2-Dimethylhyrazine; MMP: Matrix metalloproteinase.
- Citation: Qin JC, Yu WT, Li HX, Liang YQ, Nong FF, Wen B. Cold exposure and capsaicin promote 1,2-dimethylhyrazine-induced colon carcinogenesis in rats correlates with extracellular matrix remodeling. World J Gastroenterol 2021; 27(39): 6615-6630
- URL: https://www.wjgnet.com/1007-9327/full/v27/i39/6615.htm
- DOI: https://dx.doi.org/10.3748/wjg.v27.i39.6615


