©The Author(s) 2017.
World J Gastroenterol. Apr 7, 2017; 23(13): 2435-2442
Published online Apr 7, 2017. doi: 10.3748/wjg.v23.i13.2435
Published online Apr 7, 2017. doi: 10.3748/wjg.v23.i13.2435
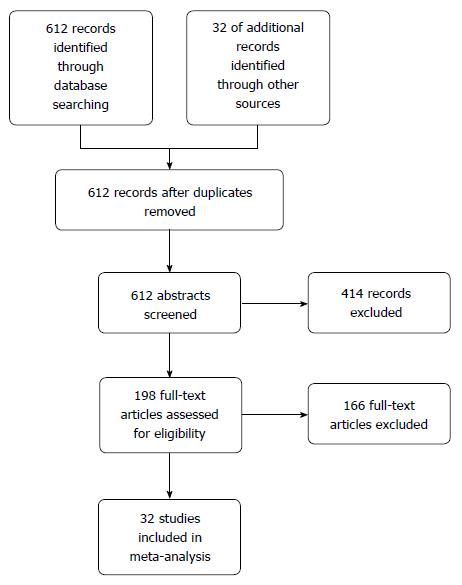
Figure 1 PRISMA diagram.
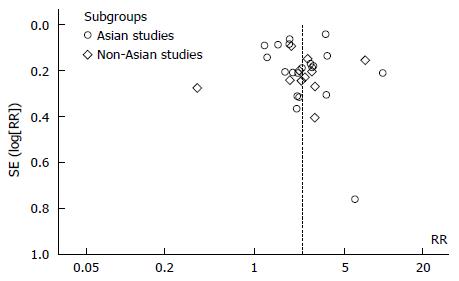
Figure 2 Funnel plot of included studies (n = 19).
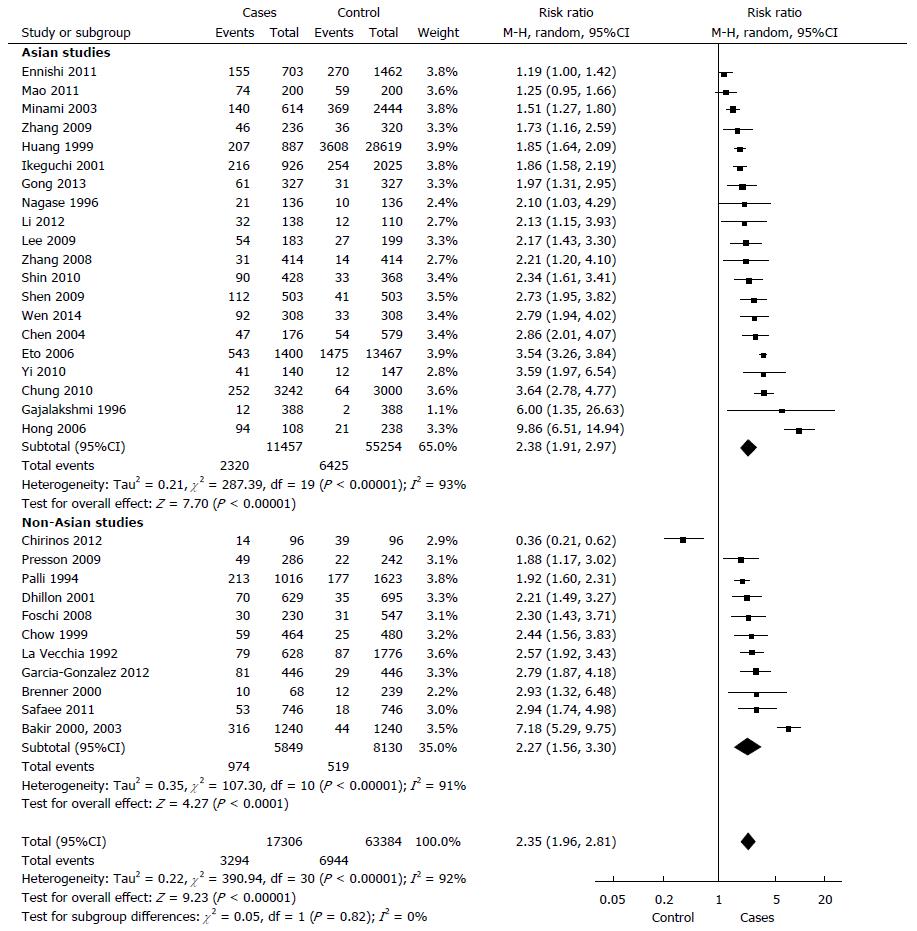
Figure 3 The Mantel-Haenszel meta-analysis of all included studies (n = 32) with subgroup analysis of Asian vs non-Asian population.
- Citation: Yaghoobi M, McNabb-Baltar J, Bijarchi R, Hunt RH. What is the quantitative risk of gastric cancer in the first-degree relatives of patients? A meta-analysis. World J Gastroenterol 2017; 23(13): 2435-2442
- URL: https://www.wjgnet.com/1007-9327/full/v23/i13/2435.htm
- DOI: https://dx.doi.org/10.3748/wjg.v23.i13.2435


