Copyright
©The Author(s) 2016.
World J Gastroenterol. Nov 14, 2016; 22(42): 9394-9399
Published online Nov 14, 2016. doi: 10.3748/wjg.v22.i42.9394
Published online Nov 14, 2016. doi: 10.3748/wjg.v22.i42.9394
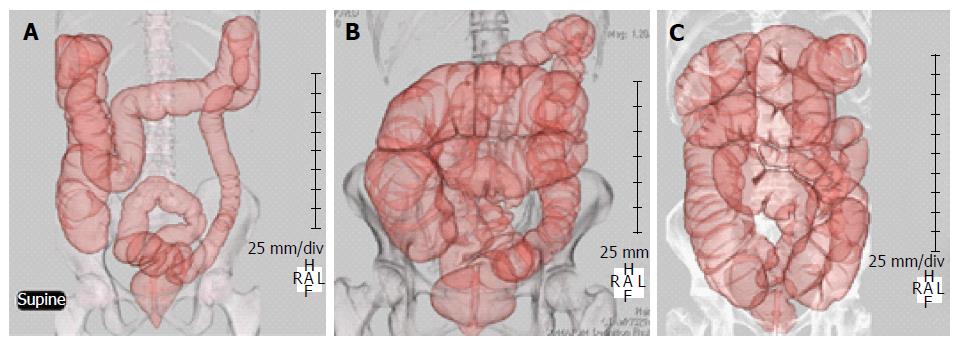
Figure 1 Computed tomography colonography.
A: Typical diarrhea type IBS; B: Typical constipation type IBS; C: Typical functional constipation; IBS: Irritable bowel syndrome.
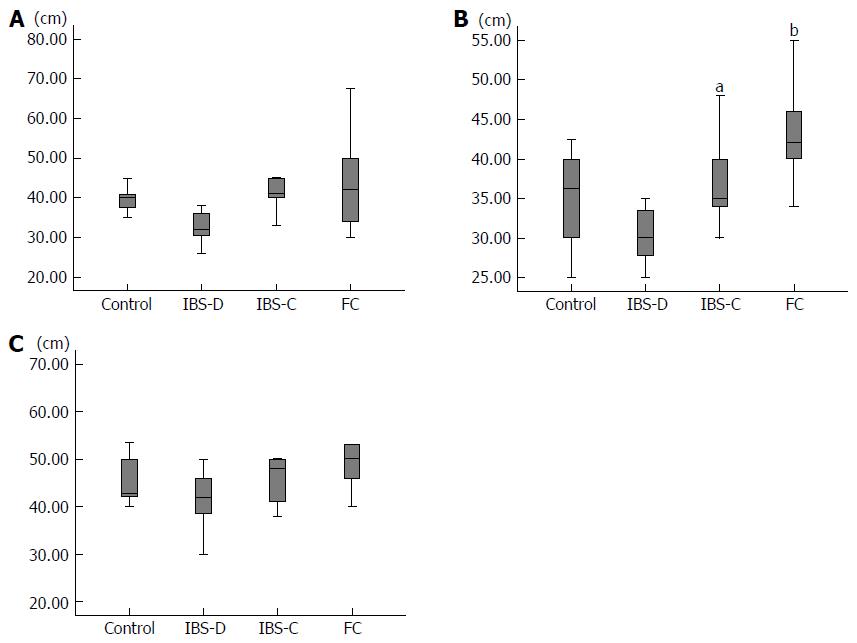
Figure 2 Length.
A: total colon, aP < 0.05 vs control; B: Rectosigmoid colon; C: Transverse colon, cP < 0.05 vs IBS-D, dP < 0.01 vs IBS-D. IBS-D: Diarrhea type IBS; IBS-C: Constipation type IBS; FC: Functional constipation; IBS: Irritable bowel syndrome.
Figure 3 Diameter.
A: Sigmoid colon; B: Descending colon, aP < 0.05 vs IBS-D, bP < 0.001 vs IBS-D; C: Transverse colon. IBS-D: Diarrhea type IBS; IBS-C: Constipation type IBS; FC: Functional constipation; IBS: Irritable bowel syndrome.
- Citation: Ohgo H, Imaeda H, Yamaoka M, Yoneno K, Hosoe N, Mizukami T, Nakamoto H. Irritable bowel syndrome evaluation using computed tomography colonography. World J Gastroenterol 2016; 22(42): 9394-9399
- URL: https://www.wjgnet.com/1007-9327/full/v22/i42/9394.htm
- DOI: https://dx.doi.org/10.3748/wjg.v22.i42.9394


