Copyright
©The Author(s) 2016.
World J Gastroenterol. Jun 21, 2016; 22(23): 5430-5435
Published online Jun 21, 2016. doi: 10.3748/wjg.v22.i23.5430
Published online Jun 21, 2016. doi: 10.3748/wjg.v22.i23.5430
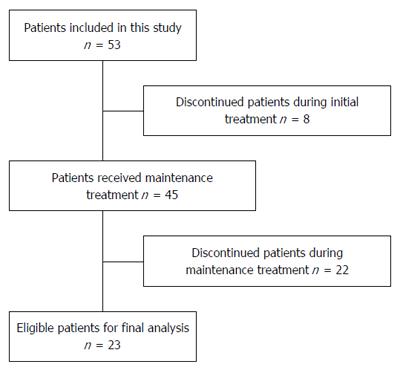
Figure 1 Patient flow.
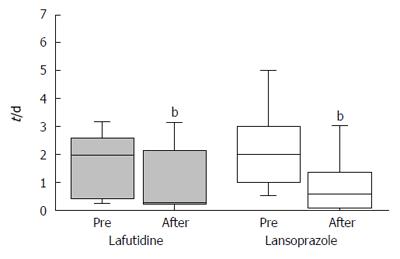
Figure 2 Frequency of heartburn evaluated using patient’ questionnaires.
Data are shown as a boxplot. In both groups, the frequency of heartburn was reduced after initial treatment, bP < 0.01.
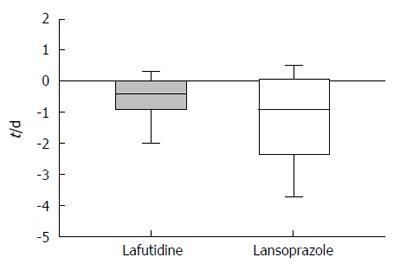
Figure 3 Change in heartburn frequency after initial treatment.
Data are shown as a boxplot. There were no significant difference between the lafutidine group and the lansoprazole group (P = 0.26).
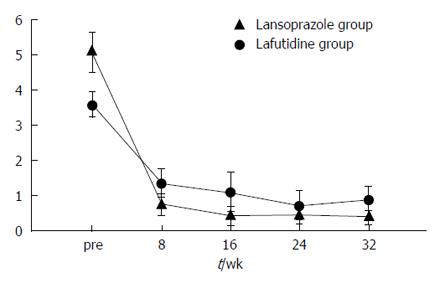
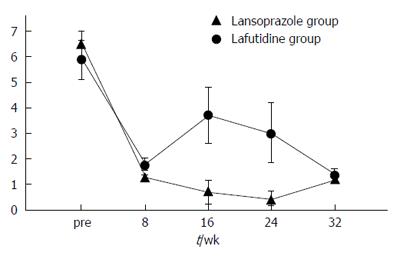
Figure 4 Severity of heartburn evaluated using visual analog scale scores.
Data are expressed as means ± SE. VAS scores in the lafutidine group were significantly worse than in the lansoprazole group (P = 0.016, ANOVA for repeated measures). VAS: Visual analog scale.
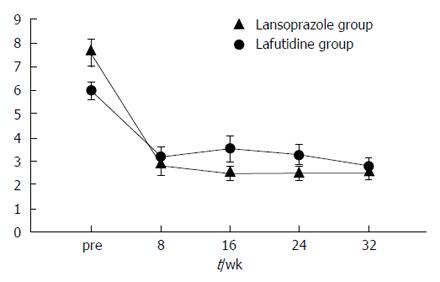
Figure 5 Sum score of question 2 and question 3 in the GSRS score.
Data are expressed as means ± SE. VAS scores in the lafutidine group were significantly worse than in the lansoprazole group (P = 0.0068, ANOVA for repeated measures). VAS: Visual analog scale.
Figure 6 Satisfaction score evaluated using visual analog scale scores.
Data are expressed as means ± SE. VAS scores in the lafutidine group were significantly worse than the lansoprazole group (P = 0.0048, ANOVA for repeated measures). VAS: Visual analog scale.
- Citation: Takenaka R, Okada H, Kawano S, Komazawa Y, Yoshinaga F, Nagata S, Inoue M, Komatsu H, Onogawa S, Kushiyama Y, Mukai S, Todo H, Okanobu H, Manabe N, Tanaka S, Haruma K, Kinoshita Y. Randomized study of lafutidine vs lansoprazole in patients with mild gastroesophageal reflux disease. World J Gastroenterol 2016; 22(23): 5430-5435
- URL: https://www.wjgnet.com/1007-9327/full/v22/i23/5430.htm
- DOI: https://dx.doi.org/10.3748/wjg.v22.i23.5430


