Copyright
©The Author(s) 2015.
World J Gastroenterol. Oct 21, 2015; 21(39): 11127-11140
Published online Oct 21, 2015. doi: 10.3748/wjg.v21.i39.11127
Published online Oct 21, 2015. doi: 10.3748/wjg.v21.i39.11127
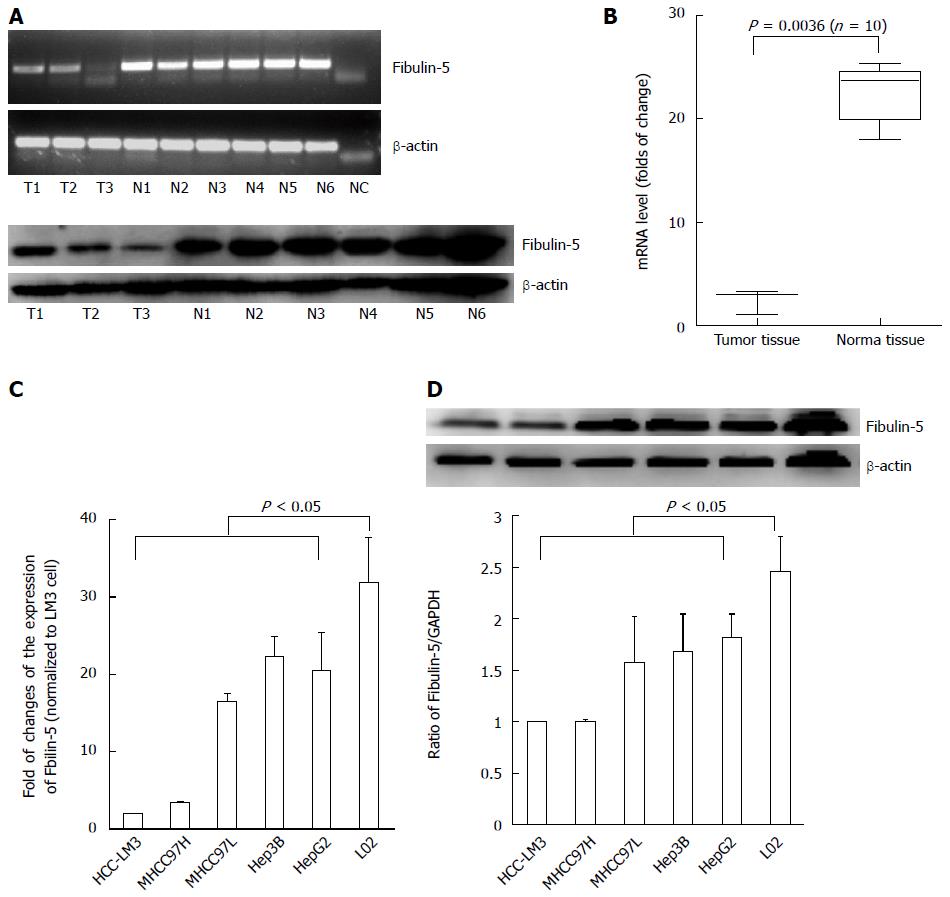
Figure 1 Decreased expression of fibulin-5 in hepatocellular carcinoma specimens.
A: RT-PCR and Western blot analyses of Fibulin-5 (FBLN-5) expression in three hepatocellular carcinoma (HCC) samples (T) compared to that in six normal tissues (N). β-actin was used as an internal control; B: Q-RT-PCR analysis of FBLN-5 expression in ten HCC samples compared to that in matched tumor-adjacent tissues. Values are given as the mean ± SD and analyzed by Student’s t-test; C: Comparing differences in the expression levels of FBLN-5 between HCC cell lines with different metastatic potentials and the immortalized hepatic cell line LO2 by Q-RT-PCR (P < 0.05 vs LO2, n = 3); D: Western blot analysis of FBLN-5 protein expression levels in HCC lines and LO2 cell line. The values of the band intensity below the figure represent the densitometric estimation of each band normalized by β-actin (P < 0.05 vs LO2, n = 3).
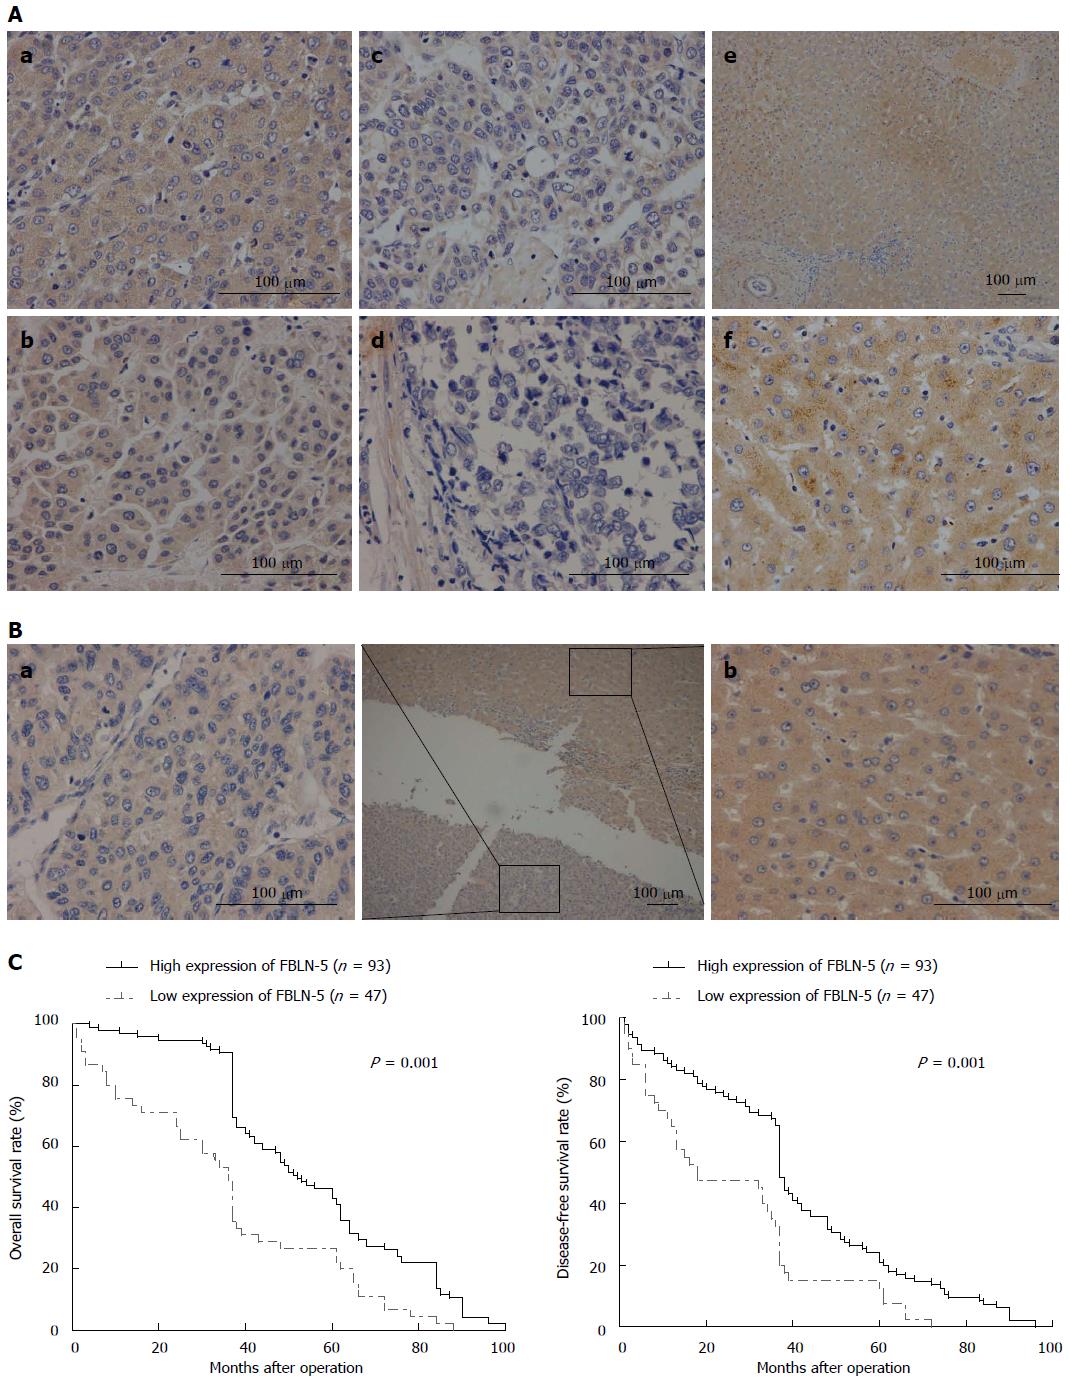
Figure 2 Immunohistochemical staining of fibulin-5 and disease-specific survival in patients with hepatocellular carcinoma.
A: The intensity of fibulin-5 (FBLN-5) expression in various tissues by immunohistochemical staining was evaluated in tumor tissues of hepatocellular carcinoma (HCC) patients with a: Stage I; b: Stage II; c: Stage III; d: Stage IV, and e-f: Normal tissue samples with various magnification. Normal control is fresh liver tissues from patients who underwent the resection for other non-HCC diseases; B: The intensity of FBLN-5 expression in a: tumor tissues; and b: pericarcinomatous tissue in same patients with HCC; C: Survival of patients with low FBLN-5 expression (dashed grey line) was significantly abbreviated in comparison to those with high expression (solid black line), with a statistically significant difference both in a: Overall (P = 0.001); and b: Disease-free survival (P = 0.002) by log-rank test.
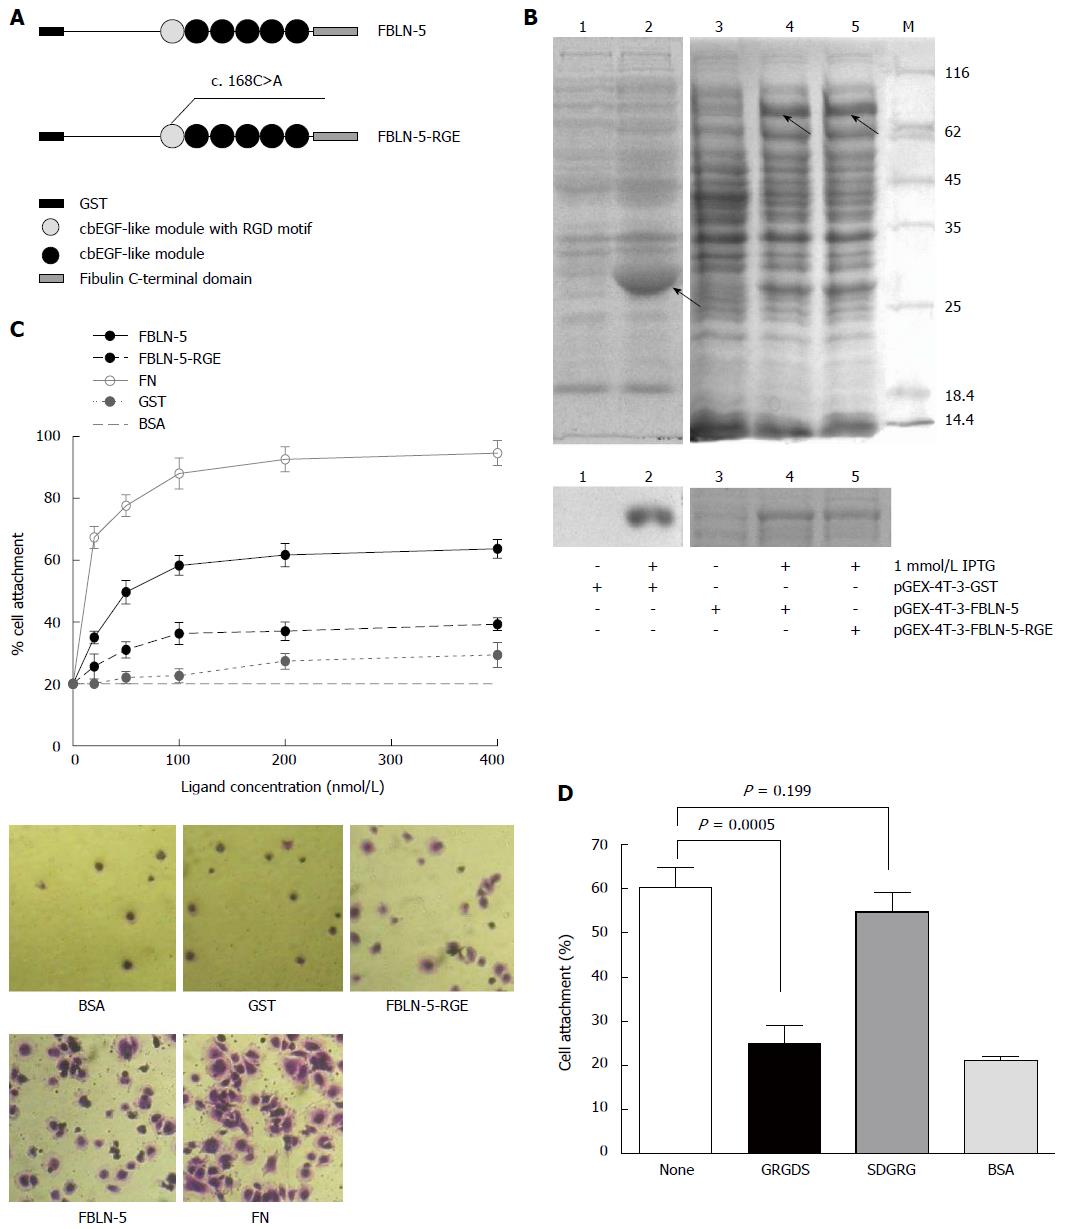
Figure 3 Characterization of recombinant human fibulin-5 and the attachment to hepatocellular carcinoma-LM3 cells.
A: Domain organization of recombinant fusion protein of GST-FBLN-5 and GST-FBLN-5-RGE (cbEGF-like module, calcium binding EGF-like module); B: SDS/PAGE analysis of glutathionesepharose affinity-purified GST, recombinant full-length FBLN-5, and FBLN-5-RGE under non-reducing conditions. M indicates molecular-mass markers (sizes in kDa). IPTG (1 mmol/L) significantly induced the expression of recombinant proteins (upper), which were purified with glutathionesepharose beads later (bottom); C: Attachment of HCC-LM3 cells on GST (black dotted line), FBLN-5 (black solid line), FBLN-5-RGE (black dashed line), and human plasma FN (grey solid line). Background cell adhesion on BSA-coated wells is also shown as grey dashed lines (upper). A high percentage of HCC-LM3 cells showed spreading on full-length FBLN-5 and on FN at 200 nmol/L, but many fewer cells spread on FBLN-5-RGE, GST and BSA were visible (bottom). Results are mean ± SD of three experiments; D: Inhibition of HCC-LM3 attachment to 200 nmol/L FBLN-5 by synthetic GRGDS peptide (500 μg/mL). Synthetic SDGRG peptide (500 μg/mL) was used as a negative control. None indicates HCC-LM3 attachment to 200 nm FBLN-5 in the absence of peptide. BSA indicates HCC-LM3 attachment to BSA-blocked wells. Pre-incubation of HCC-LM3 with the synthetic peptide GRGDS significantly blocked adhesion to FBLN-5 (P < 0.001, compared with untreated HCC-LM3 on FBLN-5). Pre-incubation with the control peptide SDGRG showed no inhibition of cell attachment (P = 0.199, compared with untreated cells on FBLN-5).
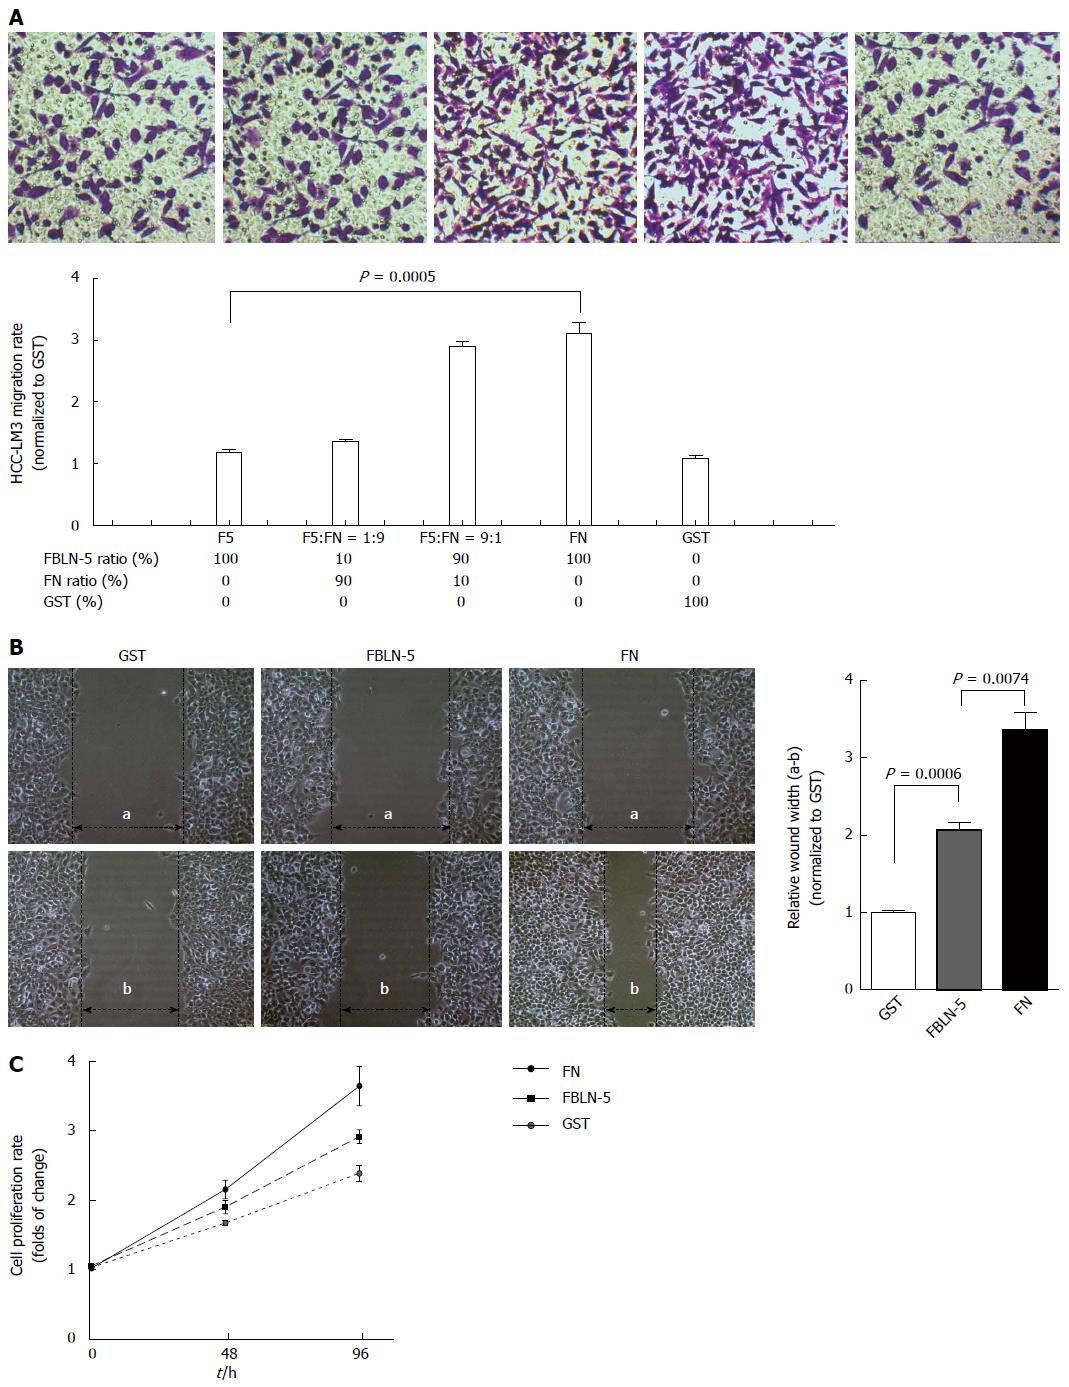
Figure 4 Hepatocellular carcinoma cell migration and proliferation on fibulin-5.
A: The effects on hepatocellular carcinoma (HCC)-LM3 migrating of Boyden chamber and transwell assays at a range of fibulin-5 (FBLN-5)/FN ratios (F5:FN) as indicated were analysed. HCC-LM3 cell migration was inhibited by FBLN-5 as compared with FN group (upper). The histogram (bottom) represent the migration rate after calculating the absorption of the destained cells at 590 nm. Results are mean ± SD of three experiments; B: Migration of HCC-LM3 cells on 200 nmol/L GST, FBLN-5 or FN. Monolayers were wounded and imaging at the leading edge was analyzed after 48 h of migration. Distances of wound width between 0 h (a) and 24 h (b) were counted and the mean ± SD is expressed as a percentage of cell migration by wound healing assays; C: The HCC-LM3 cell proliferation on GST (black dotted line), FBLN-5 (grey dashed line), FBLN-5 (black dashed line), and FN (black solid line) was investigated by CCK-8 assay. The y-axis represents the proliferation rate, calculated as the ratio to GST group (oh). Values are given as mean ± SD.
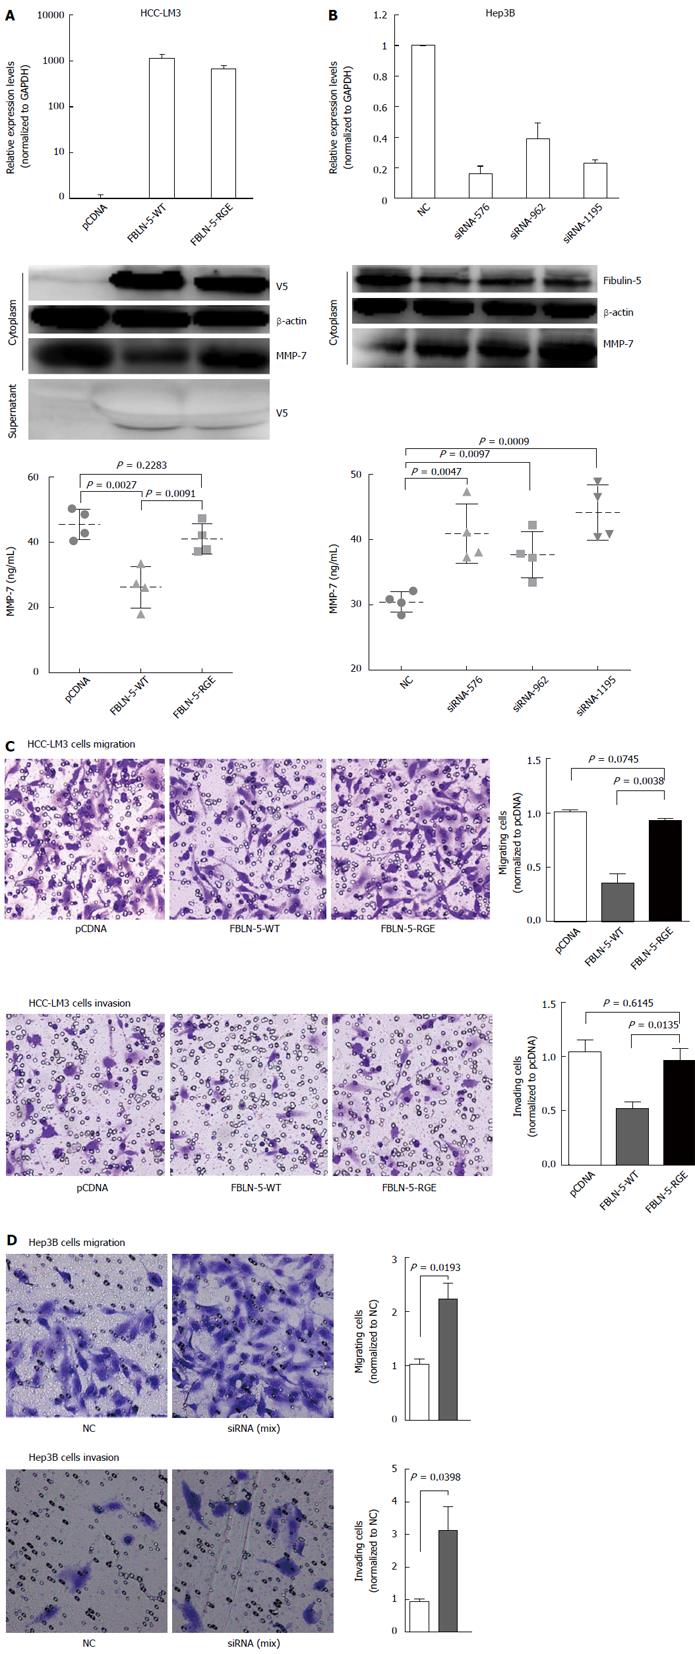
Figure 5 RGD-dependent suppression of hepatocellular carcinoma cell migration and invasion by fibulin-5 via matrix metalloproteinase 7.
A: V5-tagged fibulin-5 (FBLN-5) was transfected into hepatocellular carcinoma (HCC)-LM3 cells, and V5-FBLN-5 expression was determined by Western blot with anti-V5 and anti-β-actin antibodies both in the cytoplasm and supernatant. The mRNA expression level of FBLN-5 was also measured by Q-RT-PCR. Matrix metalloproteinase 7 (MMP-7) expression was analyzed by Western blot 36 h after transfection. The levels of secreted MMP-7 were determined by ELISA (bottom) 36 h after transfection; B: A negative control siRNA (NC) plus FBLN-5 siRNA (siRNA-576, siRNA-962, siRNA-1195) was transfected into Hep3B cells for 48 h. After transfection, Western blot was performed with anti-FBLN-5 and β-actin antibodies. The mRNA expression level of endogenous FBLN-5 was also measured by Q-RT-PCR. MMP-7 expression was analyzed by Western blotting 36 h after transfection. The levels of secreted MMP-7 were determined by ELISA (bottom) 36 h after transfection; C: Migration and invasion of pcDNA-HCC-LM3, FBLN-5-WT-HCC-LM3 and FBLN-5-RGE-HCC-LM3 cells (× 100). For the migration assays, cells (pcDNA, FBLN-5-WT and FBLN-5-RGE) were seeded into the top of a transwell insert. After 24 h, the cells on top were scraped, and the cells that had migrated to the bottom were fixed and stained with crystal violet. The relative-fold migration values for the HCC-LM3 cells were normalized against the pcDNA and are represented diagrammatically. For the invasion assays, cells were seeded after the addition of matrigel. The relative-fold invasion values for the HCC-LM3 cells were normalized against the pcDNA and are represented diagrammatically; D: Migration and invasion results of NC and siRNA-FBLN-5 Hep3B cells are shown (× 100). The relative-fold migration and invasion values for siRNA-FBLN-5 transfected cells were normalized against the values for the NC and are represented diagrammatically. The results represent the mean ± SD of three independent experiments.
-
Citation: Tang JC, Liu JH, Liu XL, Liang X, Cai XJ. Effect of fibulin-5 on adhesion, migration and invasion of hepatocellular carcinoma cells
via an integrin-dependent mechanism. World J Gastroenterol 2015; 21(39): 11127-11140 - URL: https://www.wjgnet.com/1007-9327/full/v21/i39/11127.htm
- DOI: https://dx.doi.org/10.3748/wjg.v21.i39.11127


