Copyright
©2011 Baishideng Publishing Group Co.
World J Gastroenterol. Mar 14, 2011; 17(10): 1267-1275
Published online Mar 14, 2011. doi: 10.3748/wjg.v17.i10.1267
Published online Mar 14, 2011. doi: 10.3748/wjg.v17.i10.1267
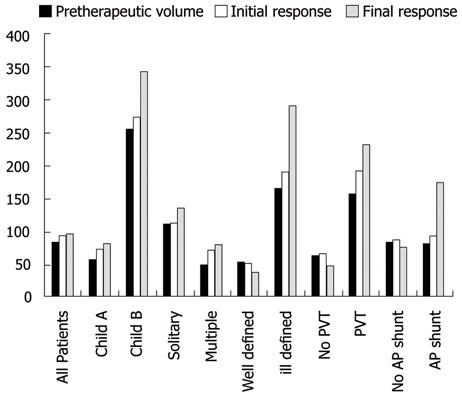
Figure 1 Magnetic resonance imaging volumetric changes of the median tumor volume (mL) in different patient groups.
PVT: Portal vein thrombosis; AP: Arterioportal.
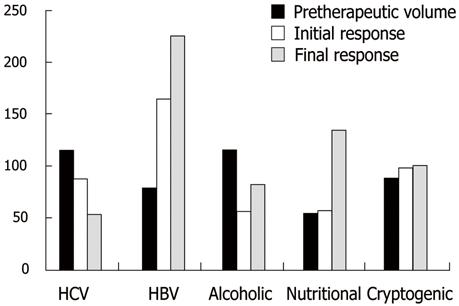
Figure 2 Magnetic resonance imaging volumetric changes of the median tumor volume (mL) according to the underlying liver pathology.
HBV: Hepatitis B virus; HCV: Hepatitis C virus.
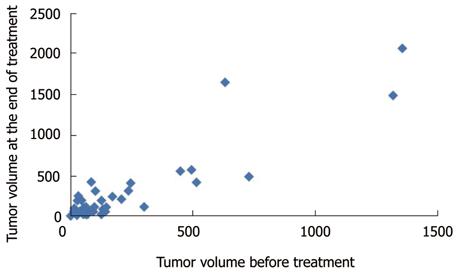
Figure 3 Scatter gram.
Correlation between the pre- and post-treatment volume.
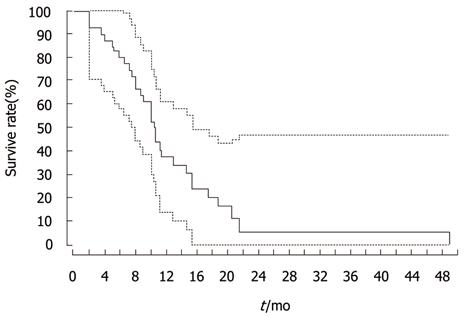
Figure 4 Kaplan-Meier survival curve for all patients showing the overall survival rates calculated from the time of first transarterial chemoembolization sessions.
The estimated survival rates at 6, 12 and 18 mo were 79.5%, 37.5% and 21%, respectively, with a median survival time of 10 mo. Kaplan-Meier with confidence P = 0.95,
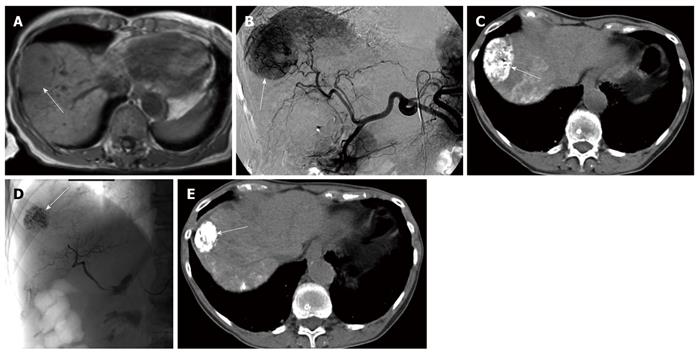
Figure 5 A 76-year-old female patient, hepatitis C virus liver cirrhosis.
A: Axial magnetic resonance imaging (MRI) T1 WI showing an isointense subcapsular hepatocellular carcinoma at segment 8 (white arrow); B: Digital subtraction angiography before the 1st transarterial chemoembolization (TACE) showing a large tumor blush at segment 8 (white arrow); C: Computed tomography (CT) after the first embolization showing dense Lipiodol uptake by the tumor (white arrow); D: Hepatic arteriography after the 5th TACE session showing occluded feeding arteries and Lipiodol concentration within the tumor (white arrow); E: CT after the last TACE session showing reduction of the tumor size (> 50%) by MRI volumetry (white arrow).
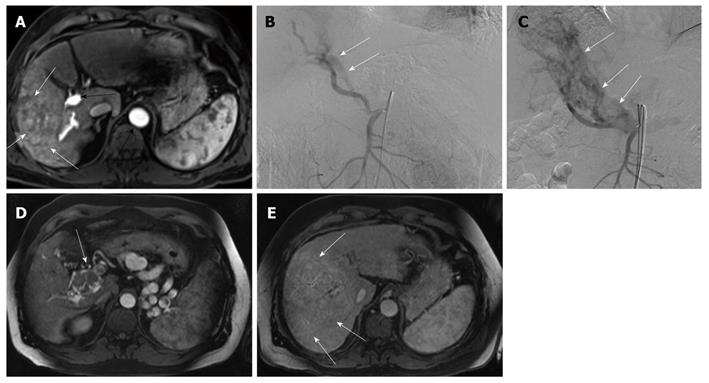
Figure 6 A 58-year-old male patient with alcoholic cirrhosis.
A: Axial magnetic resonance imaging (MRI) T1 post contrast weighted image showing an ill defined mass in segments 5 and 6 (white arrows). Note enhancement of the portal vein (black arrow) in the arterial phase (black arrow head at the aorta) denoting an underlying arterioportal shunt; B: Digital subtraction angiography showing opacified portal vein (white arrows) during the arterial phase (APS) (white arrows); C: Digital subtraction angiography during the last (6th) transarterial chemoembolization (TACE) showing the APS with markedly dilated and partially thrombosed portal vein (white arrows); D, E: Axial MRI T1 post contrast after the last TACE showing tumor infiltration of the dilated main portal vein (white arrow in Figure 6D) and progression of the tumor size (> 20%) by MRI volumetry (white arrows in Figure 6E) (white arrows).
- Citation: Vogl TJ, Nour-Eldin NE, Emad-Eldin S, Naguib NN, Trojan J, Ackermann H, Abdelaziz O. Portal vein thrombosis and arterioportal shunts: Effects on tumor response after chemoembolization of hepatocellular carcinoma. World J Gastroenterol 2011; 17(10): 1267-1275
- URL: https://www.wjgnet.com/1007-9327/full/v17/i10/1267.htm
- DOI: https://dx.doi.org/10.3748/wjg.v17.i10.1267


