©The Author(s) 2021.
World J Meta-Anal. Aug 28, 2021; 9(4): 377-388
Published online Aug 28, 2021. doi: 10.13105/wjma.v9.i4.377
Published online Aug 28, 2021. doi: 10.13105/wjma.v9.i4.377
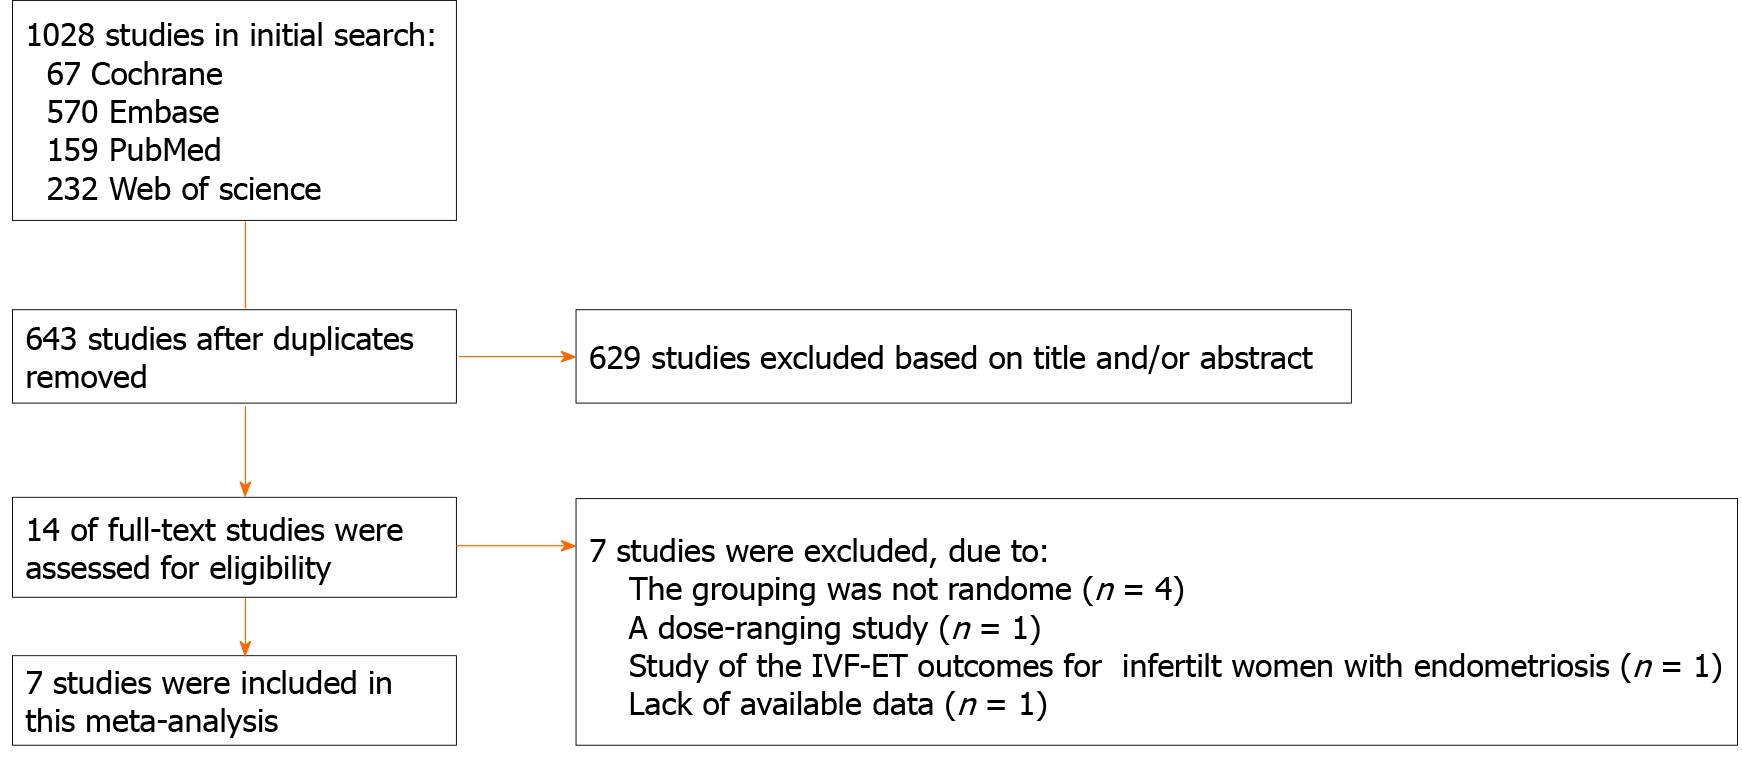
Figure 1
Flowchart of study selection process.
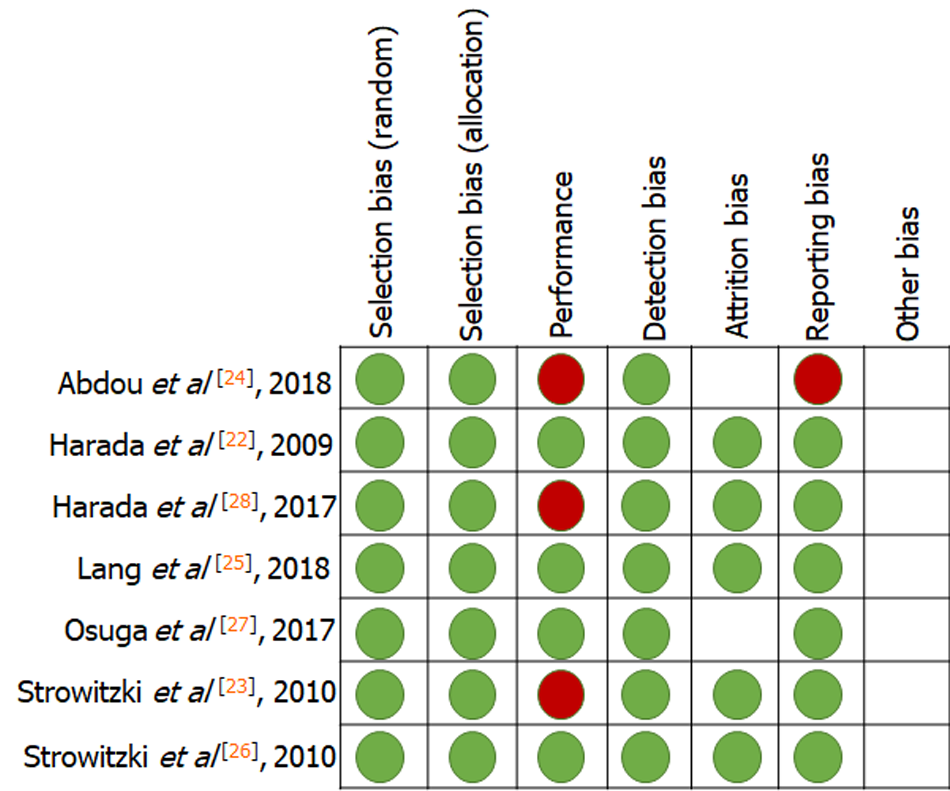
Figure 2
Risk of bias summary of randomized controlled trials.
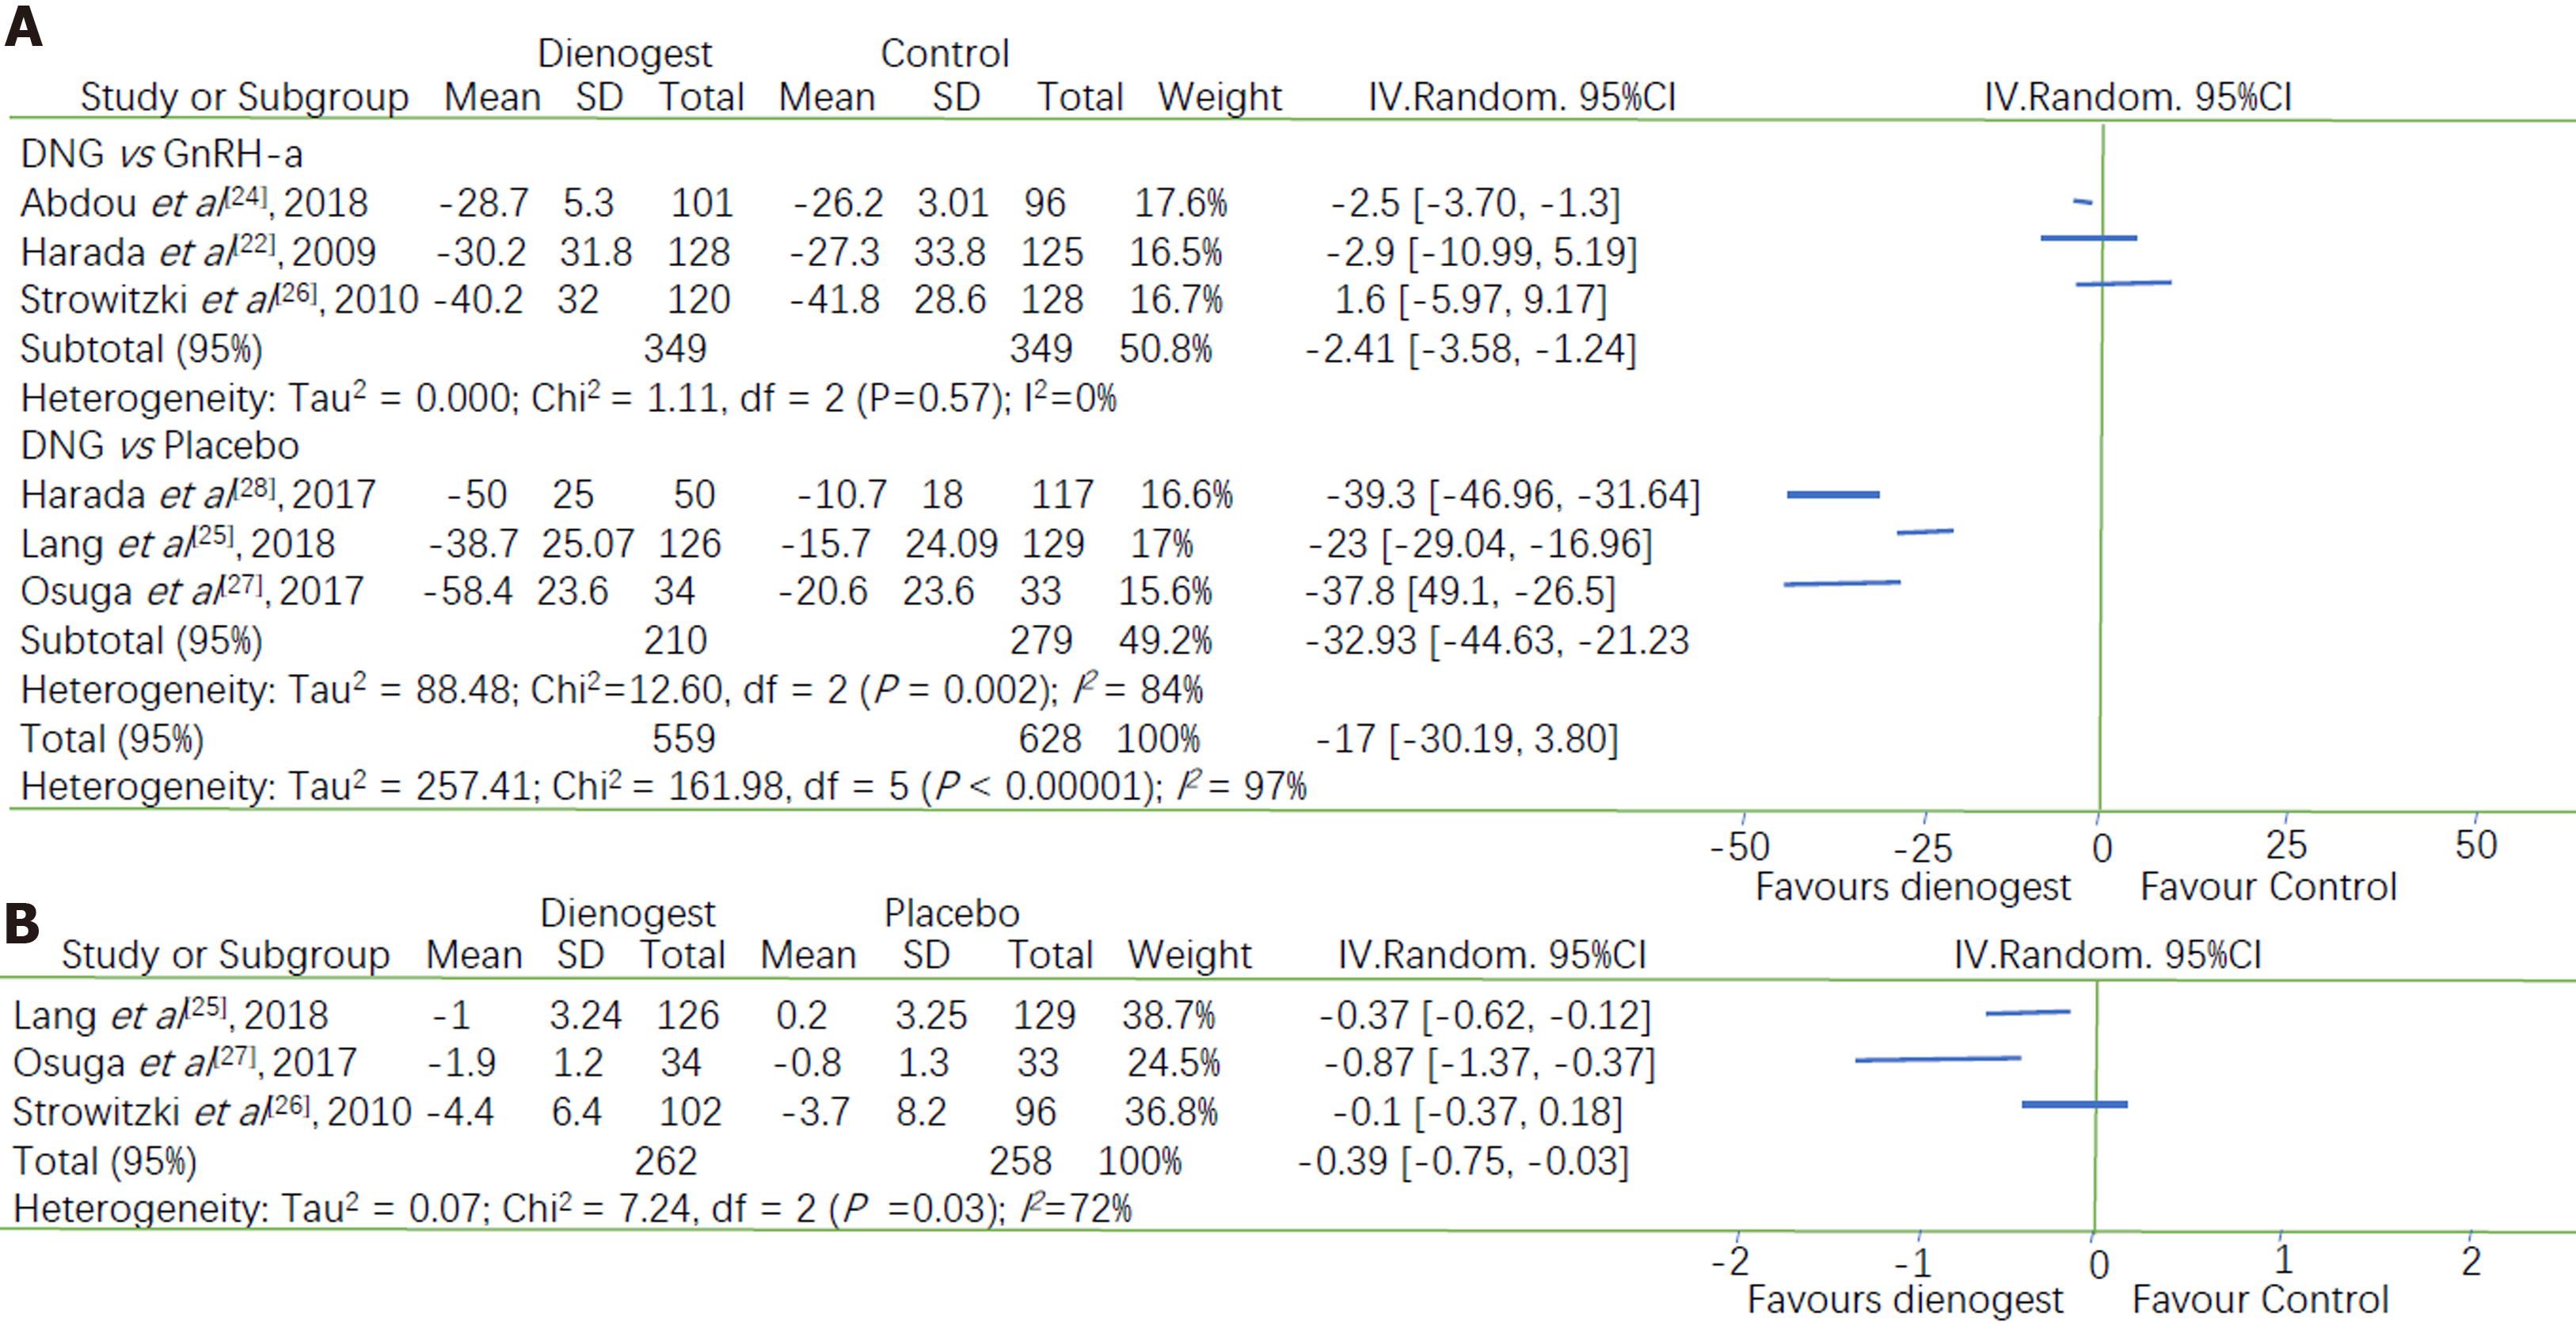
Figure 3 Change in visual analogue scale scores and supportive analgesic medication.
A: Forest plot showing dienogest vs other intervention (GnRH-a and placebo) in the outcomes of changes in endometriosis related pain measured on visual analogue scale; B: Forest plot showing dienogest vs placebo in the outcome of supportive analgesic medication intake changes at the end of treatment. CI: Confidence interval.
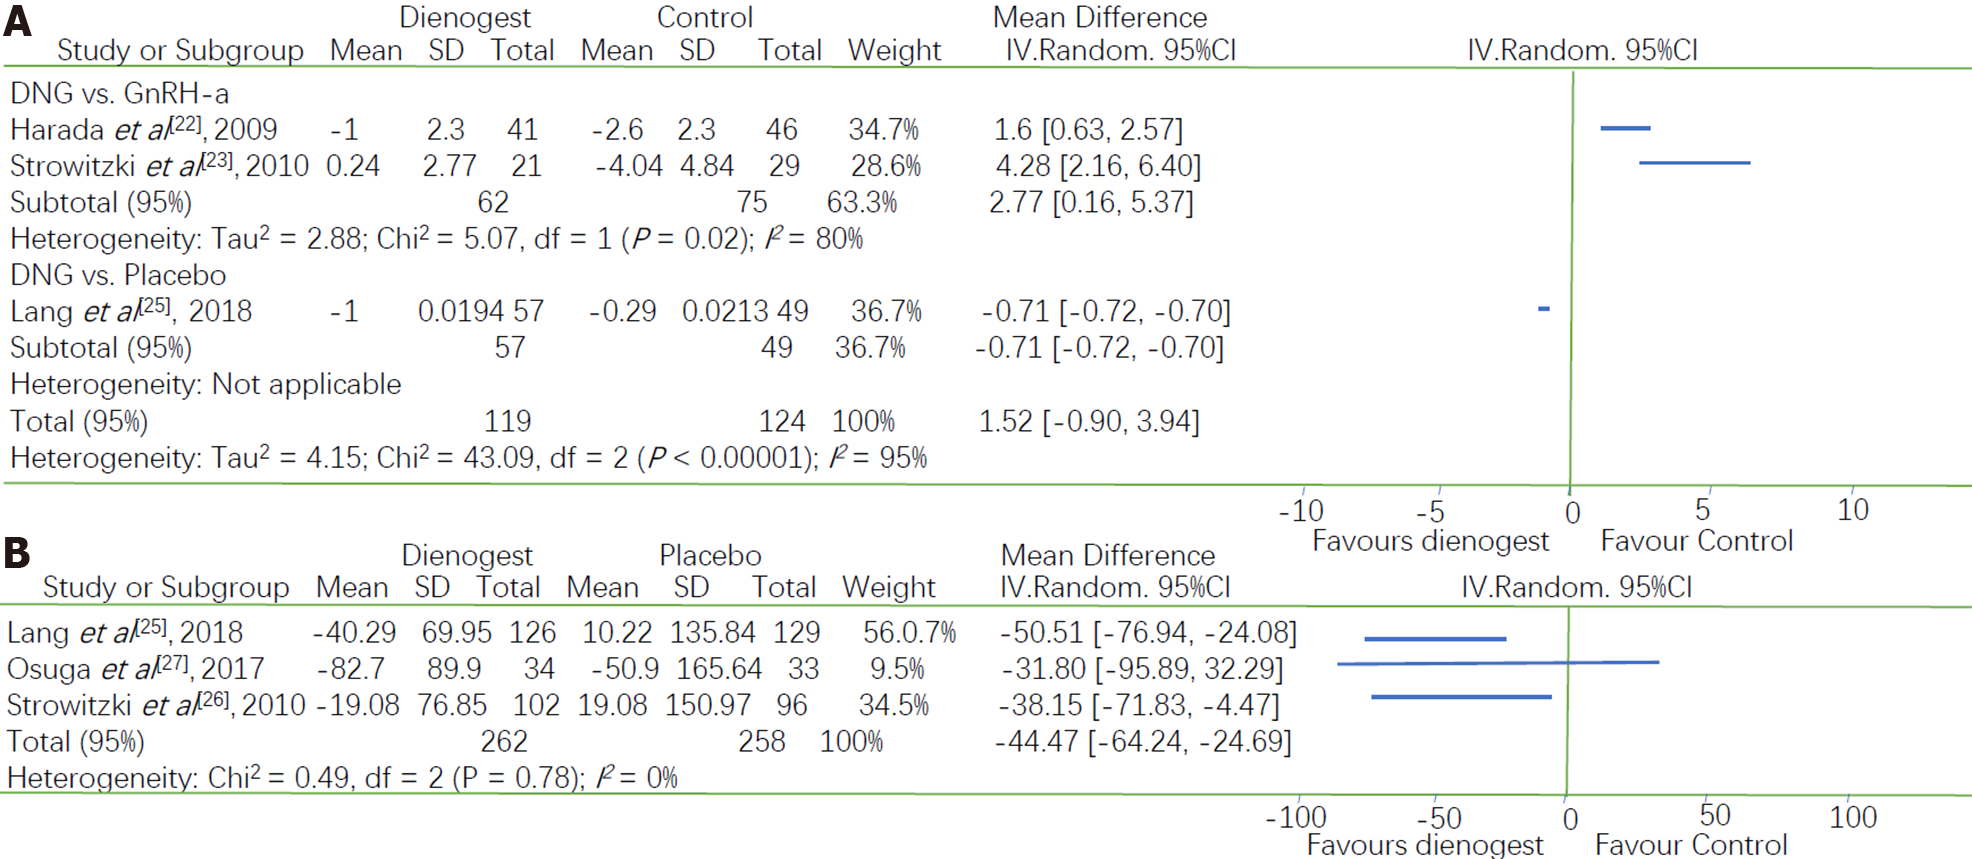
Figure 4 Changes in bone mineral density and serum estradiol.
A: Forest plot showing dienogest vs other intervention (GnRH-a and placebo) in the outcomes of percent change in bone mineral density; B: Forest plot showing dienogest vs placebo in the change of serum estradiol at the end of treatment. CI: Confidence interval.
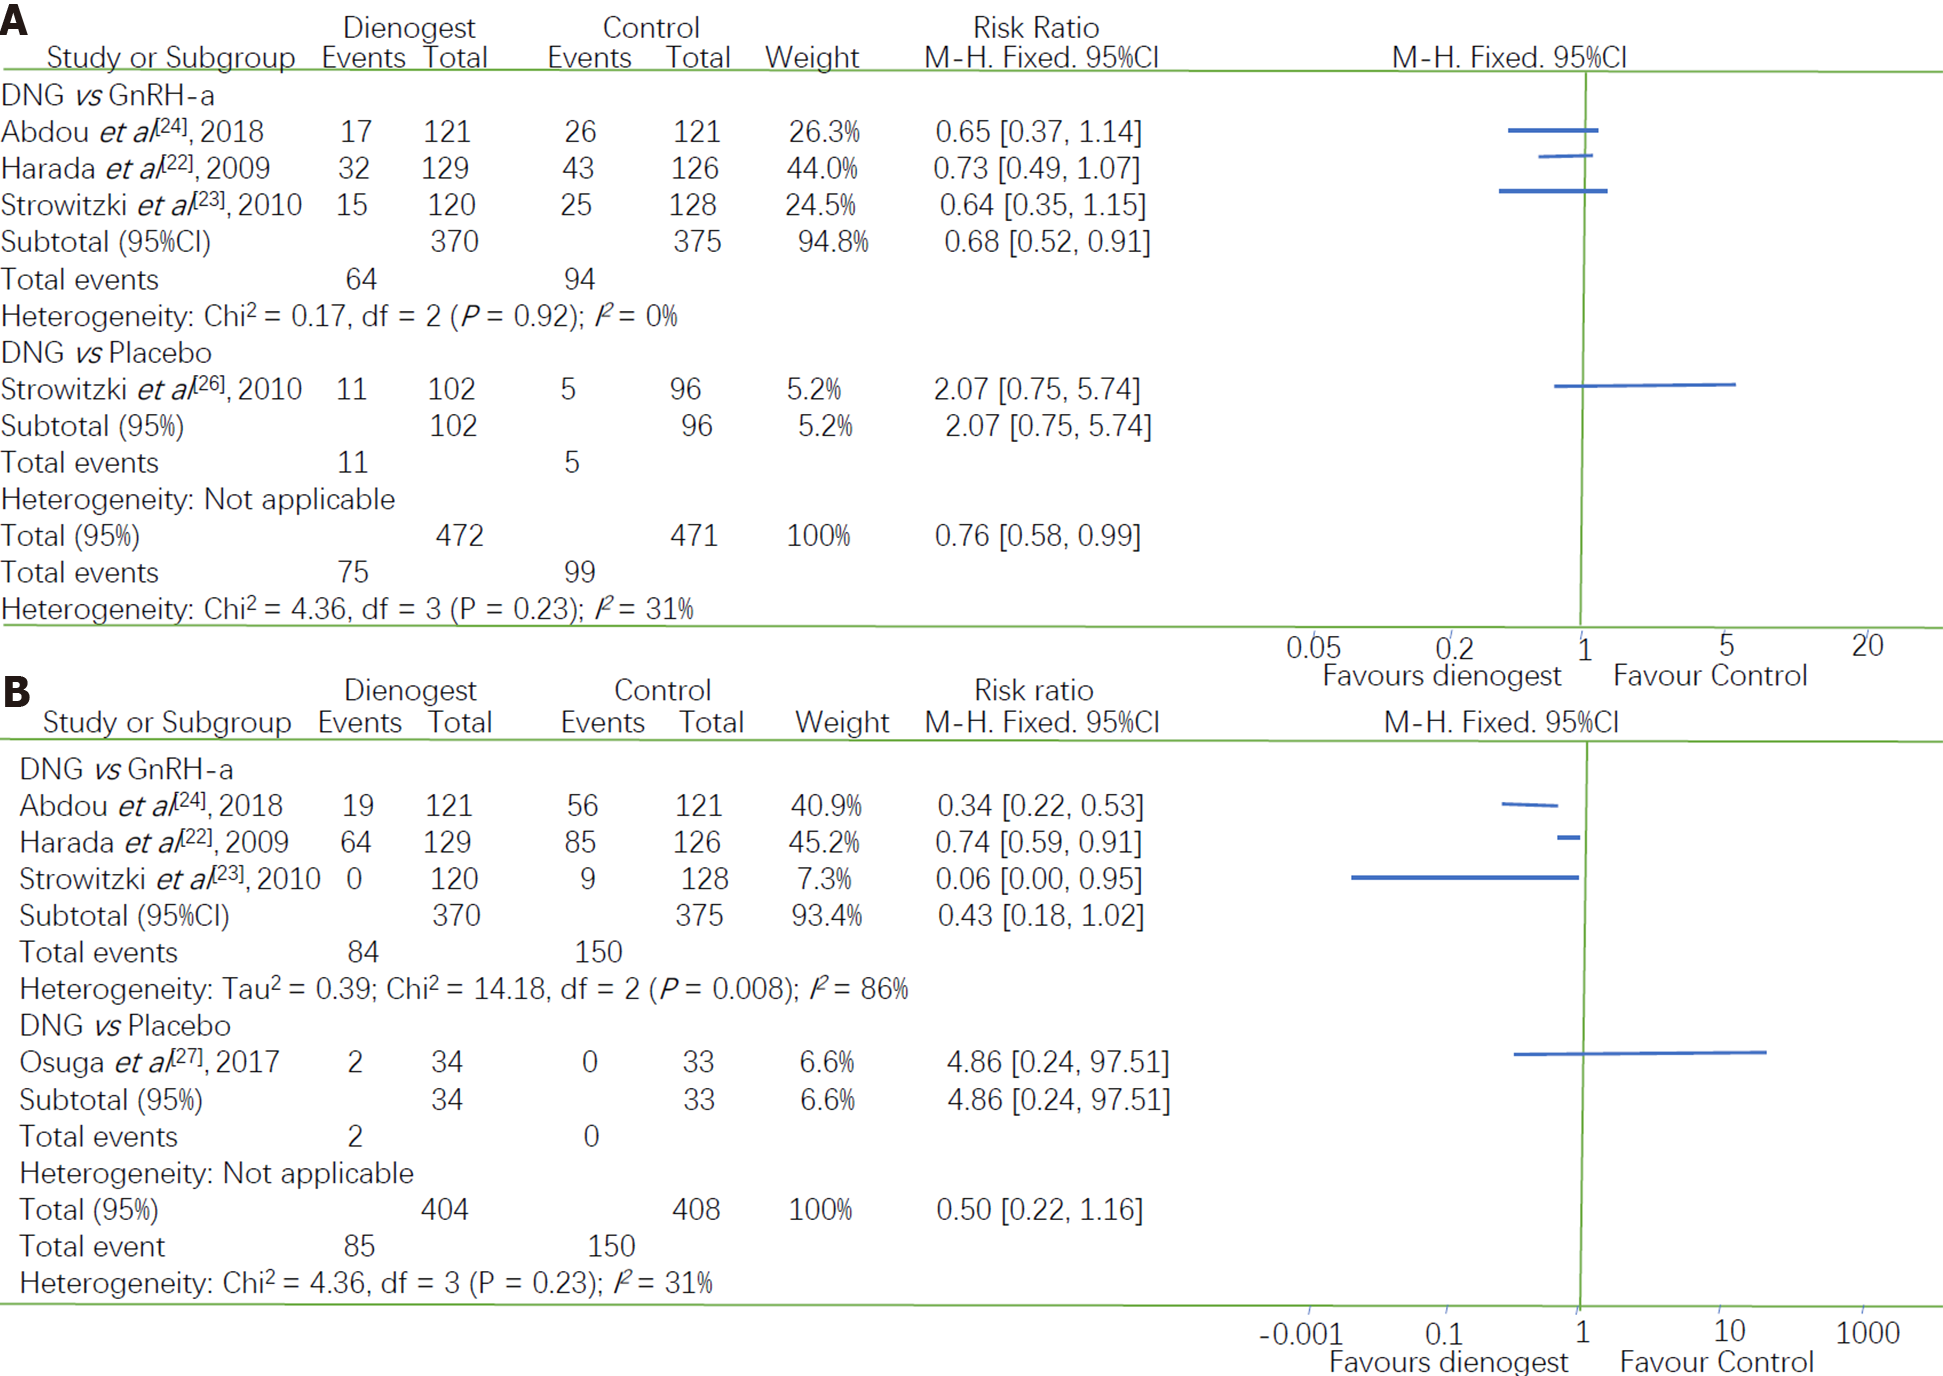
Figure 5 Incidence of headache and hot flushes.
A: Forest plot showing dienogest vs other intervention (GnRH-a and placebo) in the incidence of headache; B: Forest plot showing dienogest vs other intervention (GnRH-a and placebo) in the incidence of hot flushes.
- Citation: Lin SC, Wang XY, Fu XL, Yang WH, Wu H, Bai Y, Shi ZN, Du JP, Wang BJ. Systematic review and Meta-analysis of efficacy and safety of dienogest in treatment of endometriosis. World J Meta-Anal 2021; 9(4): 377-388
- URL: https://www.wjgnet.com/2308-3840/full/v9/i4/377.htm
- DOI: https://dx.doi.org/10.13105/wjma.v9.i4.377


