Published online Nov 6, 2019. doi: 10.12998/wjcc.v7.i21.3419
Peer-review started: March 18, 2019
First decision: May 24, 2019
Revised: June 29, 2019
Accepted: July 27, 2019
Article in press: July 27, 2019
Published online: November 6, 2019
Processing time: 236 Days and 16.9 Hours
The incidence of proximal gastric cancer (GC) is increasing, and methods for the prediction of the long-term survival of proximal GC patients have not been well established.
To develop nomograms for the prediction of long-term survival among proximal GC patients.
Between January 2007 and June 2013, we prospectively collected and retrospectively analyzed the medical records of 746 patients with proximal GC, who were divided into a training set (n = 560, 75%) and a validation set (n = 186, 25%). A Cox regression analysis was used to identify the preoperative and postoperative risk factors for overall survival (OS).
Among the 746 patients examined, the 3- and 5-year OS rates were 66.1% and 58.4%, respectively. In the training set, preoperative T stage (cT), N stage (cN), CA19-9, tumor size, ASA core, and 3- to 6-mo weight loss were incorporated into the preoperative nomogram to predict the OS. In addition to these variables, lymphatic vascular infiltration (LVI), postoperative tumor size, T stage, N stage, blood transfusions, and complications were incorporated into the postoperative nomogram. All calibration curves used to determine the OS probability fit well. In the training set, the preoperative nomogram achieved a C-index of 0.751 [95% confidence interval (CI): 0.732-0.770] in predicting OS and accurately stratified the patients into four prognostic subgroups (5-year OS rates: 86.8%, 73.0%, 43.72%, and 20.9%, P < 0.001). The postoperative nomogram had a C-index of 0.758 in predicting OS and accurately stratified the patients into four prognostic subgroups (5-year OS rates: 82.6%, 74.3%, 45.9%, and 18.9%, P < 0.001).
The nomograms accurately predicted the pre- and postoperative long-term survival of proximal GC patients.
Core tip: The prognosis of patients with proximal gastric cancer (GC) is not ideal. The purpose of this study was to investigate the preoperative and postoperative factors associated with survival among proximal GC patients to establish a corresponding predictive model.
- Citation: Chen QY, Hong ZL, Zhong Q, Liu ZY, Huang XB, Que SJ, Li P, Xie JW, Wang JB, Lin JX, Lu J, Cao LL, Lin M, Tu RH, Zheng CH, Huang CM. Nomograms for pre- and postoperative prediction of long-term survival among proximal gastric cancer patients: A large-scale, single-center retrospective study. World J Clin Cases 2019; 7(21): 3419-3435
- URL: https://www.wjgnet.com/2307-8960/full/v7/i21/3419.htm
- DOI: https://dx.doi.org/10.12998/wjcc.v7.i21.3419
Gastric cancer (GC) is the fourth most common malignant tumor worldwide and currently ranks second among the causes of cancer-related deaths[1]. In recent years, the incidence of proximal GC has been increasing. The biological behaviors of proximal GC and cancer in the lower portion of the stomach exhibit certain differences; most studies suggest that the effect of treating proximal GC is lower than that of treating cancer in the lower portion of the stomach. Currently, although there has been great progress in the early diagnosis of and radical surgery and chemotherapy for proximal GC, the postoperative prognosis of patients with this type of cancer is still not ideal[2]. According to the relevant provisions of the Union for International Cancer Control (UICC), the TNM staging system, which includes infiltration depth, lymph node metastasis, and distant metastasis, is among the most important indexes used to evaluate the prognosis of patients with GC[3]. However, certain differences in the prognosis of patients still exist, even among patients with the same stage of the disease. Determining how to individualize treatment according to the characteristics of cancer patients and the features of the tumor is still a main problem in the treatment of proximal GC.
Nomograms have been used for the construction of several common tumor prognosis prediction models[4-7]. The performance of such nomogram-based models is superior to that of the traditional staging system[8]. Most current studies that analyzed the prognosis of GC patients who underwent individualized treatment and follow-up used a nomogram prediction model based on postoperative factors; however, few scholars have reported a prognosis prediction model associated with a nomogram involving the preoperative factors of proximal GC. A preoperative nomogram prognosis prediction model can be a simple and effective prediction tool for the early identification of a poor prognosis following proximal GC radical surgery and can provide an important reference for choosing appropriate cases for comprehensive preoperative treatment. Therefore, the aim of this study was to develop preoperative and postoperative nomogram prediction models for long-term survival using retrospectively analyzed data from patients with proximal GC based on a prior investigation of the preoperative and postoperative prognostic factors.
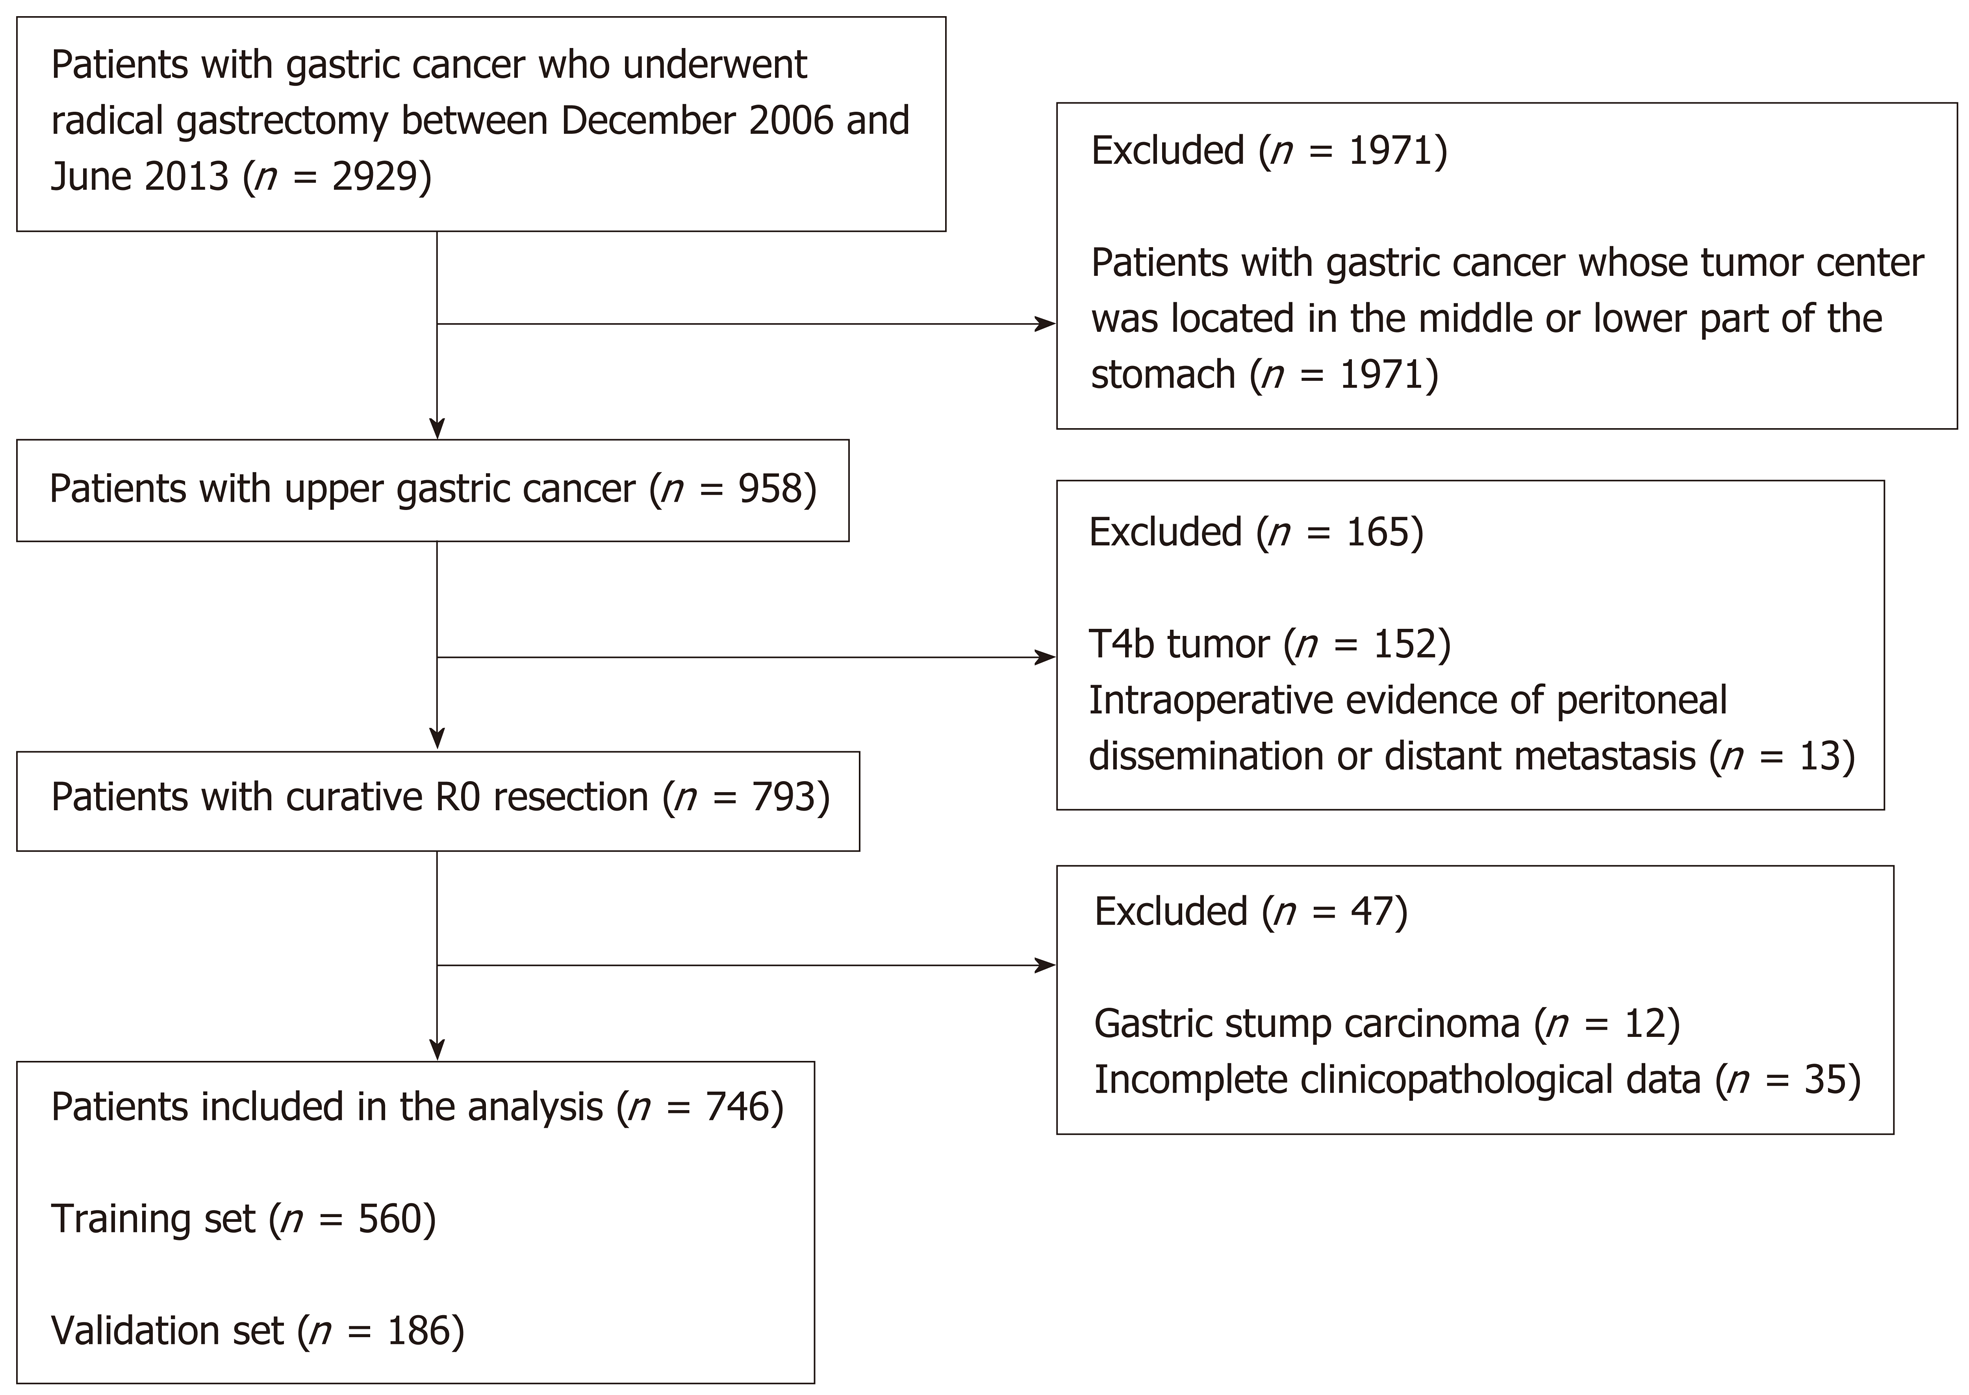
This study involved a retrospective analysis of a prospectively collected database of 2929 GC patients treated by radical surgery at the Department of Gastric Surgery of Fujian Medical University Union Hospital, Fuzhou, China between January 2007 and June 2013. The following inclusion criteria were used: (1) Histologically confirmed primary adenocarcinoma in the proximal third of the stomach; (2) No evidence of tumor invasion in adjacent organs (the pancreas, spleen, liver, or transverse colon), enlargement or integration of the para-aortic or splenic hilar lymph nodes (LNs), or distant metastasis demonstrated by preoperative abdominal computed tomography (CT), abdominal ultrasound, or endoscopic ultrasound; and (3) Total gastrectomy plus D2 lymphadenectomy with curative R0 resection based on the postoperative pathological diagnosis. The exclusion criteria included the following: Any patients in whom the center of the tumor was located in the middle or lower portion of the stomach (n = 1971); patients with T4b tumors (n = 152); intraoperative or postoperative evidence of peritoneal dissemination or distant metastasis (n = 13); incomplete clinicopathological data (n = 35); or gastric stump carcinoma (n = 12). Finally, in total, 746 patients were included in this study (Figure 1). Of these 746 patients, 613 were men (82.2%) and 133 were women (17.8%) with an average age of 63.14 ± 10.05 years. The data from the laboratory blood tests, which were conducted within 1 week prior to surgery, included the preoperative albumin, hemoglobin, tumor marker (CA125, AFP, CA19-9, CA72-4, and CEA), and fibrinogen levels. The preoperative comorbidities were described according to the classification system of the American Society of Anesthesiologists[9]. The postoperative tumor size was determined based on a measurement of a tumor tissue sample removed from the tumor with the largest diameter[10]. The data regarding the patient demographics, underlying diseases, clinicopathology, and preoperative and postoperative monitoring were recorded in a clinical data system for GC surgery. The type of surgical resection and extent of LN dissection were selected according to the Japanese GC treatment guidelines[11]. The resected specimens were histopathologically examined and staged according to the 7th edition of the UICC TNM classification[12].
The research proposal was reviewed by the Research Ethics Committee at the university, and all procedures were performed after obtaining written informed consent from the patients following an explanation of the surgical and oncological risks.
The preoperative T and N stages of the neoplasms were assessed in all patients via proximal digestive endoscopy with a biopsy, chest X-ray, total abdominal ultrasound, and abdominopelvic CT. The preoperative T staging criteria were as follows: cT1-3: tumors located between the mucosal and serosal layers with no evidence of the involvement of the serosal surface or adjacent structures; and cT4: cancer affecting the serosal surface or directly infringing on adjacent structures[13,14]. The preoperative N staging criteria were as follows: cN0: short diameter of the regional lymph nodes less than or equal to 8 mm; and cN+: short diameter of the regional lymph nodes greater than 8 mm[14-16]. Trained investigators performed the postoperative follow-up through mail, telephone calls, home visits, or outpatient services. The overall survival (OS) was calculated from the day of surgery until death or the final follow-up date of June 2016, whichever occurred first.
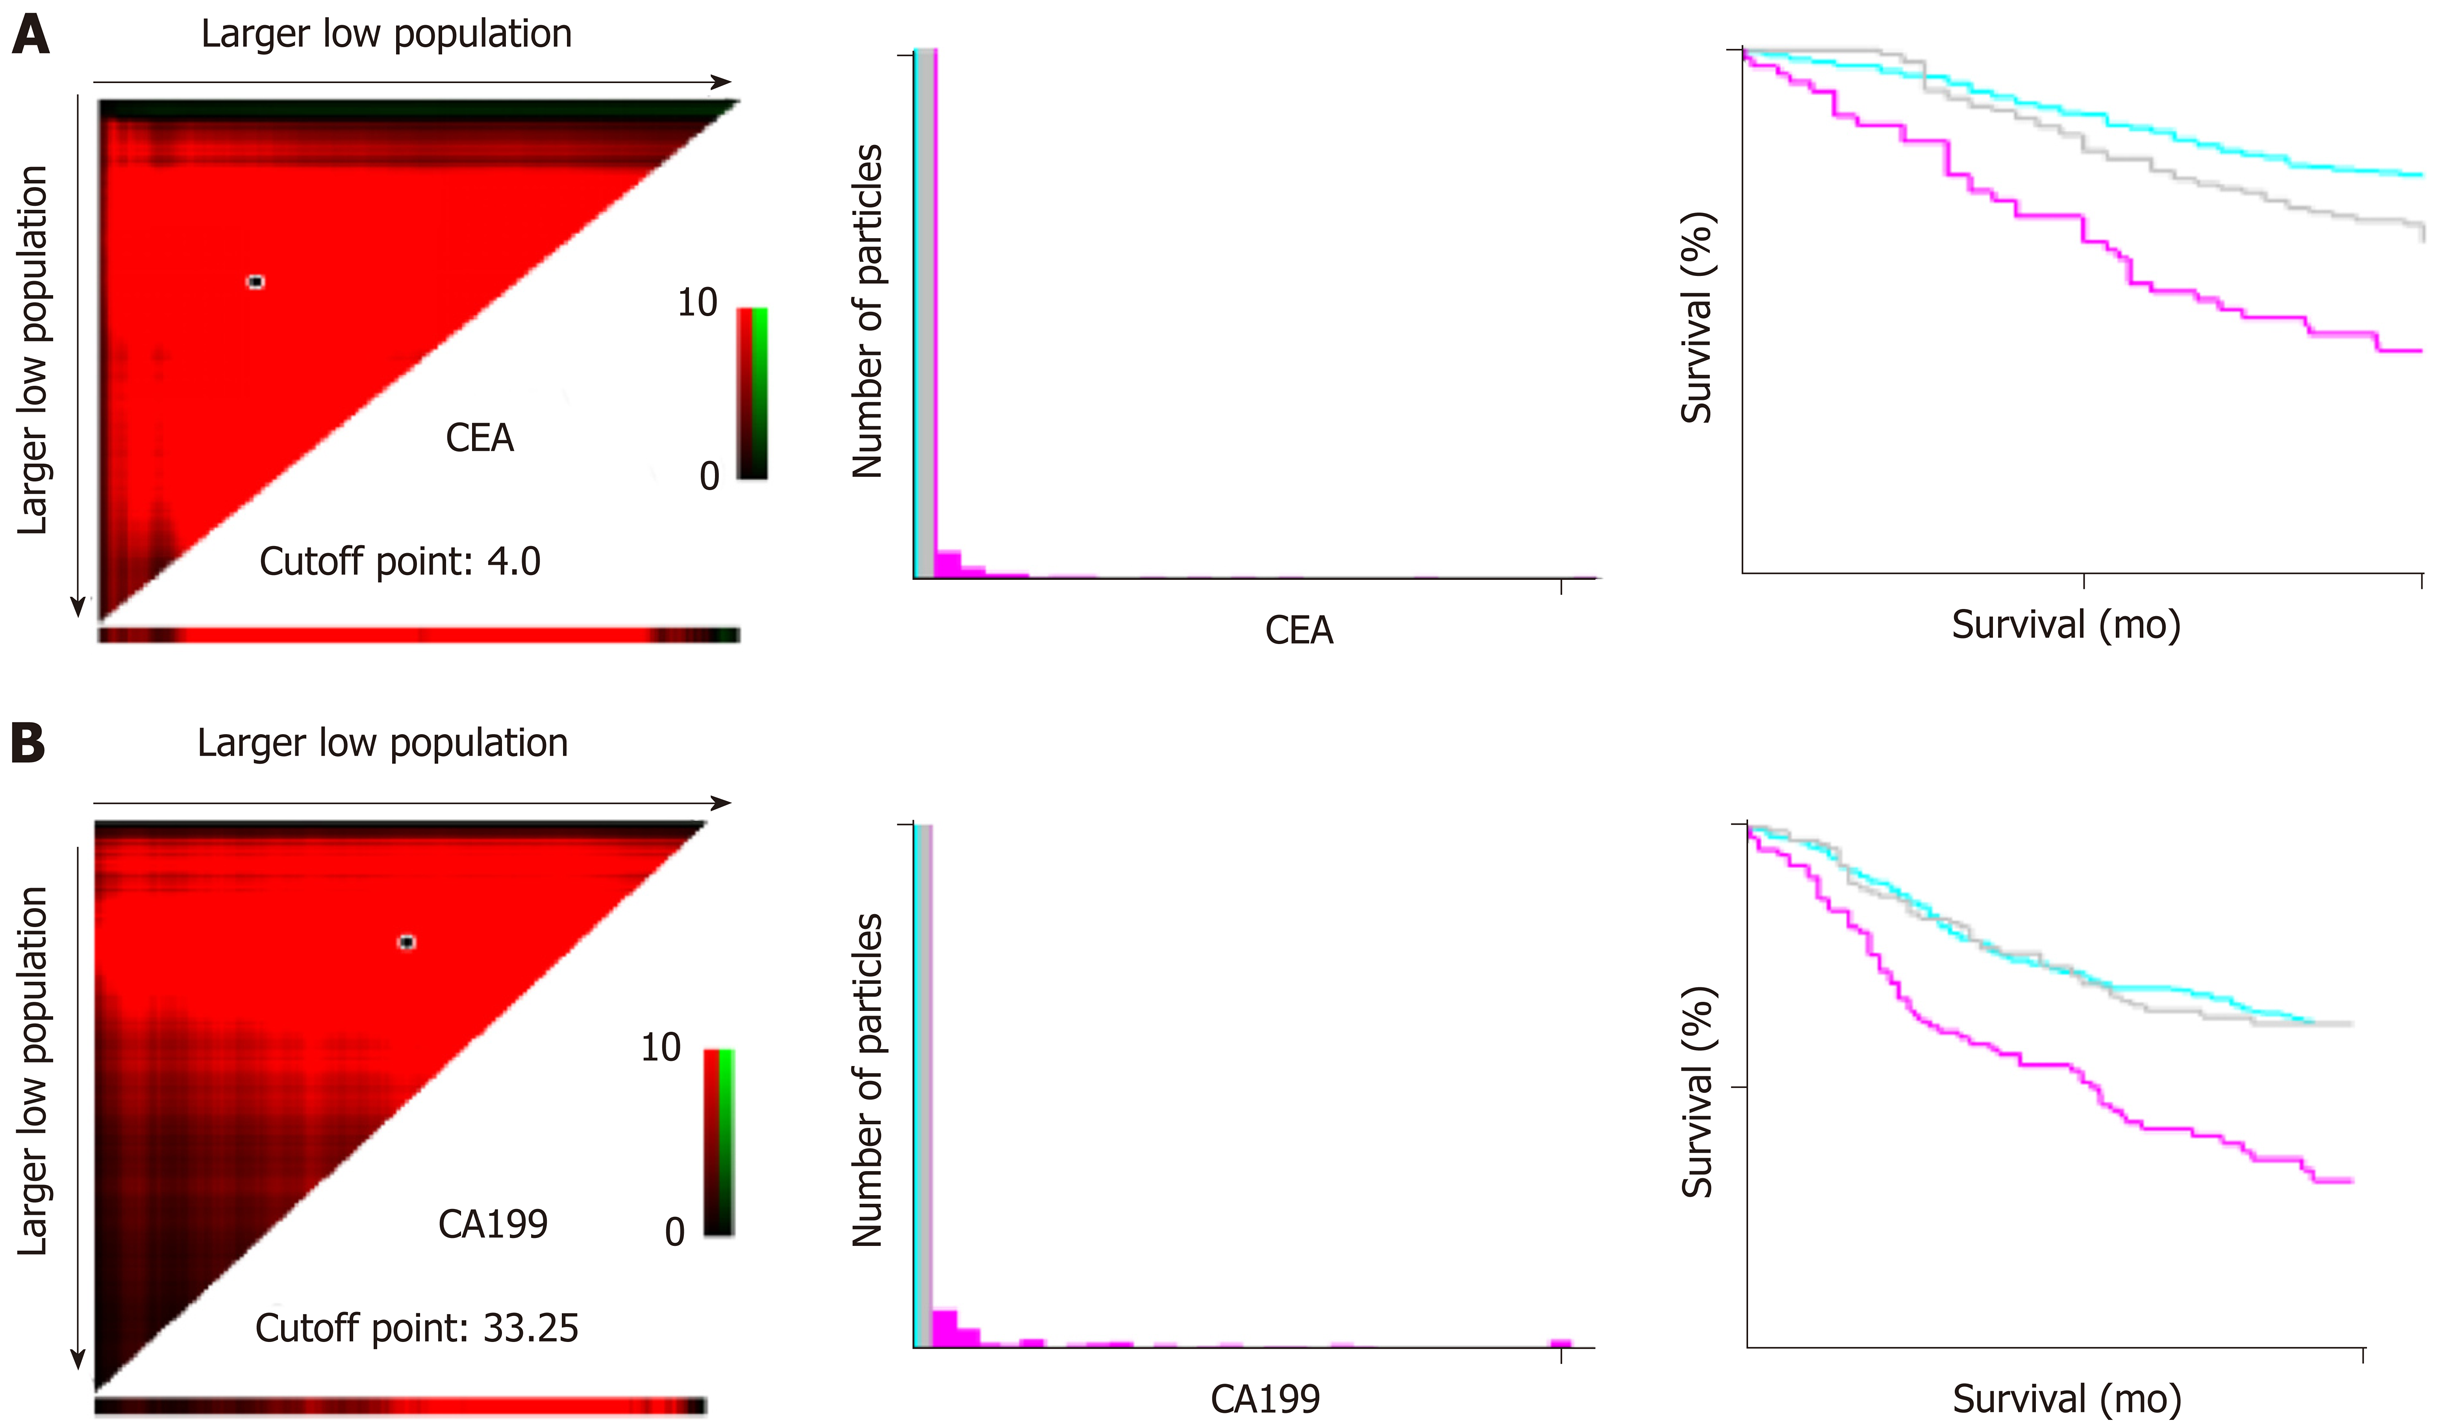
The statistical processing of all data was performed using SPSS version 18.0 (SPSS, Chicago, IL, United States). The optimal threshold levels of the preoperative blood CEA, CA19-9, etc. for predicting prognosis were acquired through the X-tile software[17] (Figure 2). Using random sampling methods in SPSS 18.0, the data were divided 75/25; 75% of the patients were used in the training set, and 25% were included in the validation set. The optimal threshold levels of preoperative blood CEA and CA19-9 for the prediction of prognosis, which were acquired using the log-rank test with the X-tile Software, were 4 ng/mL and 33.35 ng/mL, respectively. The continuous data are reported as the mean ± SD, and the differences between the sets were analyzed using t-tests. The categorical data are presented as proportions and percentages and were analyzed using the chi-square test or Fisher’s exact test. The Kaplan-Meier method was used to conduct the univariate analyses, and the log-rank test was used to compare the significant differences among the subgroups. The Cox regression method was applied for the multivariate analysis of the factors influencing the OS in the patients undergoing surgery for proximal GC. The results of the multiple-factors analysis and each risk grouping are shown with hazard ratio (HR) values and the corresponding 95% confidence intervals (CIs). The R software (version 3.2.0) was used to describe the nomogram based on independent prognostic factors[18,19]. Receiver operating characteristic (ROC) and area under the curve (AUC) analyses were used to determine the adequacy of the prediction models. Values of 0.7 and higher were considered clinically significant, and the optimal cut-off values were established according to the Youden index of the ROC[20]. This model was internally validated through the validation set. P values < 0.05 were considered statistically significant.
Of the 560 patients in the training set, there were 462 men (82.5%) and 98 women (17.5%). The average age was 62.98 ± 10.72 years, and the average body mass index (BMI) was 22.03 ± 3.52 kg/m2. Of the 186 patients in the validation set, 151 (81.2%) were men and 35 (18.8%) were women; the mean age was 63.64 ± 10.00 years, and the average BMI was 21.79 ± 3.57 kg/m2. The preoperative and postoperative clinicopathological data of the patients in the training set did not statistically significantly differ from those of the patients in the validation set (P > 0.05) (Table 1).
| Model set (n = 560) | Validation set (n = 186) | P value | ||
| Age (yr) | 0.648 | |||
| < 65 | 313 | 98 | ||
| ≥ 65 | 247 | 88 | ||
| Gender | 0.446 | |||
| Female | 98 | 35 | ||
| Male | 462 | 151 | ||
| BMI (kg/m2) | 0.382 | |||
| < 25 | 473 | 162 | ||
| ≥ 25 | 87 | 24 | ||
| Preoperative tumor size(cm) | 0.736 | |||
| < 5 | 272 | 93 | ||
| ≥ 5 | 288 | 93 | ||
| Preoperative N stage | 0.965 | |||
| N0 | 269 | 89 | ||
| N+ | 291 | 97 | ||
| Preoperative T stage | 0.066 | |||
| T1-3 | 190 | 77 | ||
| T4 | 370 | 109 | ||
| Preoperative CA19-9 (U/mL) | 0.643 | |||
| < 33.35 | 463 | 151 | ||
| ≥ 33.35 | 97 | 35 | ||
| Preoperative CEA (µg/mL) | 0.487 | |||
| < 4 | 365 | 116 | ||
| ≥ 4 | 195 | 70 | ||
| ASA score | 0.511 | |||
| 1 | 309 | 114 | ||
| 2 | 195 | 58 | ||
| 3 | 55 | 14 | ||
| 4 | 1 | 0 | ||
| Accompanying disease | 0.087 | |||
| No | 359 | 132 | ||
| Yes | 201 | 54 | ||
| History of epigastric operation | 0.432 | |||
| No | 544 | 183 | ||
| Yes | 16 | 3 | ||
| Preoperative Charlson score | 0.311 | |||
| 0 | 368 | 133 | ||
| 1-2 | 184 | 50 | ||
| ≥ 3 | 8 | 3 | ||
| HB, g/L | 0.208 | |||
| ≥ 9.0 | 500 | 172 | ||
| < 9.0 | 60 | 14 | ||
| ALB, g/L | 0.096 | |||
| ≥ 35 | 418 | 150 | ||
| < 35 | 142 | 36 | ||
| Fibrinogen, g/L | 0.067 | |||
| < 4 | 364 | 107 | ||
| ≥ 4 | 196 | 79 | ||
| 3- to 6-mo weight reduction | 0.835 | |||
| No | 321 | 105 | ||
| Yes | 239 | 81 | ||
| Lymph node ratio | 0.158 ± 0.200 | 0.192 ± 0.227 | 0.069 | |
| Postoperative T stage | 0.248 | |||
| T1 | 73 | 35 | ||
| T2 | 67 | 19 | ||
| T3 | 162 | 54 | ||
| T4a | 258 | 78 | ||
| Postoperative N stage | 0.583 | |||
| N0 | 169 | 65 | ||
| N1 | 95 | 26 | ||
| N2 | 101 | 34 | ||
| N3 | 195 | 61 | ||
| Involvement of the esophagus with the tumor | 0.028 | |||
| No | 370 | 139 | ||
| Yes | 190 | 47 | ||
| Postoperative tumor size (cm) | 0.233 | |||
| < 5 | 231 | 86 | ||
| ≥ 5 | 329 | 100 | ||
| LVI | 0.72 | |||
| No | 408 | 133 | ||
| Yes | 152 | 53 | ||
| Postoperative blood transfusion | 0.745 | |||
| No | 498 | 167 | ||
| Yes | 62 | 19 | ||
| General complications | 0.495 | |||
| No | 486 | 165 | ||
| Yes | 74 | 21 | ||
| Presence of digestive tract fistula | 0.498 | |||
| No | 552 | 182 | ||
| Yes | 8 | 4 | ||
| Postoperative obstruction | 1 | |||
| No | 553 | 184 | ||
| Yes | 7 | 2 | ||
| Infection of incisional wound | 0.339 | |||
| No | 555 | 186 | ||
| Yes | 5 | 0 | ||
| Intra-abdominal infection | 0.422 | |||
| No | 549 | 184 | ||
| Yes | 11 | 2 | ||
| Pulmonary infection | 0.459 | |||
| No | 521 | 170 | ||
| Yes | 39 | 16 | ||
| Peritoneal lymphatic fistula | 0.751 | |||
| No | 550 | 182 | ||
| Yes | 10 | 4 | ||
| Intra-abdominal hemorrhage | 0.74 | |||
| No | 552 | 183 | ||
| Yes | 8 | 3 | ||
| Neoadjuvant chemotherapy | 1 | |||
| No | 548 | 183 | ||
| Yes | 12 | 3 | ||
| Adjuvant chemotherapy | 0.069 | |||
| No | 258 | 100 | ||
| Yes | 302 | 86 | ||
As of the June 2016 follow-up, the patient groups had a median follow-up time of 72 mo (36-112 mo), and the follow-up rate was 97.3%. The 3- and 5-year OS rates among the patients in the training set were 64.9% and 57.3%, respectively. Among the patients in the validation set, the 3- and 5-year OS rates were 69.7% and 62.1%, respectively.
Univariate and multivariate methods were used to analyze the preoperative and postoperative factors associated with OS in the postoperative proximal GC patients. The preoperative single-factor analysis showed that age, preoperative T stage (cT), preoperative N stage (cN), preoperative CA19-9, CEA, ALB, and fibrinogen levels, ASA score, preoperative tumor size, and weight loss in 3-6 mo could significantly affect the OS (P < 0.05). The multi-factor analysis showed that cT, cN, preoperative CA19-9 level, ASA score, preoperative tumor size, and weight loss in 3-6 mo were independent preoperative risk factors affecting OS (Table 2). The postoperative single-factor analysis showed that postoperative T stage and N stage, postoperative tumor size, vascular invasion, postoperative blood transfusion, postoperative complications, and neoadjuvant chemotherapy could significantly affect the OS (P < 0.05). The multiple-factor analysis showed that postoperative T stage and N stage, postoperative vascular nerve invasion, tumor size, postoperative blood transfusion, and postoperative overall complications were also independent postoperative risk factors for OS (Table 3).
| Univariate analysis | Multivariate analysis | |||
| Variable | HR (95%CI) | P value | HR (95%CI) | P value |
| Preoperative tumor size(cm) | < 0.001 | 0.012 | ||
| < 5 | Ref | Ref | ||
| ≥ 5 | 2.953 (2.227-3.915) | 1.480 (1.090-2.010) | ||
| Preoperative N stage | < 0.001 | < 0.001 | ||
| N0 | Ref | Ref | ||
| N+ | 3.219 (2.428-4.268) | 2.069 (1.536-2.787) | ||
| Preoperative T stage | < 0.001 | < 0.001 | ||
| T1-3 | Ref | Ref | ||
| T4 | 4.550 (3.132-6.609) | 2.767 (1.846-4.148) | ||
| Preoperative CA19-9 (U/mL) | < 0.001 | 0.003 | ||
| < 33.35 | Ref | Ref | ||
| ≥ 33.35 | 2.250 (1.750-2.894) | 1.569 (1.166-2.110) | ||
| ASA score | < 0.001 | < 0.001 | ||
| 1 | Ref | Ref | ||
| 2 | 1.725 (1.299-2.289) | 1.675 (1.257-2.230) | ||
| 3 | 3.805 (2.677-5.409) | 3.257 (2.271-4.670) | ||
| 3- to 6-mo weight loss | < 0.001 | 0.036 | ||
| No | Ref | Ref | ||
| Yes | 1.588 (1.231-2.049) | 1.316 (1.019-1.701) | ||
| Age (yr) | 0.008 | |||
| < 65 | Ref | |||
| ≥ 65 | 1.412 (1.095-1.821) | |||
| Gender | 0.318 | |||
| Female | Ref | |||
| Male | 1.178 (0.854-1.625) | |||
| BMI (kg/m2) | 0.473 | |||
| <25 | Ref | |||
| ≥ 25 | 0.875 (0.609-1.259) | |||
| Accompanying disease | 0.673 | |||
| No | Ref | |||
| Yes | 0.944 (0.724-1.232) | |||
| History of abdominal surgery | 0.704 | |||
| No | Ref | |||
| Yes | 1.146 (0.566-2.321) | |||
| Preoperative Charlson score | ||||
| 0 | Ref | |||
| 1-2 | 1.007 (0.768-1.322) | 0.959 | ||
| ≥ 3 | 2.202 (0.973-4.982) | 0.058 | ||
| Preoperative CEA (µg/mL) | <0.001 | |||
| < 4 | Ref | |||
| ≥ 4 | 1.673 (1.294-2.164) | |||
| HB, g/L | 0.265 | |||
| ≥ 9.0 | Ref | |||
| < 9.0 | 1.239 (0.850-1.808) | |||
| ALB, g/L | 0.014 | |||
| ≥ 35 | Ref | |||
| < 35 | 1.410 (1.072-1.854) | |||
| Fibrinogen, g/L | 0.003 | |||
| < 4 | Ref | |||
| ≥ 4 | 1.471 (1.137-1.904) | |||
| Univariate analysis | Multivariate analysis | |||
| Variable | HR (95%CI) | P value | HR (95%CI) | P value |
| Postoperative T stage | < 0.001 | 0.005 | ||
| T1 | Ref | Ref | ||
| T2 | 2.743 (1.054-7.139) | 2.210 (0.843-5.794) | ||
| T3 | 6.359 (2.759-14.657) | 2.730 (1.130-6.594) | ||
| T4a | 9.829 (4.345-22.235) | 3.847 (1.595-9.278) | ||
| Postoperative N stage | < 0.001 | < 0.001 | ||
| N0 | Ref | Ref | ||
| N1 | 1.371 (0.820-2.290) | 0.962 (0.564-1.639) | ||
| N2 | 1.984 (1.250-3.151) | 1.251 (0.767-2.041) | ||
| N3 | 5.967 (4.109-8.663) | 2.659 (1.708-4.139) | ||
| Postoperative tumor size(cm) | < 0.001 | 0.022 | ||
| < 5 | Ref | Ref | ||
| ≥ 5 | 2.938 (2.172-2.973) | 1.503 (1.060-2.132) | ||
| Lymphatic vascular infiltration (LVI) | < 0.001 | < 0.001 | ||
| No | Ref | Ref | ||
| Yes | 3.185 (2.447-4.146) | 2.690 (2.036-3.554) | ||
| Postoperative blood transfusion | < 0.001 | 0.025 | ||
| No | Ref | Ref | ||
| Yes | 1.971 (1.402-2.771) | 1.505 (1.052-2.153) | ||
| General complications | 0.001 | 0.028 | ||
| No | Ref | Ref | ||
| Yes | 1.784 (1.278-2.490) | 1.477 (1.042-2.093) | ||
| Digestive tract fistula | 0.125 | |||
| No | Ref | |||
| Yes | 2.001 (0.825-4.855) | |||
| Postoperative obstruction | 0.033 | |||
| No | Ref | |||
| Yes | 2.629 (1.083-6.386) | |||
| Incisional infection | 0.984 | |||
| No | Ref | |||
| Yes | 0.986 (0.245-3.966) | |||
| Abdominal infection | 0.964 | |||
| No | Ref | |||
| Yes | 1.021 (0.421-2.476) | |||
| Pulmonary infection | 0.001 | |||
| No | Ref | |||
| Yes | 2.104 (1.378-3.211) | |||
| Peritoneal lymphatic fistula | 0.565 | |||
| No | Ref | |||
| Yes | 1.297 (0.535-3.147) | |||
| intra-Abdominal hemorrhage | 0.093 | |||
| No | Ref | |||
| Yes | 2.136 (0.880-5.181) | |||
| Tumor involvement of the esophagus | 0.328 | |||
| No | Ref | |||
| Yes | 1.141 (0.876-1.487) | |||
| Neoadjuvant chemotherapy | 0.012 | |||
| No | Ref | |||
| Yes | 2.480 (1.225-5.022) | |||
| Adjuvant chemotherapy | ||||
| No | Ref | |||
| Yes | 1.166 (0.902-1.507) | 0.242 | ||
| Lymph node ratio | 1.697 (0.998-2.867) | 0.053 | ||
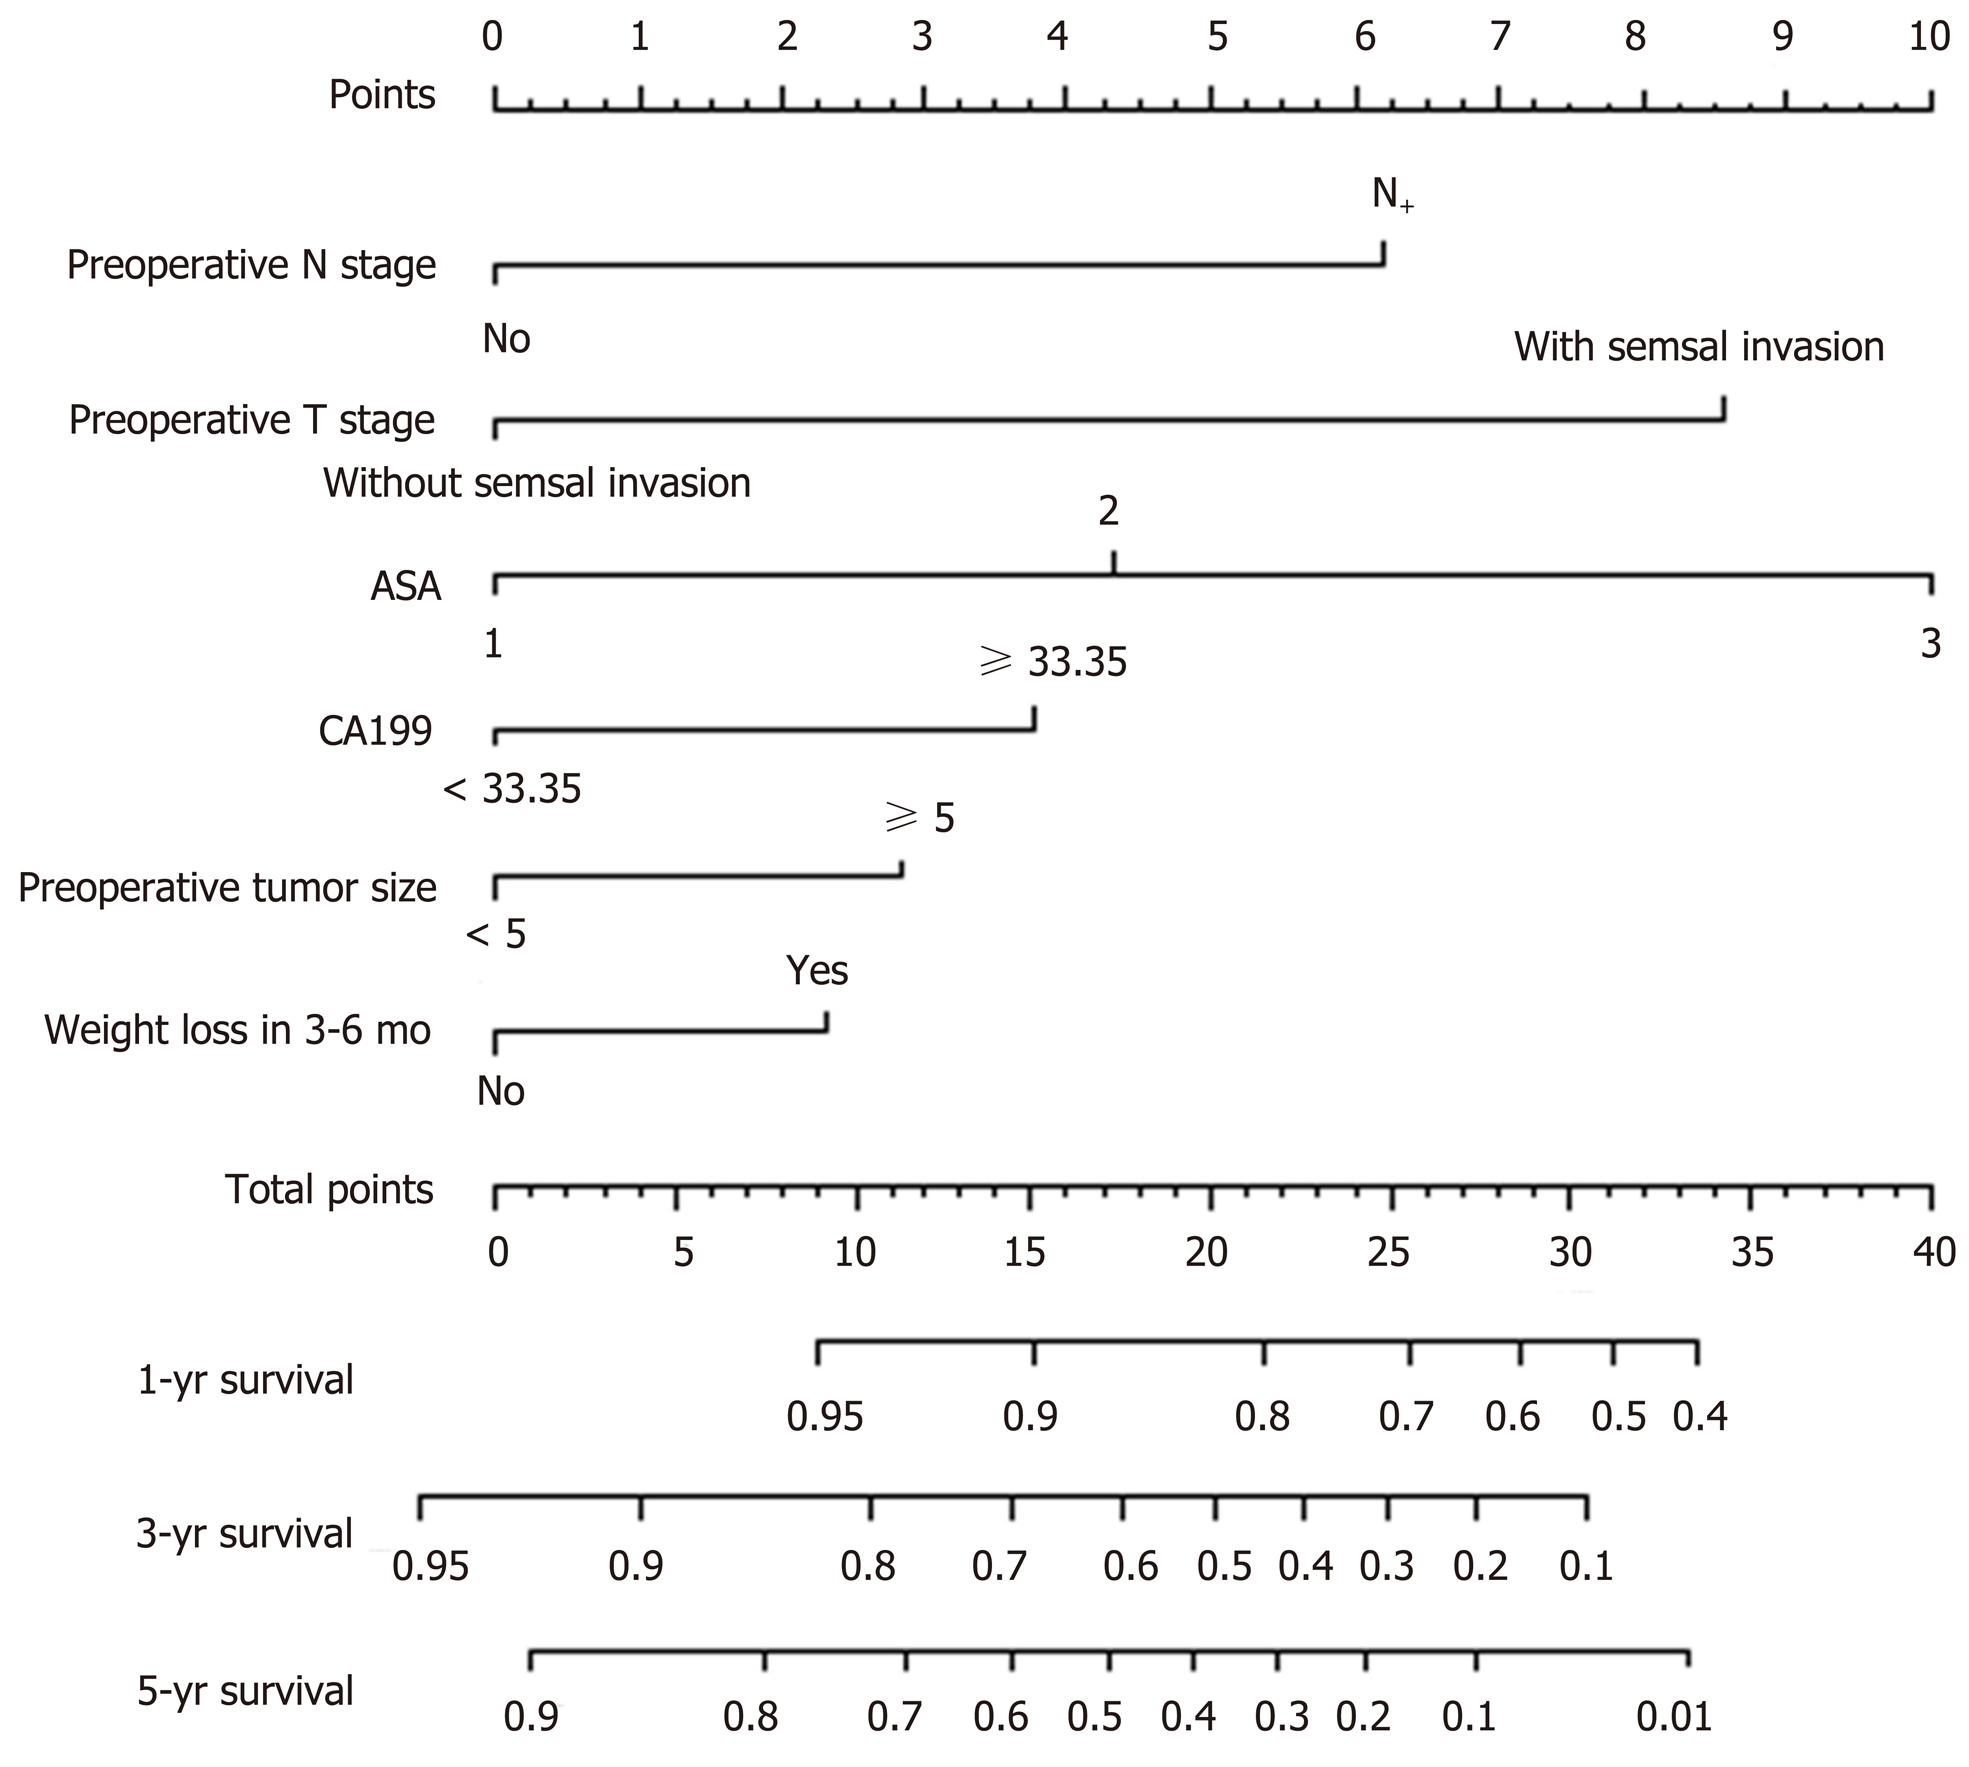
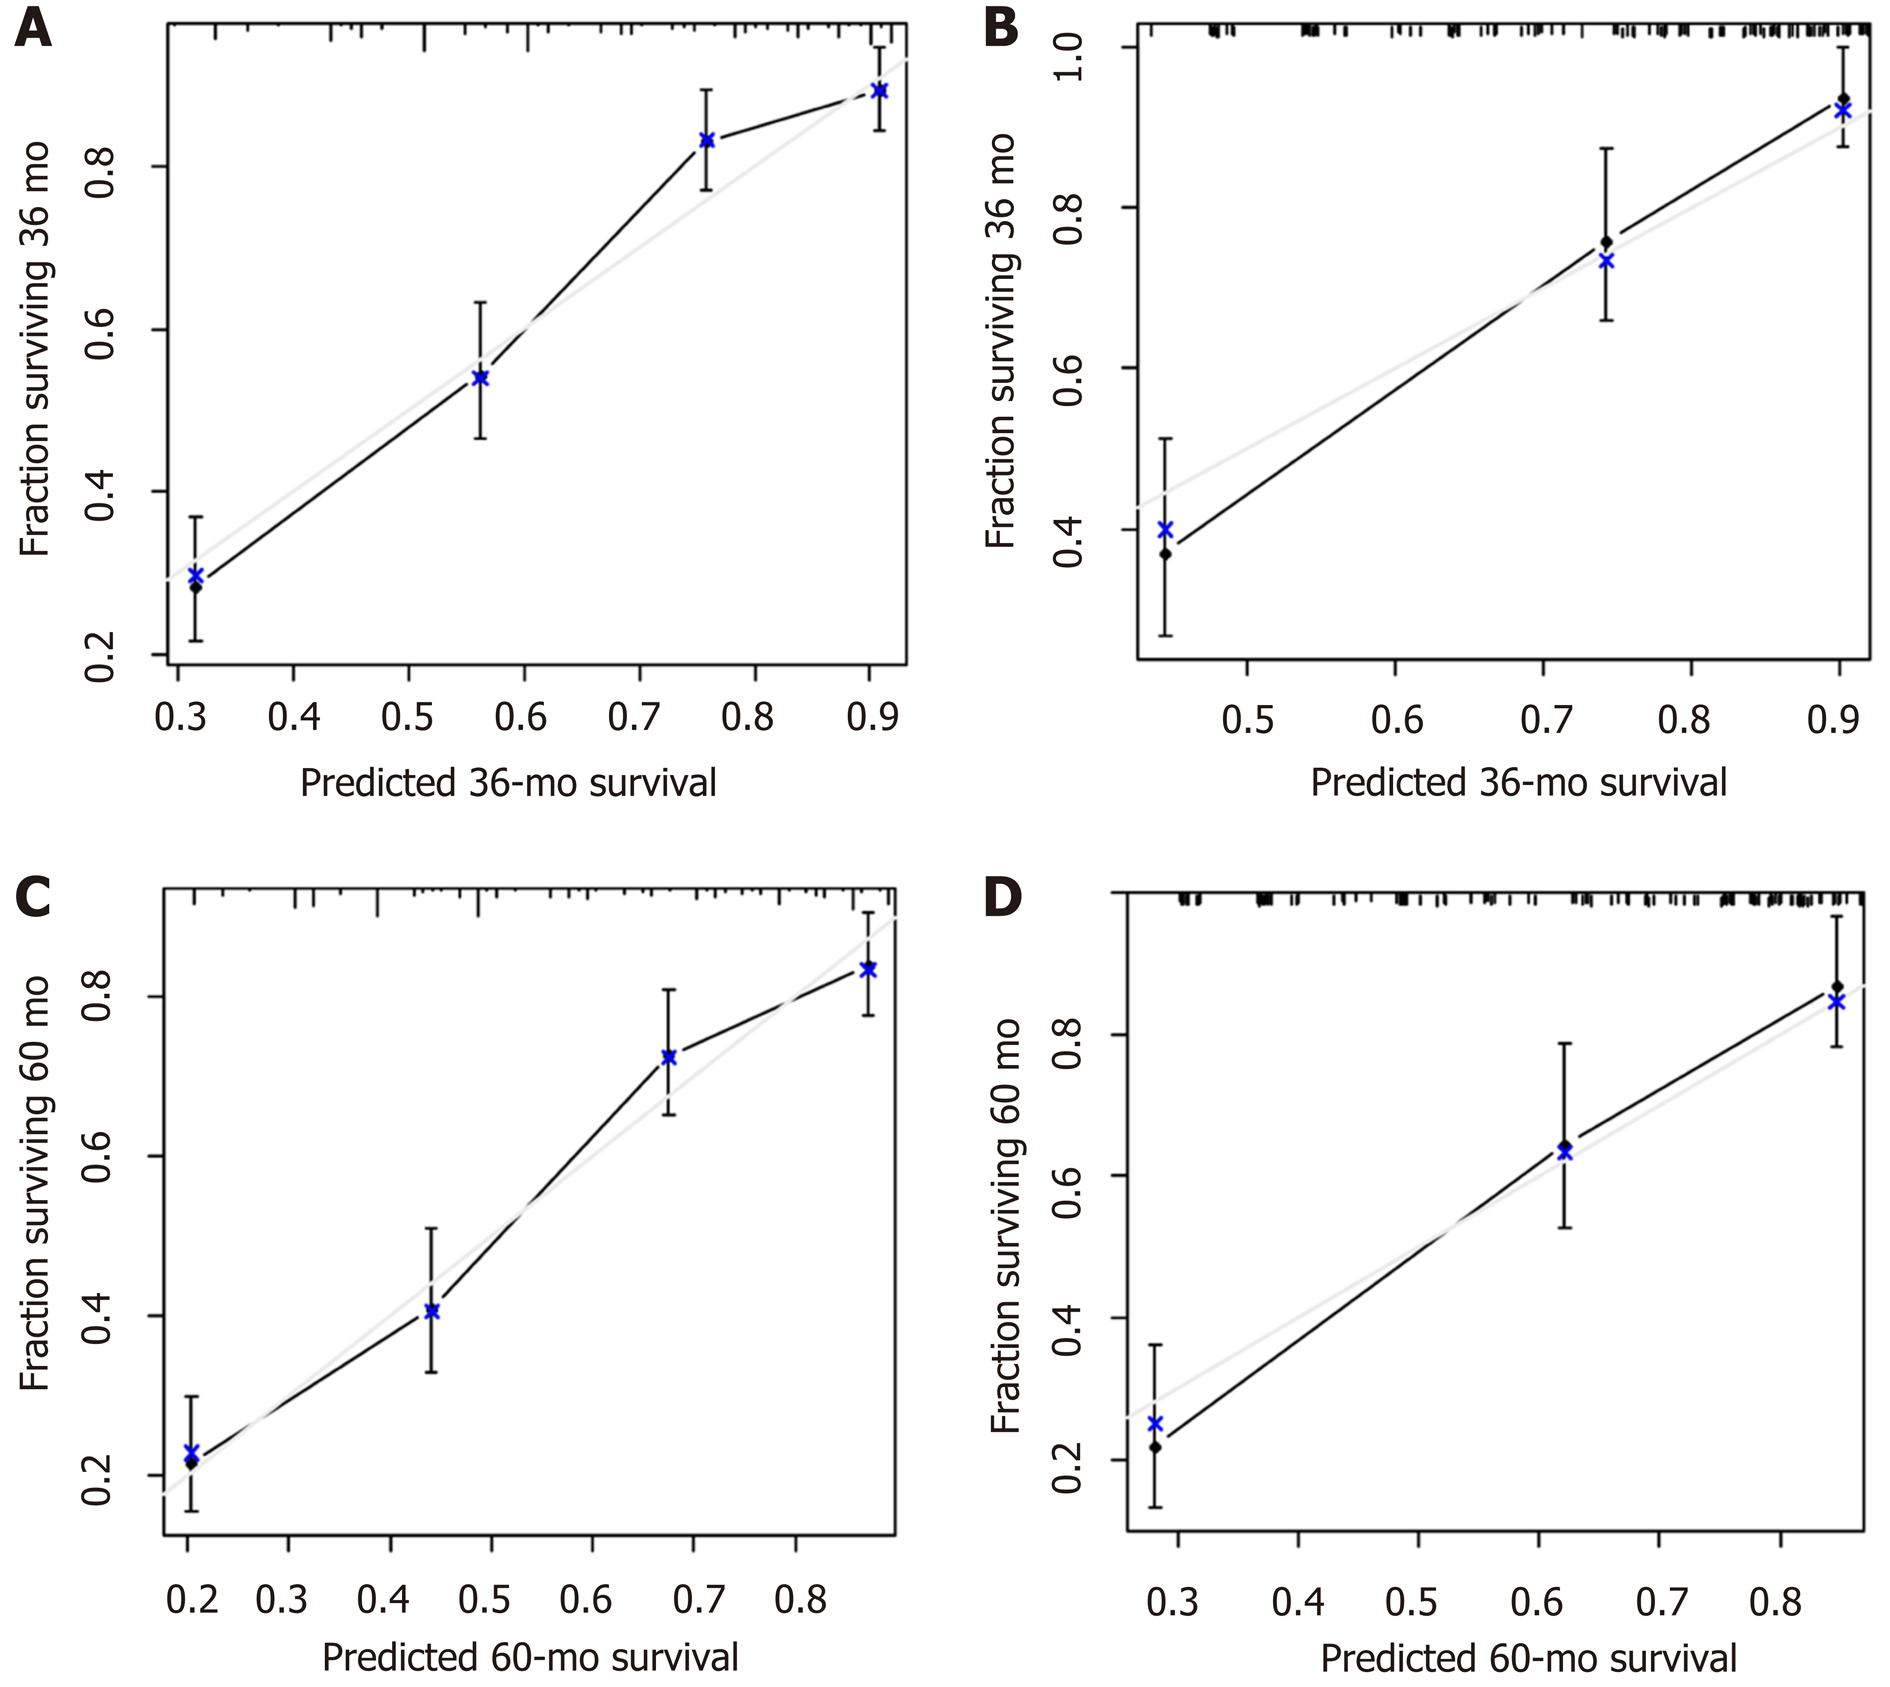
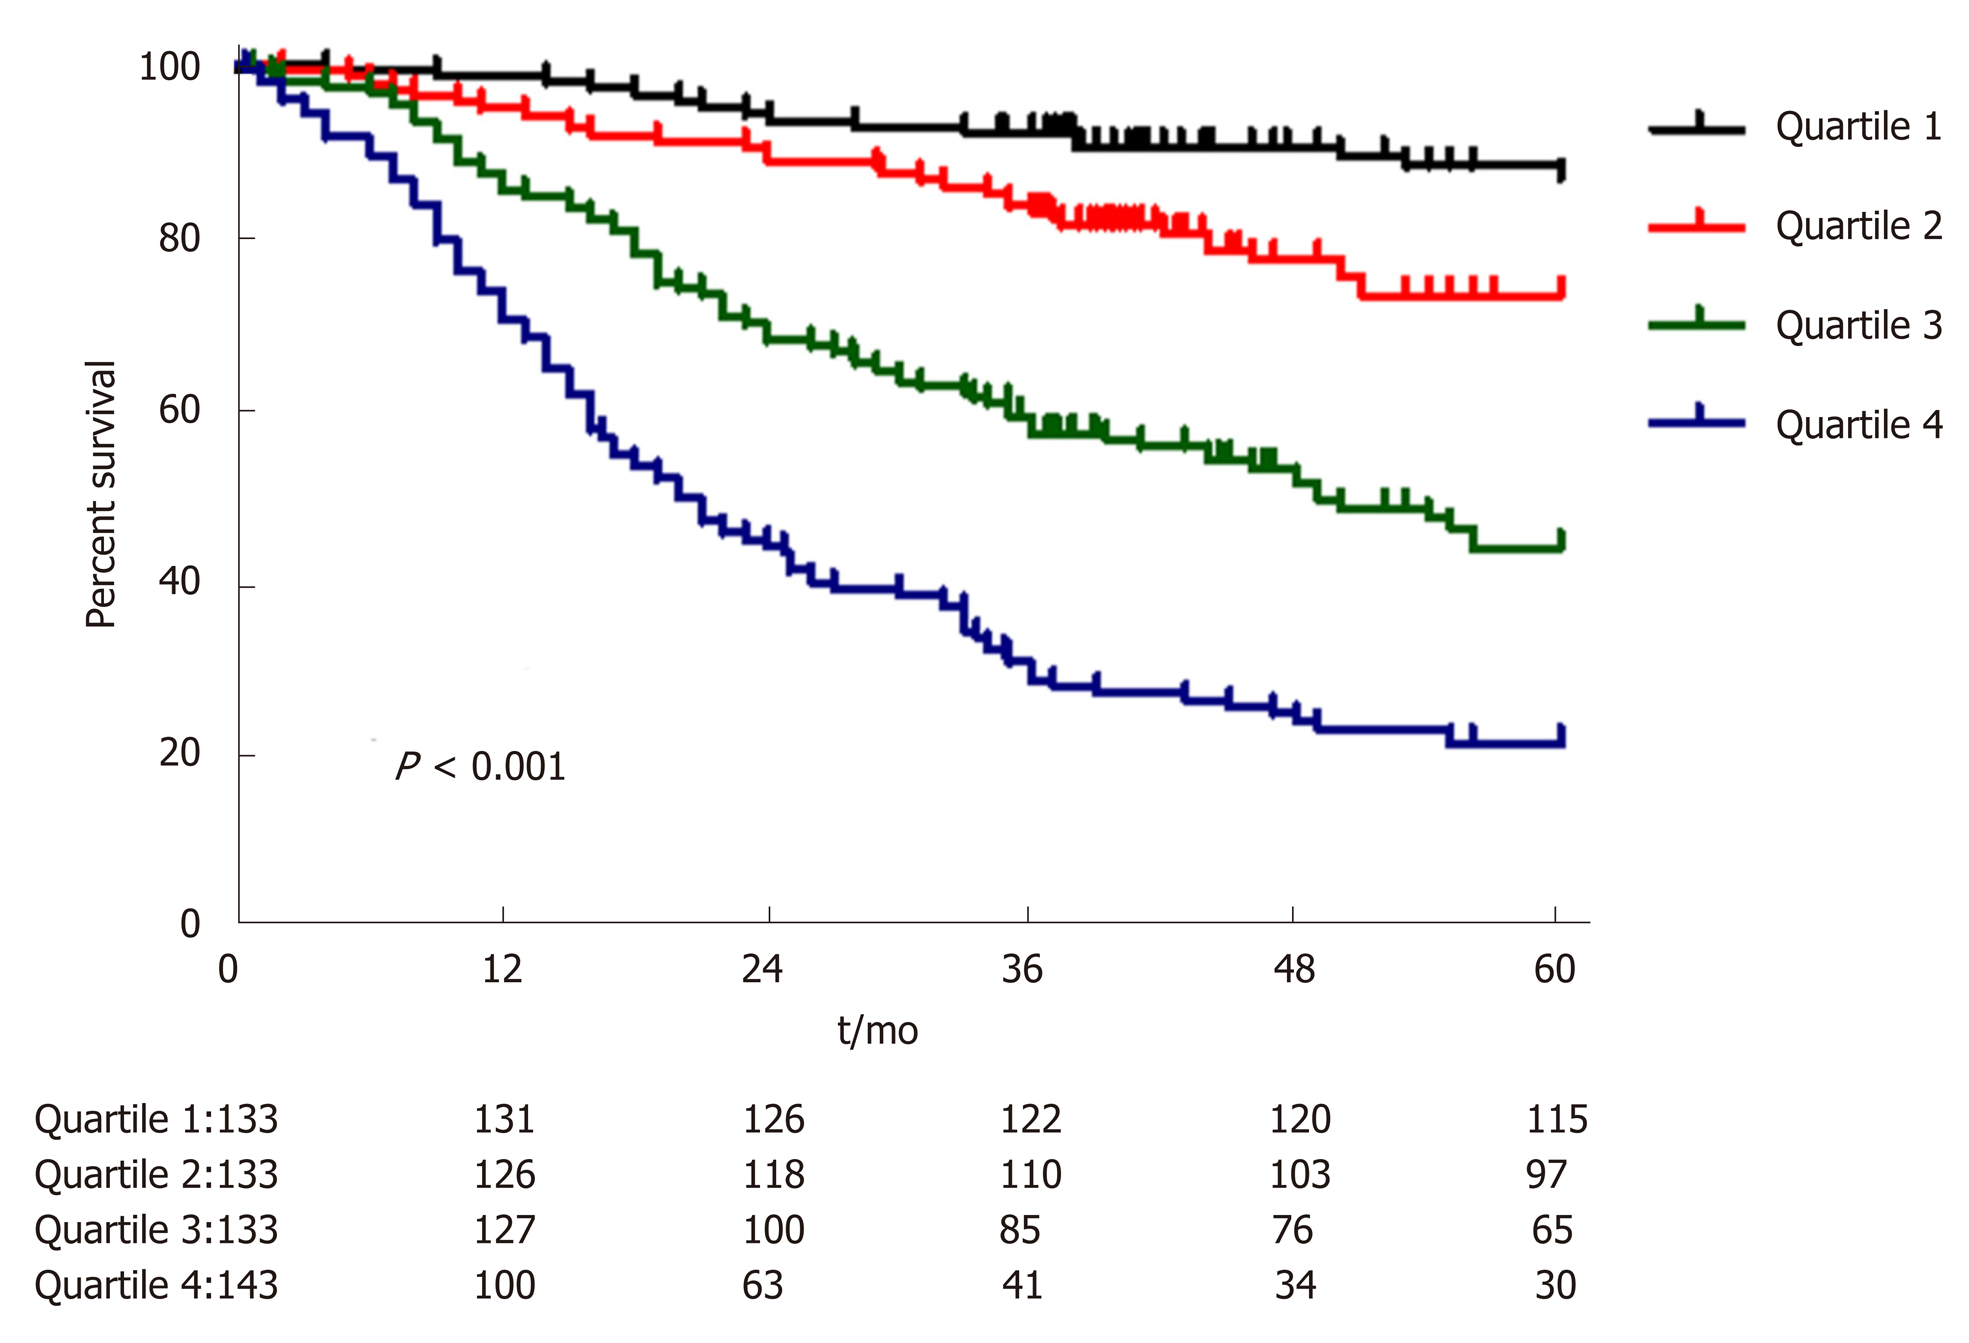
A nomogram prediction model was developed based on the preoperative independent risk factors that affected the OS in the postoperative proximal GC patients (Figure 3). The C-index of the forecasting model was 0.751 (95%CI: 0.732-0.770). The postoperative 3-year and 5-year OS rate calibration curves indicated that the discriminative ability of the nomogram prediction model was similar to that of actual observation (Figure 4). To further test the validity of the nomogram prediction model, we divided the patients into quartile 1, quartile 2, quartile 3, and quartile 4 to obtain four different prognosis levels according to the score obtained from the forecast model; the 5-year OS rates of the four subgroups were 86.8%, 73.0%, 43.72%, and 20.9% (P < 0.001) (Figure 5).
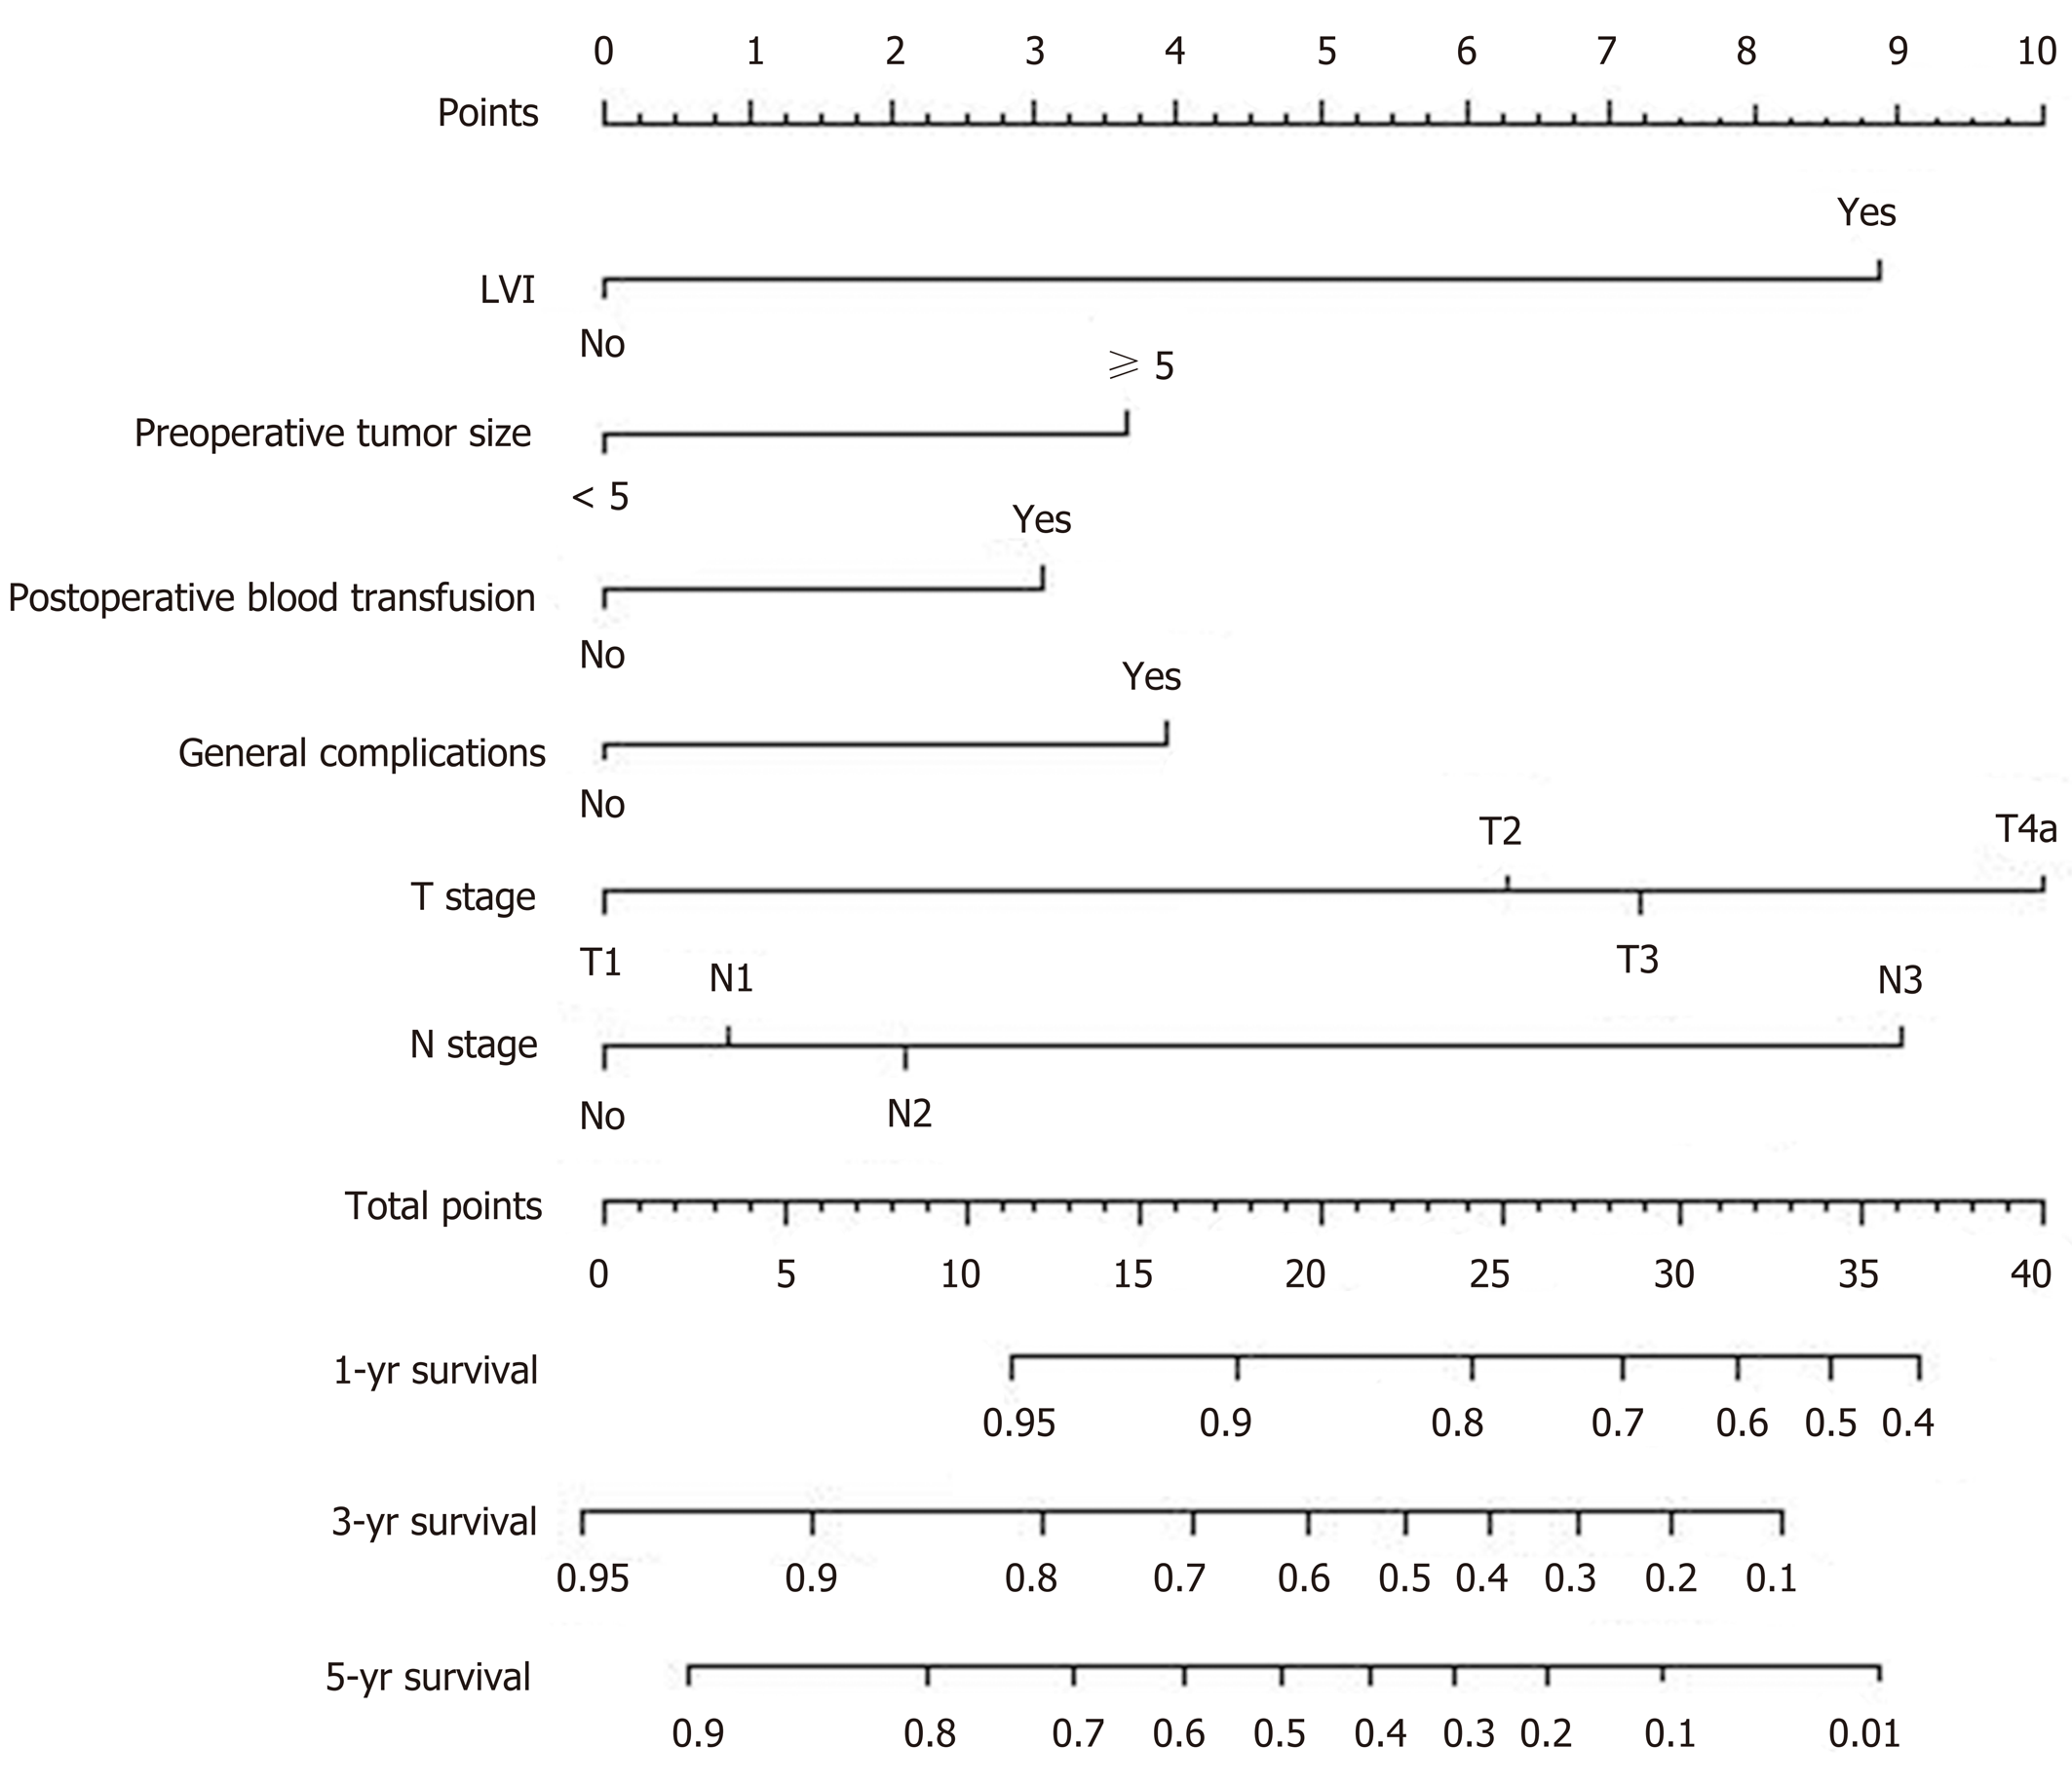
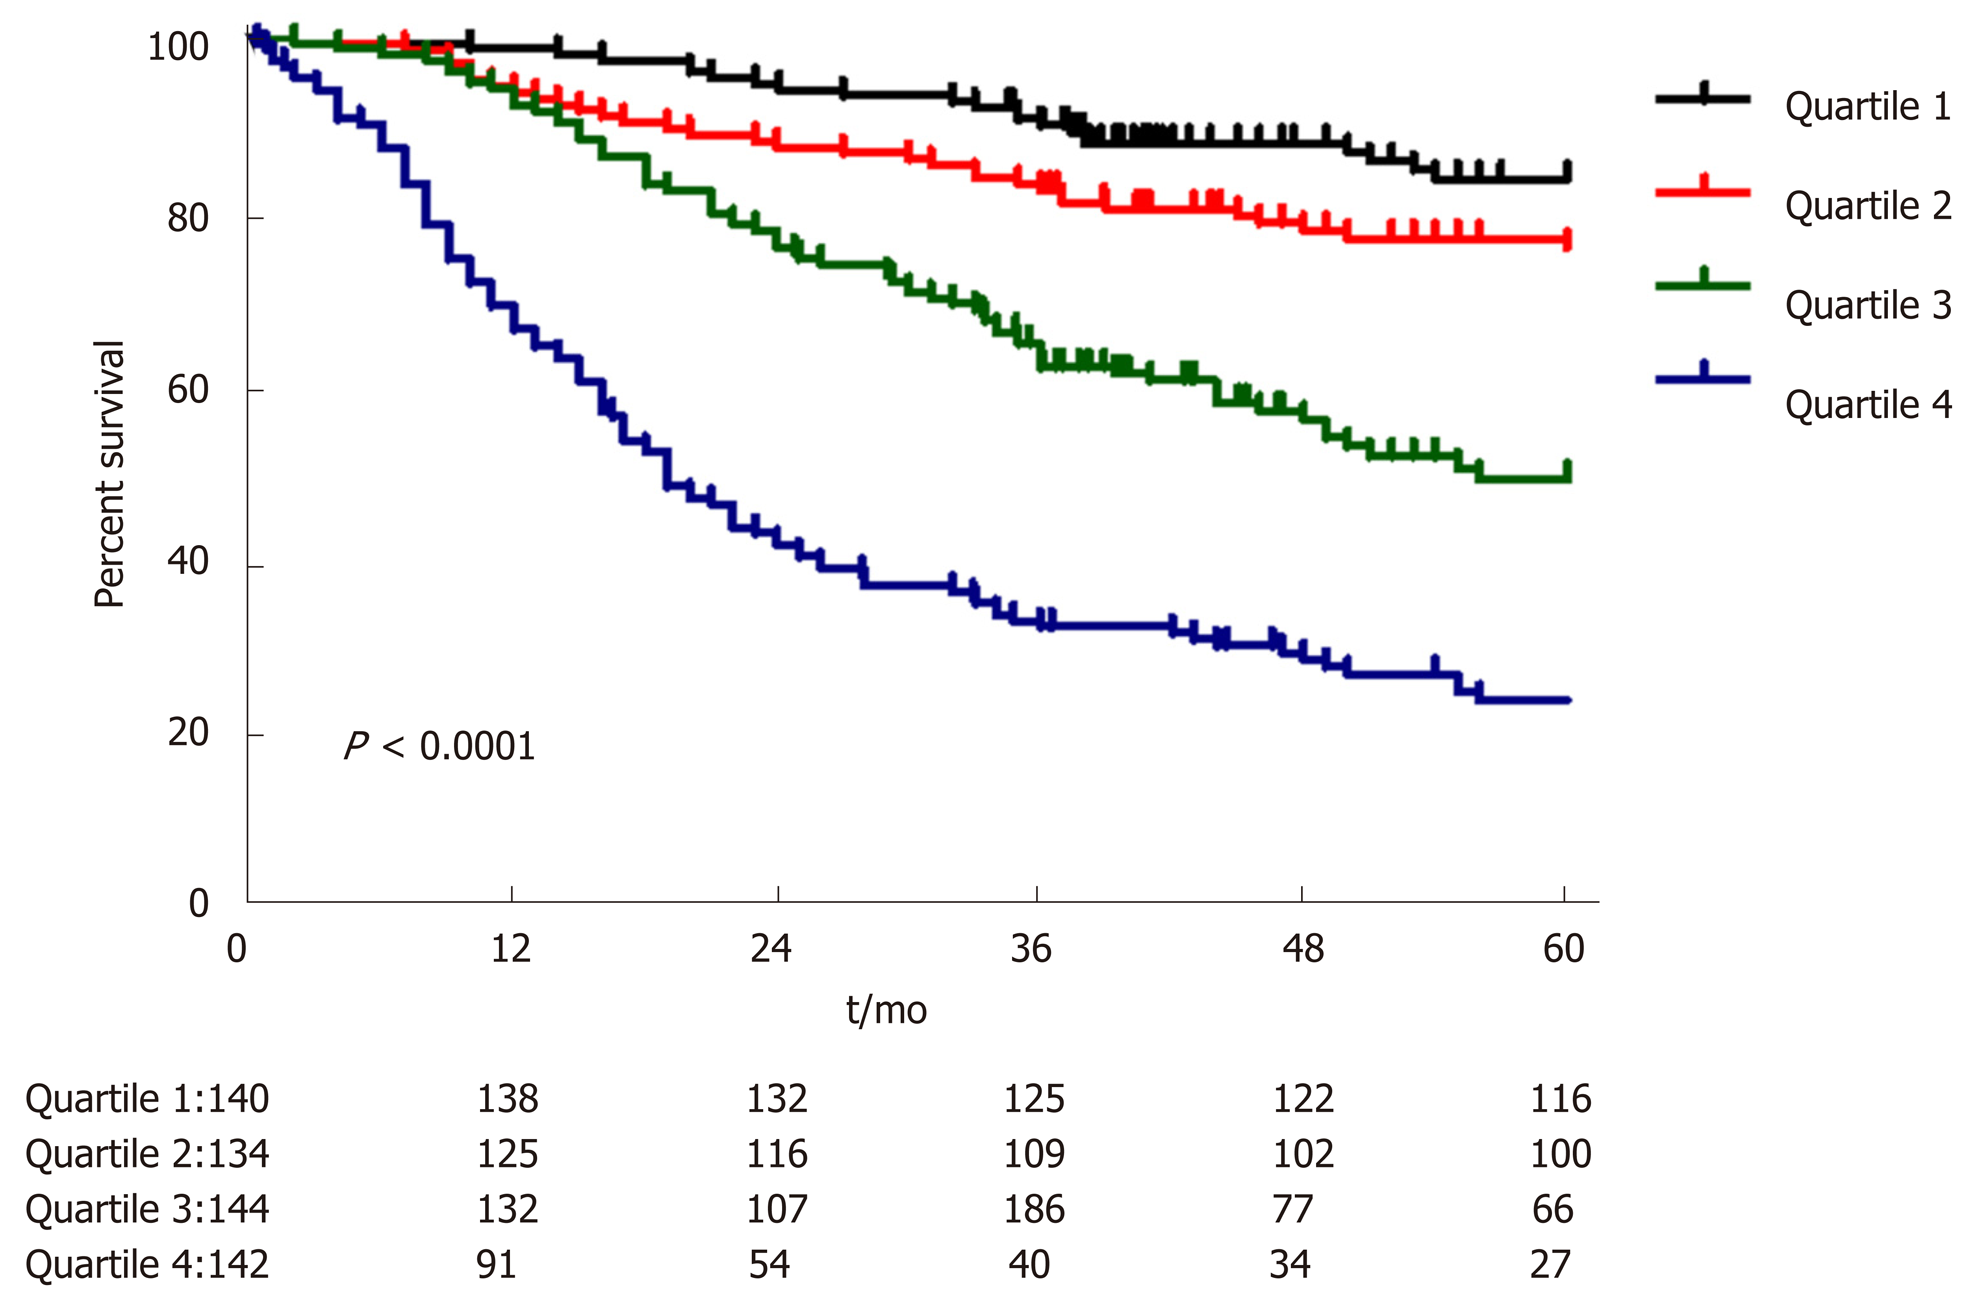
A nomogram prediction model was developed based on the postoperative independent risk factors that affected the OS in the postoperative proximal GC patients (Figure 6). The C-index of the forecasting model was 0.758 (95%CI: 0.739-0.777). The postoperative 3-year and 5-year OS rate calibration curves indicated that the discriminative ability of the nomogram prediction model was similar to that of actual observation (Figure 7). To further test the validity of the nomogram prediction model, we divided the patients into quartile 1, quartile 2, quartile 3, and quartile 4 to obtain four different prognosis levels according to the score obtained from the forecast model. The 5-year OS rates of the four subgroups were 82.6%, 74.3%, 45.9%, and 18.9% (P < 0.001) (Figure 8).
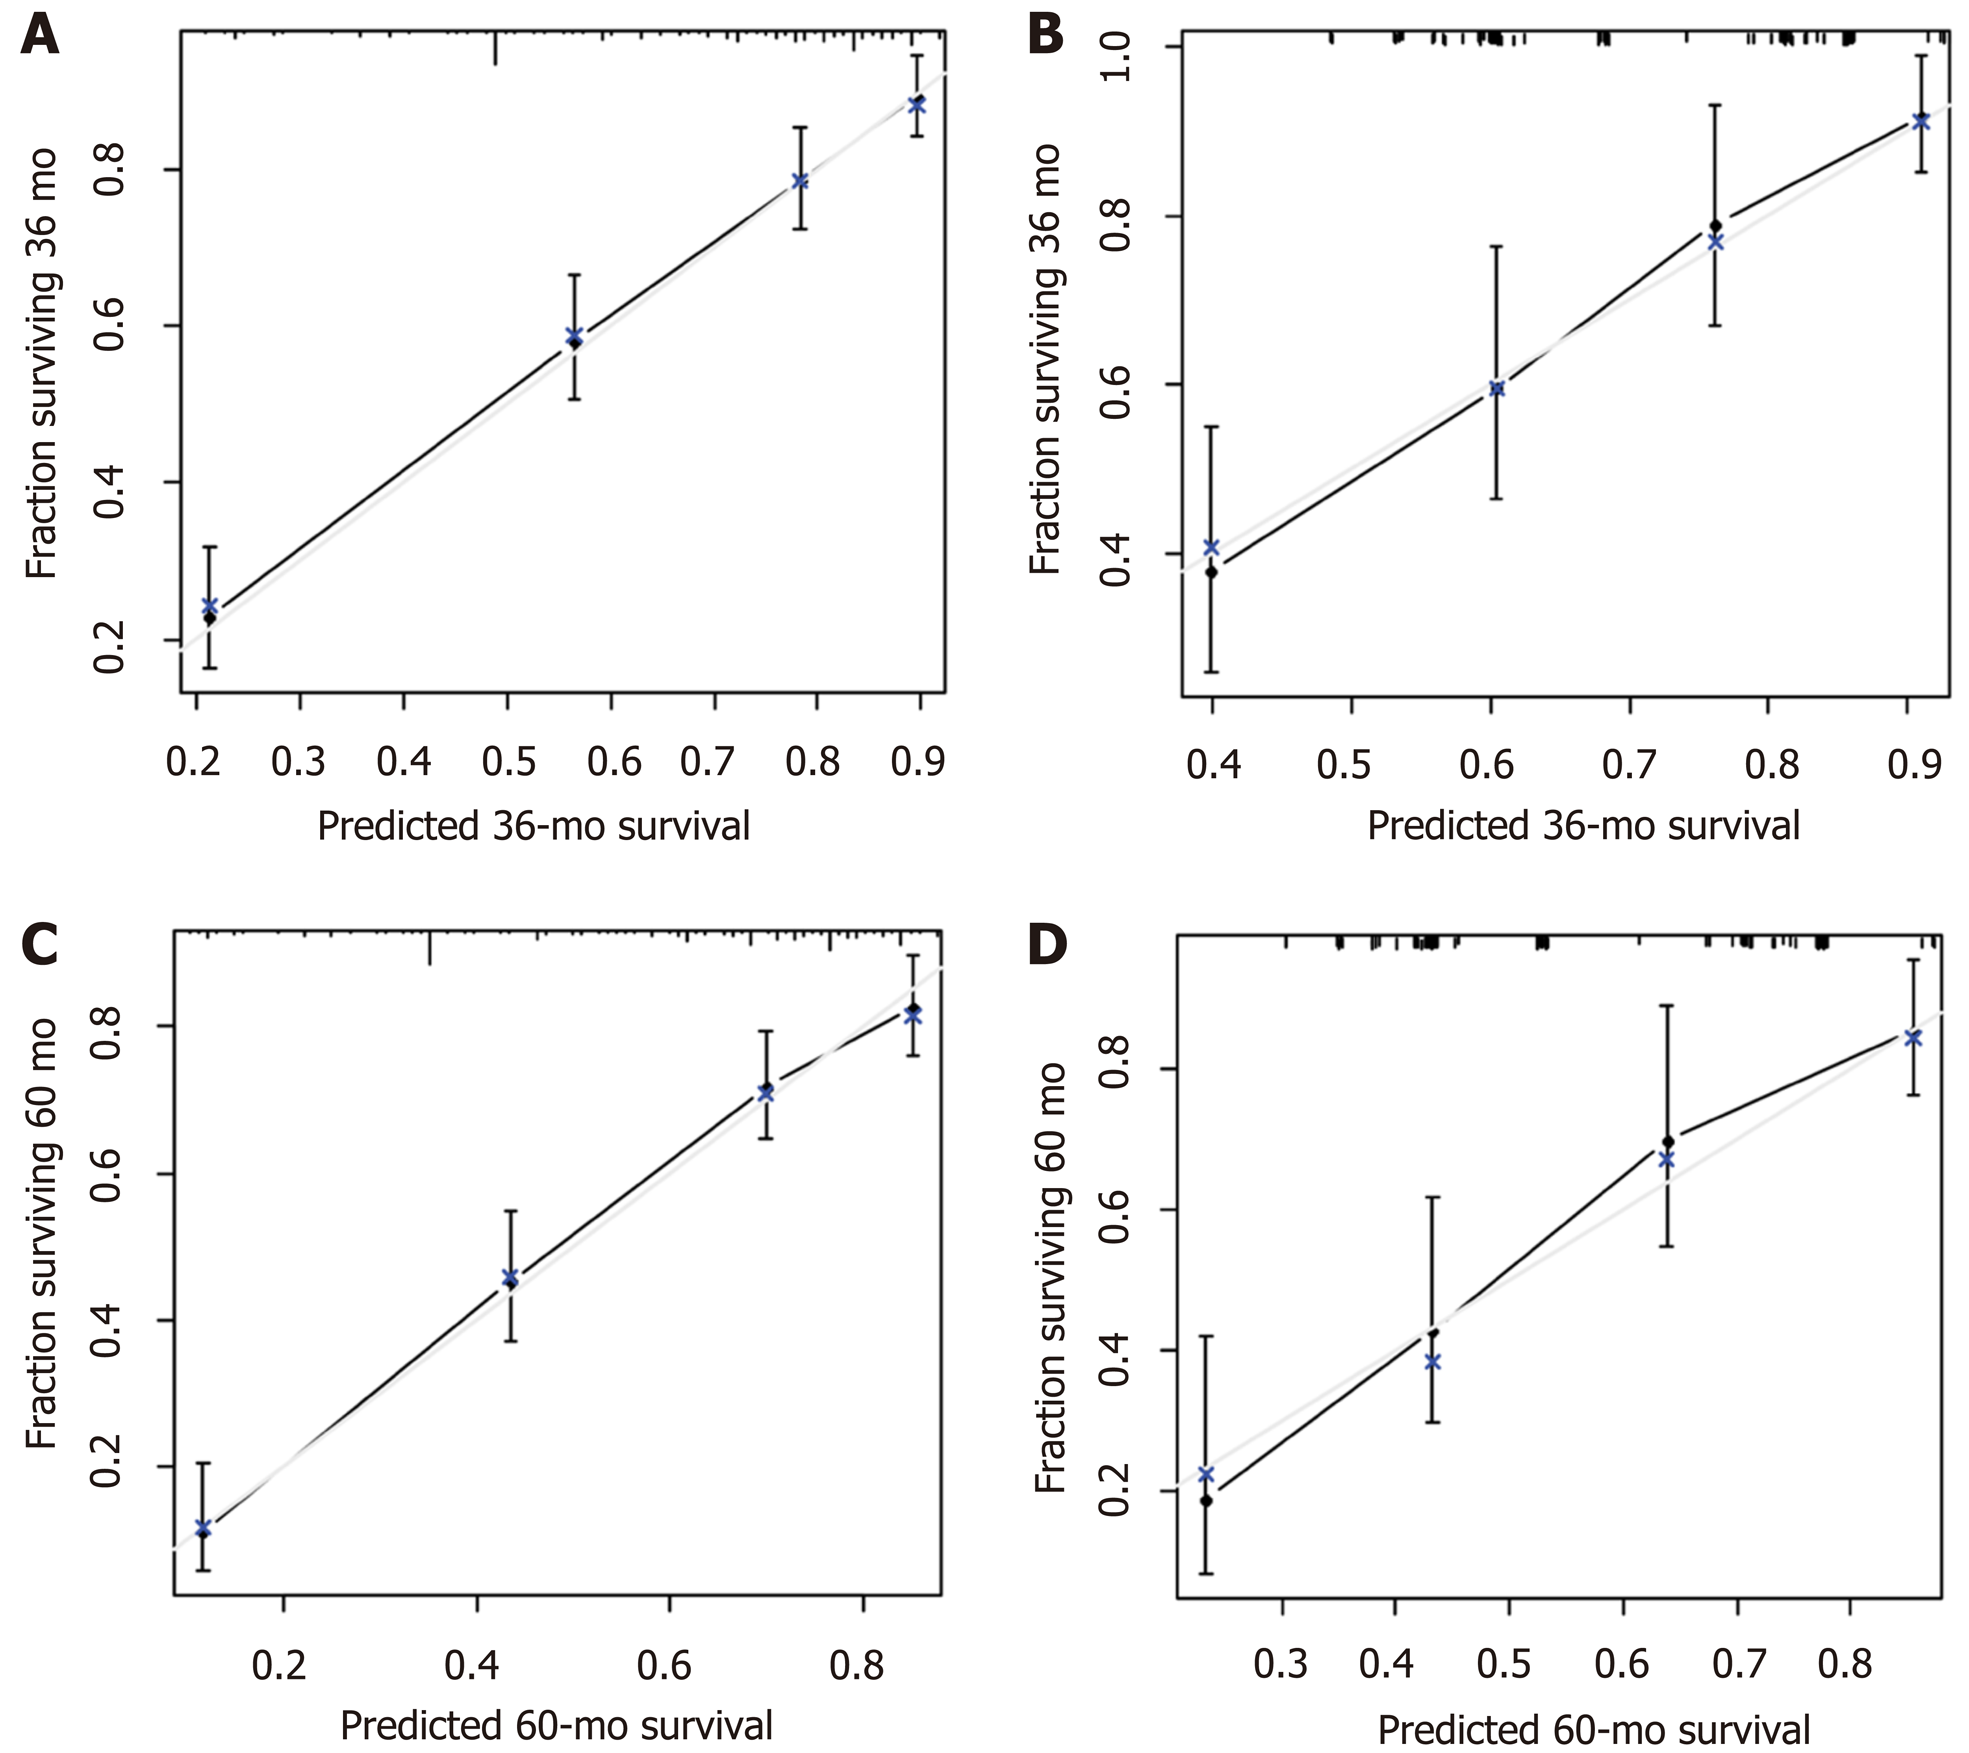
The 3-year and 5-year OS calibration curves for the preoperative and postoperative nomogram prediction models using the validation set indicated that the discriminative ability was similar to that of actual observation.
In the training set, the optimal cutoff point for the total score in either the preoperative or postoperative nomogram prediction model for the training and validation sets was 18. The sensitivity, specificity, positive predictive value, and negative predictive value for the OS of proximal GC patients predicted by the preoperative nomogram prediction model were 73.6%, 75.3%, 74.9%, and 74.1%, respectively, while these values in the postoperative nomogram prediction model were 70.6%, 76.4%, 81.8%, and 63.4%, respectively.
In the validation set, the optimal cutoff point for the total score in either the preoperative or postoperative nomogram prediction model for the training and validation sets was 18. The sensitivity, specificity, positive predictive value, and negative predictive value for the OS of proximal GC patients predicted by the preoperative nomogram prediction model were 76.8%, 74.4%, 75.5%, and 82.8%, respectively, while these values in the postoperative nomogram prediction model were 85.5%, 59.8%, 70.4%, and 78.7%, respectively (Table 4).
| Training set | Validation set | |||
| Preoperative nomogram | Postoperative nomogram | Preoperative nomogram | Postoperative nomogram | |
| Area under the curve | 0.811 | 0.799 | 0.821 | 0.774 |
| Cutoff point | 18 | 18 | 18 | 18 |
| Sensitivity, % | 0.736 | 0.706 | 0.768 | 0.855 |
| Specificity, % | 0.753 | 0.764 | 0.744 | 0.598 |
| Positive predictive value, % | 0.749 | 0.818 | 0.755 | 0.704 |
| Negative predictive value, % | 0.741 | 0.634 | 0.828 | 0.787 |
| Positive likelihood ratio | 2.98 | 2.99 | 3 | 2.127 |
| Negative likelihood ratio | 0.351 | 0.385 | 0.304 | 0.242 |
GC is among the most common malignant tumors of the digestive system, and the key to enhancing the postoperative survival rate of GC patients is to pursue individualized and effective treatment measures suitable for different patients with GC. Searching for indicators that can effectively predict a poor prognosis in patients with GC may facilitate the formulation of an individualized treatment plan and thereby improve the prognosis of patients[21]. However, most research analyzing the risk factors related to the prognosis of GC has been limited to related postoperative factors, lacking guiding significance for a preoperative prediction. This study first investigated the preoperative and postoperative factors associated with prognosis in postoperative proximal GC patients and then developed an optimal model to predict the prognosis of patients undergoing proximal GC surgery.
A postoperative nomogram prediction model can help patients regarding individualized treatment and follow-up; clinical research designs, postoperative follow-up, and the implementation of adjuvant therapy can be performed according to the guidance of different prognostic levels of the patients. There are a few reports of a prognosis nomogram prediction model for postoperative GC. Kattan et al[4] and Han et al[6] proposed a nomogram to predict the long-term survival of patients after R0 resection for GC based on the postoperative depth of tumor invasion, tumor size, tumor site, and other risk factors. A study conducted by Qian et al constructed a clinical prognostic scoring system for resectable GC patients using the TNM staging, the postoperative rate of lymph node metastasis, lymphovascular invasion, and other risk factors[22]. Considering the overall postoperative GC prognosis prediction model, we found that the related indicators of blood transfusions and postoperative complications during the postoperative recovery process are also important components of the postoperative prediction model for proximal GC. The statistical weights of blood transfusion and postoperative complications in the prediction model were 1.505 and 1.477, respectively. Studies have reported[23-26] that an allogeneic blood transfusion can alter normal immune cells and induce the differentiation of regulatory T cells, thereby inhibiting the activity of natural killer cells, leading to a decline in immune function; therefore, metastatic or residual tumor cells in the human body can escape the surveillance of the immune system. Some scholars have also hypothesized that blood transfusion-related immunosuppression can lead to the recurrence of tiny residual tumor lesions in early GC patients after radical gastrectomy[25,27,28]. Furthermore, data from 751 patients who underwent a radical resection of the stomach were retrospectively analyzed, and the results showed that postoperative complications have a significant impact on the 5-year OS; the patients were divided into grades 1, 2, 3, and 4 according to the grade of the severity of the overall complications, and the 5-year OS in each level was 43.0%, 42.5%, 25.5%, and 9.6%, respectively (P < 0.001)[29]. Therefore, we believe that the occurrence of overall complications is also an important factor in the postoperative GC prediction model. Our model includes not only the condition of the tumor in postoperative patients but also the recovery process, which is difficult to predict preoperatively. The C-index of the prediction model was 0.758, and the training set and internal validation of the OS calibration curve revealed that the discriminative ability of the nomogram prediction model was similar to actual observation. The prediction model was further divided into four different prognostic levels, and the patients among the subgroups exhibited remarkably different OS rates. Therefore, our postoperative model can more accurately predict OS in postoperative proximal GC patients.
In recent years, with progress in preoperative treatments, including new adjuvant chemotherapy, determining how to accurately judge the prognosis of patients preoperatively is critical. In addition, a preoperative prediction model can provide a simple and effective prediction tool to preoperatively distinguish between postoperative high and low mortality risk groups of patients with proximal GC. The targeted adoption of a relevant, more positive and effective operation has important significance for improving the prognosis of patients with proximal GC after operation. Furthermore, physicians could have a more comprehensive preoperative conversation with high-risk patients regarding the poor postoperative prognosis. Additionally, the preoperative prediction model can provide an important reference for choosing the appropriate preoperative cases for radical GC surgery. To date, no accurate and effective prognosis prediction model has been established based on the preoperative risk factors. The development of the preoperative nomogram model for predicting OS in proximal GC patients in our study included preoperative T stage, preoperative N stage, preoperative tumor size, preoperative CA19-9 level, ASA score, and 3- to 6-mo weight loss. According to a previous report[30], a more advanced preoperative T and N stage, a greater preoperative tumor diameter, and a higher CA19-9 level indicate a greater tumor load, and thus, the prognosis is worse. Additionally, by studying 455 patients who underwent radical resection for GC, Liu et al[31] found that weight loss is an independent prognostic factor for OS. A possible reason for this finding is that patients with a preoperative weight loss have nutritional dysfunction; under this condition, the function of the immune system is relatively low, and the level of tumor cell resistance and the amount of various cellular factors in the blood are inadequate. Langius et al[32] believes that patients with preoperative weight loss have a significantly lower content of iNKT cells in the blood, and iNKT cells have significant antitumor effects. Furthermore, weight loss may be affected by cancer cachexia syndrome, and patients with cachexia tend to exhibit a significant weight loss. Previous studies report that patients with cachexia syndrome often have a poor prognosis[33]. Lee et al[34]report that GC patients with a preoperative ASA grade of 3 points or above have a significantly increased incidence of postoperative complications and mortality. Thus, the ASA score is considered an important reference index that influences the prognosis of GC patients. Therefore, incorporating the above index into the development of the preoperative nomogram prediction model for OS in proximal GC postoperative patients enables a more accurate and reliable result. Our results show that the C-index of the preoperative nomogram prediction model (0.751) was similar to that of the postoperative nomogram prediction model, and a simple reference is provided for the prediction of the prognosis of patients preoperatively. The prediction model combined the preoperative risk factors for the prognosis of patients, and the patients could be divided into four different levels; the OS significantly differed among the subgroups. In addition, we conducted an internal validation, which further confirmed the effectiveness and clinical practical value of the postoperative and preoperative nomogram prediction models.
There are certain limitations in this study. First, the study was conducted at a single center, and the included patients originated from Eastern countries. Compared with Western countries, Eastern countries have a higher incidence of GC, there are more cases of advanced GC, and the BMI is lower. Therefore, the results require verification by performing a multi-center, prospective trial with a large sample that combines cases from Eastern and Western countries. Second, the data regarding preoperative systemic inflammatory markers, such as CRP, were incomplete. We aim to further analyze the prognostic factors affecting survival through multi-center data with preoperative inflammatory markers and establish a more powerful application of the new nomogram. However, this study is the first to provide both preoperative and postoperative prognostic models for patients with proximal GC. Clinical surgeons can use this model to accurately assess the prognostic risk in such patients before surgery, and the postoperative model could help patients in terms of individualized treatment and follow-up guidance.
Gastric cancer (GC) is the fourth most common malignant tumor worldwide and currently ranks second among the causes of cancer-related deaths. The biological behaviors of proximal GC and cancer in the lower portion of the stomach exhibit certain differences. Currently, although there has been great progress in the early diagnosis of and radical surgery and chemotherapy for proximal GC, the postoperative prognosis of patients with this type of cancer is still not ideal. Determining how to individualize treatment according to the characteristics of cancer patients and the features of the tumor is still a main problem in the treatment of proximal GC.
Searching for indicators that can effectively predict a poor prognosis in patients with GC may facilitate the formulation of an individualized treatment plan and thereby improve the prognosis of patients.
This study aimed to explore the postoperative prognosis of proximal GC patients and the related preoperative and postoperative factors and establish preoperative and postoperative nomogram prediction models based on the results.
Between January 2007 and June 2013, we prospectively collected and retrospectively analyzed the medical records of 746 patients with proximal GC, who were divided into a training set (n = 560, 75%) and a validation set (n = 186, 25%). A Cox regression analysis was used to identify the preoperative and postoperative risk factors for overall survival (OS).
Among the 746 patients examined, the 3- and 5-year OS rates were 66.1% and 58.4%, respectively. In the training set, preoperative T stage (cT), N stage (cN), CA19-9, tumor size, ASA core, and 3- to 6-mo weight loss were incorporated into the preoperative nomogram for the prediction of OS. In addition to these variables, LVI, postoperative tumor size, T stage, N stage, blood transfusions, and complications were incorporated into the postoperative nomogram. All calibration curves for the OS probability fit well. In the training set, the preoperative nomogram achieved a C-index of 0.751 [95% confidence interval (CI): 0.732-0.770] in predicting OS and accurately stratified the patients into four prognostic subgroups (5-year OS rates: 86.8%, 73.0%, 43.72%, and 20.9%, P < 0.001). The postoperative nomogram had a C-index of 0.758 in predicting OS and accurately stratified the patients into four prognostic subgroups (5-year OS rates: 82.6%, 74.3%, 45.9%, and 18.9%, P < 0.001).
The nomograms accurately predict the pre- and postoperative long-term survival of proximal GC patients.
This is a retrospective study only involving participants from Eastern countries. Compared with Western countries, the incidence of GC in Eastern countries is high, and there are more advanced GC patients. The biological characteristics of GC may differ between Eastern and Western countries. Therefore, we hope that the predictive model will be further validated and improved through a single-center RCT trial or even a multi-center prospective trial.
Manuscript source: Unsolicited manuscript
Specialty type: Medicine, research and experimental
Country of origin: China
Peer-review report classification
Grade A (Excellent): 0
Grade B (Very good): B, B
Grade C (Good): 0
Grade D (Fair): D
Grade E (Poor): 0
P-Reviewer: Agolli L, Deans C, Senchukova M S-Editor: Ma YJ L-Editor: Wang TQ E-Editor: Zhang YL
| 1. | Jemal A, Siegel R, Xu J, Ward E. Cancer statistics, 2010. CA Cancer J Clin. 2010;60:277-300. [RCA] [PubMed] [DOI] [Full Text] [Cited by in Crossref: 10002] [Cited by in RCA: 10464] [Article Influence: 654.0] [Reference Citation Analysis (2)] |
| 2. | Sasako M, Sano T, Yamamoto S, Kurokawa Y, Nashimoto A, Kurita A, Hiratsuka M, Tsujinaka T, Kinoshita T, Arai K, Yamamura Y, Okajima K; Japan Clinical Oncology Group. D2 lymphadenectomy alone or with para-aortic nodal dissection for gastric cancer. N Engl J Med. 2008;359:453-462. [RCA] [PubMed] [DOI] [Full Text] [Cited by in Crossref: 698] [Cited by in RCA: 764] [Article Influence: 42.4] [Reference Citation Analysis (0)] |
| 3. | WC SLG. International Union against Cancer(UICC) TNM Classification of Malignant Tumours. New York: Wiley-Liss. 2010.. |
| 4. | Kattan MW, Karpeh MS, Mazumdar M, Brennan MF. Postoperative nomogram for disease-specific survival after an R0 resection for gastric carcinoma. J Clin Oncol. 2003;21:3647-3650. [RCA] [PubMed] [DOI] [Full Text] [Cited by in Crossref: 313] [Cited by in RCA: 348] [Article Influence: 15.1] [Reference Citation Analysis (0)] |
| 5. | Kawai K, Ishihara S, Yamaguchi H, Sunami E, Kitayama J, Miyata H, Watanabe T. Nomogram prediction of metachronous colorectal neoplasms in patients with colorectal cancer. Ann Surg. 2015;261:926-932. [RCA] [PubMed] [DOI] [Full Text] [Cited by in Crossref: 35] [Cited by in RCA: 46] [Article Influence: 4.2] [Reference Citation Analysis (0)] |
| 6. | Han DS, Suh YS, Kong SH, Lee HJ, Choi Y, Aikou S, Sano T, Park BJ, Kim WH, Yang HK. Nomogram predicting long-term survival after d2 gastrectomy for gastric cancer. J Clin Oncol. 2012;30:3834-3840. [RCA] [PubMed] [DOI] [Full Text] [Cited by in Crossref: 220] [Cited by in RCA: 280] [Article Influence: 20.0] [Reference Citation Analysis (0)] |
| 7. | Wang Y, Li J, Xia Y, Gong R, Wang K, Yan Z, Wan X, Liu G, Wu D, Shi L, Lau W, Wu M, Shen F. Prognostic nomogram for intrahepatic cholangiocarcinoma after partial hepatectomy. J Clin Oncol. 2013;31:1188-1195. [RCA] [PubMed] [DOI] [Full Text] [Cited by in Crossref: 786] [Cited by in RCA: 847] [Article Influence: 65.2] [Reference Citation Analysis (0)] |
| 8. | Sternberg CN. Are nomograms better than currently available stage groupings for bladder cancer? J Clin Oncol. 2006;24:3819-3820. [RCA] [PubMed] [DOI] [Full Text] [Cited by in Crossref: 114] [Cited by in RCA: 151] [Article Influence: 7.6] [Reference Citation Analysis (0)] |
| 9. | Keats AS. The ASA classification of physical status--a recapitulation. Anesthesiology. 1978;49:233-236. [PubMed] |
| 10. | Wang HM, Huang CM, Zheng CH, Li P, Xie JW, Wang JB, Lin JX, Lu J. Tumor size as a prognostic factor in patients with advanced gastric cancer in the lower third of the stomach. World J Gastroenterol. 2012;18:5470-5475. [PubMed] |
| 11. | Japanese Gastric Cancer Association. Japanese gastric cancer treatment guidelines 2010 (ver. 3). Gastric Cancer. 2011;14:113-123. [RCA] [PubMed] [DOI] [Full Text] [Cited by in Crossref: 1723] [Cited by in RCA: 1910] [Article Influence: 127.3] [Reference Citation Analysis (0)] |
| 12. | Sobin LGM, Witterkind C. International Union against Cancer (UICC) tnm Classification of Malignant Tumors. Oxford: Wiley-Blackwell 2009; . |
| 13. | Edge SB, Compton CC. The American Joint Committee on Cancer: the 7th edition of the AJCC cancer staging manual and the future of TNM. Ann Surg Oncol. 2010;17:1471-1474. [RCA] [PubMed] [DOI] [Full Text] [Cited by in Crossref: 5537] [Cited by in RCA: 6599] [Article Influence: 412.4] [Reference Citation Analysis (0)] |
| 14. | Kim HJ, Kim AY, Oh ST, Kim JS, Kim KW, Kim PN, Lee MG, Ha HK. Gastric cancer staging at multi-detector row CT gastrography: comparison of transverse and volumetric CT scanning. Radiology. 2005;236:879-885. [RCA] [PubMed] [DOI] [Full Text] [Cited by in Crossref: 175] [Cited by in RCA: 191] [Article Influence: 9.1] [Reference Citation Analysis (0)] |
| 15. | Dorfman RE, Alpern MB, Gross BH, Sandler MA. Upper abdominal lymph nodes: criteria for normal size determined with CT. Radiology. 1991;180:319-322. [RCA] [PubMed] [DOI] [Full Text] [Cited by in Crossref: 253] [Cited by in RCA: 233] [Article Influence: 6.7] [Reference Citation Analysis (0)] |
| 16. | Yang DM, Kim HC, Jin W, Ryu CW, Kang JH, Park CH, Kim HS, Jung DH. 64 multidetector-row computed tomography for preoperative evaluation of gastric cancer: histological correlation. J Comput Assist Tomogr. 2007;31:98-103. [RCA] [PubMed] [DOI] [Full Text] [Cited by in Crossref: 66] [Cited by in RCA: 62] [Article Influence: 3.3] [Reference Citation Analysis (0)] |
| 17. | Camp RL, Dolled-Filhart M, Rimm DL. X-tile: a new bio-informatics tool for biomarker assessment and outcome-based cut-point optimization. Clin Cancer Res. 2004;10:7252-7259. [RCA] [PubMed] [DOI] [Full Text] [Cited by in Crossref: 1947] [Cited by in RCA: 3072] [Article Influence: 146.3] [Reference Citation Analysis (8)] |
| 18. | Iasonos A, Schrag D, Raj GV, Panageas KS. How to build and interpret a nomogram for cancer prognosis. J Clin Oncol. 2008;26:1364-1370. [RCA] [PubMed] [DOI] [Full Text] [Cited by in Crossref: 1306] [Cited by in RCA: 2418] [Article Influence: 134.3] [Reference Citation Analysis (0)] |
| 19. | Ohori Tatsuo Gondo And Riu Hamada M, Gondo T, Hamada R. [Nomogram as predictive model in clinical practice]. Gan To Kagaku Ryoho. 2009;36:901-906. [PubMed] |
| 20. | Gervaz P, Bandiera-Clerc C, Buchs NC, Eisenring MC, Troillet N, Perneger T, Harbarth S. Scoring system to predict the risk of surgical-site infection after colorectal resection. Br J Surg. 2012;99:589-595. [RCA] [PubMed] [DOI] [Full Text] [Cited by in Crossref: 62] [Cited by in RCA: 63] [Article Influence: 4.5] [Reference Citation Analysis (0)] |
| 21. | Becker K, Reim D, Novotny A, Zum Büschenfelde CM, Engel J, Friess H, Höfler H, Langer R. Proposal for a multifactorial prognostic score that accurately classifies 3 groups of gastric carcinoma patients with different outcomes after neoadjuvant chemotherapy and surgery. Ann Surg. 2012;256:1002-1007. [RCA] [PubMed] [DOI] [Full Text] [Cited by in Crossref: 36] [Cited by in RCA: 50] [Article Influence: 3.8] [Reference Citation Analysis (0)] |
| 22. | Qian J, Qian Y, Wang J, Gu B, Pei D, He S, Zhu F, Røe OD, Xu J, Liu L, Gu Y, Guo R, Yin Y, Shu Y, Chen X. A clinical prognostic scoring system for resectable gastric cancer to predict survival and benefit from paclitaxel- or oxaliplatin-based adjuvant chemotherapy. Drug Des Devel Ther. 2016;10:241-258. [RCA] [PubMed] [DOI] [Full Text] [Full Text (PDF)] [Cited by in Crossref: 3] [Cited by in RCA: 7] [Article Influence: 0.7] [Reference Citation Analysis (0)] |
| 23. | Baumgartner JM, Silliman CC, Moore EE, Banerjee A, McCarter MD. Stored red blood cell transfusion induces regulatory T cells. J Am Coll Surg. 2009;208:110-119. [RCA] [PubMed] [DOI] [Full Text] [Cited by in Crossref: 67] [Cited by in RCA: 72] [Article Influence: 4.0] [Reference Citation Analysis (0)] |
| 24. | Chen G, Zhang FJ, Gong M, Yan M. Effect of perioperative autologous versus allogeneic blood transfusion on the immune system in gastric cancer patients. J Zhejiang Univ Sci B. 2007;8:560-565. [RCA] [PubMed] [DOI] [Full Text] [Cited by in Crossref: 52] [Cited by in RCA: 47] [Article Influence: 2.5] [Reference Citation Analysis (0)] |
| 25. | Heiss MM, Fraunberger P, Delanoff C, Stets R, Allgayer H, Ströhlein MA, Tarabichi A, Faist E, Jauch KW, Schildberg FW. Modulation of immune response by blood transfusion: evidence for a differential effect of allogeneic and autologous blood in colorectal cancer surgery. Shock. 1997;8:402-408. [PubMed] |
| 26. | Sun CF, Hsieh YY, Ngan KW, Wang WT. Search for immunomodulatory effects of blood transfusion in gastric cancer patients: flow cytometry of Th1/Th2 cells in peripheral blood. Ann Clin Lab Sci. 2001;31:171-178. [PubMed] |
| 27. | Heiss MM, Simon EH, Beyer BC, Gruetzner KU, Tarabichi A, Babic R, Schildberg FW, Allgayer H. Minimal residual disease in gastric cancer: evidence of an independent prognostic relevance of urokinase receptor expression by disseminated tumor cells in the bone marrow. J Clin Oncol. 2002;20:2005-2016. [RCA] [PubMed] [DOI] [Full Text] [Cited by in Crossref: 59] [Cited by in RCA: 56] [Article Influence: 2.3] [Reference Citation Analysis (0)] |
| 28. | Jauch KW, Heiss MM, Gruetzner U, Funke I, Pantel K, Babic R, Eissner HJ, Riethmueller G, Schildberg FW. Prognostic significance of bone marrow micrometastases in patients with gastric cancer. J Clin Oncol. 1996;14:1810-1817. [RCA] [PubMed] [DOI] [Full Text] [Cited by in Crossref: 125] [Cited by in RCA: 111] [Article Influence: 3.7] [Reference Citation Analysis (0)] |
| 29. | Jiang N, Deng JY, Ding XW, Zhang L, Liu HG, Liang YX, Liang H. Effect of complication grade on survival following curative gastrectomy for carcinoma. World J Gastroenterol. 2014;20:8244-8252. [RCA] [PubMed] [DOI] [Full Text] [Full Text (PDF)] [Cited by in CrossRef: 47] [Cited by in RCA: 43] [Article Influence: 3.6] [Reference Citation Analysis (0)] |
| 30. | Borda A, Borda F, Vila J, Fernández-Urién I, Zozaya JM, Guerra A. [Predictive pre-treatment value of the Prognostic Nutritional Index on survival in gastric carcinoma]. An Sist Sanit Navar. 2016;39:227-235. [RCA] [PubMed] [DOI] [Full Text] [Cited by in Crossref: 1] [Cited by in RCA: 2] [Article Influence: 0.3] [Reference Citation Analysis (0)] |
| 31. | Liu X, Sun X, Liu J, Kong P, Chen S, Zhan Y, Xu D. Preoperative C-Reactive Protein/Albumin Ratio Predicts Prognosis of Patients after Curative Resection for Gastric Cancer. Transl Oncol. 2015;8:339-345. [RCA] [PubMed] [DOI] [Full Text] [Full Text (PDF)] [Cited by in Crossref: 116] [Cited by in RCA: 168] [Article Influence: 15.3] [Reference Citation Analysis (0)] |
| 32. | Langius JA, Bakker S, Rietveld DH, Kruizenga HM, Langendijk JA, Weijs PJ, Leemans CR. Critical weight loss is a major prognostic indicator for disease-specific survival in patients with head and neck cancer receiving radiotherapy. Br J Cancer. 2013;109:1093-1099. [RCA] [PubMed] [DOI] [Full Text] [Full Text (PDF)] [Cited by in Crossref: 160] [Cited by in RCA: 230] [Article Influence: 17.7] [Reference Citation Analysis (0)] |
| 33. | Ockenga J, Valentini L. Review article: anorexia and cachexia in gastrointestinal cancer. Aliment Pharmacol Ther. 2005;22:583-594. [RCA] [PubMed] [DOI] [Full Text] [Cited by in Crossref: 48] [Cited by in RCA: 47] [Article Influence: 2.2] [Reference Citation Analysis (0)] |
| 34. | Lee KG, Lee HJ, Yang JY, Oh SY, Bard S, Suh YS, Kong SH, Yang HK. Risk factors associated with complication following gastrectomy for gastric cancer: retrospective analysis of prospectively collected data based on the Clavien-Dindo system. J Gastrointest Surg. 2014;18:1269-1277. [RCA] [PubMed] [DOI] [Full Text] [Cited by in Crossref: 86] [Cited by in RCA: 112] [Article Influence: 9.3] [Reference Citation Analysis (0)] |


