Published online Jan 16, 2017. doi: 10.12998/wjcc.v5.i1.1
Peer-review started: June 27, 2016
First decision: August 11, 2016
Revised: August 27, 2016
Accepted: October 25, 2016
Article in press: October 27, 2016
Published online: January 16, 2017
Processing time: 201 Days and 24 Hours
To investigated the association between the tumor cells’ expression of E-cadherin and the numbers of several types of inflammatory cells infiltrating into the invasive portion of gallbladder cancer (GBC).
We analyzed 50 GBC cases for which a sufficient amount of tumor tissues for tissue microarray (TMA) had been saved. Three tissue cores (3.0 mm) of invasive lesion from each case were used for the TMA. The 4-μm cut sections on slides were immunostained using primary antibodies including E-cadherin for cancer cells, leukocyte common antigen for leukocyte, myeloperoxidase for neutrophils, CD3 for T cells, CD4 for helper T cells, CD8 for killer T cells, CD20 for B cells and CD68 for macrophages. The immunostained slides were digitally analyzed by imaging analysis software.
A significant inverse correlation between the number of infiltrating CD8+ cells at invasive areas and the expression of E-cadherin by cancer cells was observed (P = 0.0001), although the degree of this correlation was relatively weak (R = 0.32). The number of CD8+ cells and the cancer cells’ E-cadherin expression were also significantly correlated with tumor differentiation (well-differentiated vs poorly differentiated) (P = 0.0467 and P = 0.0294, respectively). Inverse correlation of T-stage and the number of CD8+ cell infiltration was observed with statistical significance in comparison of T2 and T3 cases (P = 0.0324).
Our findings indicate an inverse correlation of CD8+ T cell infiltration and cancer cells’ E-cadherin expression at invasive areas of GBC. Further analyses are essential to test these findings.
Core tip: We analyzed the association between the expression of E-cadherin in tumor cells and the type and amount of inflammatory cells infiltrating into the invasive portion of gallbladder cancer, using tissue microarray and imaging analyses. The results indicated an inverse correlation of CD8+ T cell infiltration and E-cadherin expression by cancer cells at invasive areas of gallbladder cancer. Further analyses are essential to test these results.
- Citation: Kai K, Masuda M, Aishima S. Inverse correlation between CD8+ inflammatory cells and E-cadherin expression in gallbladder cancer: Tissue microarray and imaging analysis. World J Clin Cases 2017; 5(1): 1-8
- URL: https://www.wjgnet.com/2307-8960/full/v5/i1/1.htm
- DOI: https://dx.doi.org/10.12998/wjcc.v5.i1.1
Gallbladder cancer (GBC) often shows the dedifferentiation or clustering of tumor cells (tumor budding) at the areas of infiltration, and a high degree of inflammatory response usually accompanies these findings[1]. Dedifferentiation is often associated with increased aggressiveness of a tumor. Although genetic heterogeneity, genome instability and epithelial-mesenchymal transition are considered mechanisms of dedifferentiation, the mechanism of dedifferentiation has not been established[2,3]. The concept of tumor budding was first established in colorectal cancer and was considered to be associated with the initial phase of tumor invasion and then with metastatic activity and prognostic outcome in various types of solid tumors[1,4,5], but the mechanism underlying tumor budding has not been clearly demonstrated.
Cell-cell adhesion participates in histogenesis and the maintenance of cell polarity and tissue structure. It has long been known that the mutual adhesiveness of cancer cells is significantly weaker than that of the corresponding normal cells[6,7]. Reduced cell-cell adhesiveness allows cancer cells to destruct of the histological structure of tumor tissue, resulting in the dedifferentiation of the tumor. E-cadherin is a well-known cell adhesion molecule composed of a series of components, each comprised of approximately 110 amino acid residues. E-cadherin forms a complex with three cytoplasmic proteins (alpha-, beta- and gamma-catenins), and the E-cadherin-catenin complex plays a key role in cellular adhesion; the loss of this function has been associated with tumor dedifferentiation and metastasis[8].
The microenvironment of cancer changes dramatically in relation to invasion into the stroma due to the changes of blood flow, metabolism and the direct interaction of inflammatory cells. We speculated that the type or amount of inflammatory cells that infiltrate into invasive areas may play some roles in the loss of E-cadherin function, and that tumor-infiltrating inflammatory cells thus contribute to the dedifferentiation of GBC. The purpose of this study was to determine the association between the expression of E-cadherin in tumor cells and the type and amount of inflammatory cells infiltrating into the invasive portion of GBC.
We selected a total of 50 GBC cases for which a sufficient amount of formalinfixed, paraffinembedded tumor tissues for tissue microarray (TMA) had been saved from resection of the primary lesion at Saga University Hospital between 1994 and December 2010. Three tissue cores (3.0 mm) of the invasive lesion from each case were used for the TMA. Written informed consent for the use of resected tissue and clinical information was obtained from all patients, and the study protocol was approved by the Ethics Committee of the Faculty of Medicine at Saga University (approval No. 27-19). Clinical and histopathological staging were based on the TNM Classification of Malignant Tumors by the International Union against Cancer (7th edition)[9].
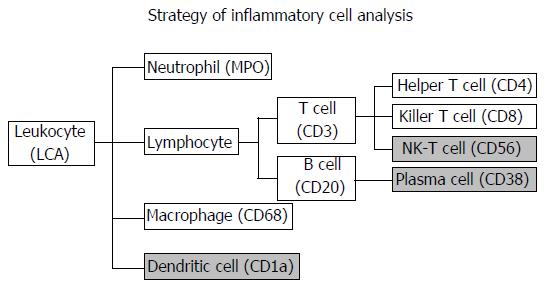
The inflammatory cell analysis strategy is summarized in Figure 1. The labels that were initially considered for inflammatory cells were as follows: Leukocyte common antigen (LCA) for leukocytes, myeloperoxidase (MPO) for neutrophils, CD3 for T cells, CD4 for helper T cells, CD8 for killer T cells, CD56 for natural killer T cells, CD20 for B cells, CD38 for plasma cells, CD68 for macrophages and CD1a for dendritic cells. Among them, CD56, CD38 and CD1a were excluded from the analysis because the imaging analysis software could not accurately detect inflammatory cells due to positive staining of the tumor cells. The primary antibodies used are summarized in Table 1. The 4-μm cut sections on slides were heated in EDTA (pH 9.0) by a microwave for antigen retrieval. The Envision+® System (Dako Cytomation, Glostrup, Denmark) was used as the secondary antibody. The slides were visualized by diaminobenzidine tetrahydrochloride, and nuclei were counterstained with hematoxylin. An Autostainer plus® automatic stainer (Dako Cytomation) was used for staining.
| Antibody | Dilution | Clone | Manufacturer |
| LCA | Prediluted | PD7/26, 2B11 | Nichirei Biosciences, Tokyo |
| MPO | 1:200 | Polyclonal | DakoCytomation, Glostrup, Denmark |
| CD3 | Prediluted | PS1 | Nichirei Biosciences |
| CD4 | Prediluted | 4B12 | Nichirei Biosciences |
| CD8 | 1:50 | C8/144B | DakoCytomation |
| CD20 | 1:50 | L26 | DakoCytomation |
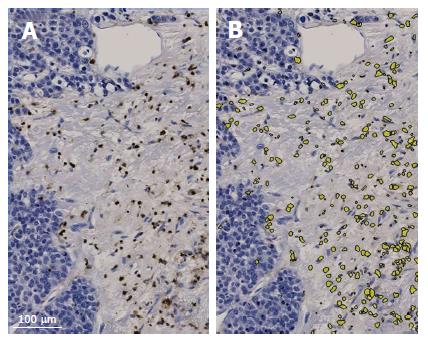
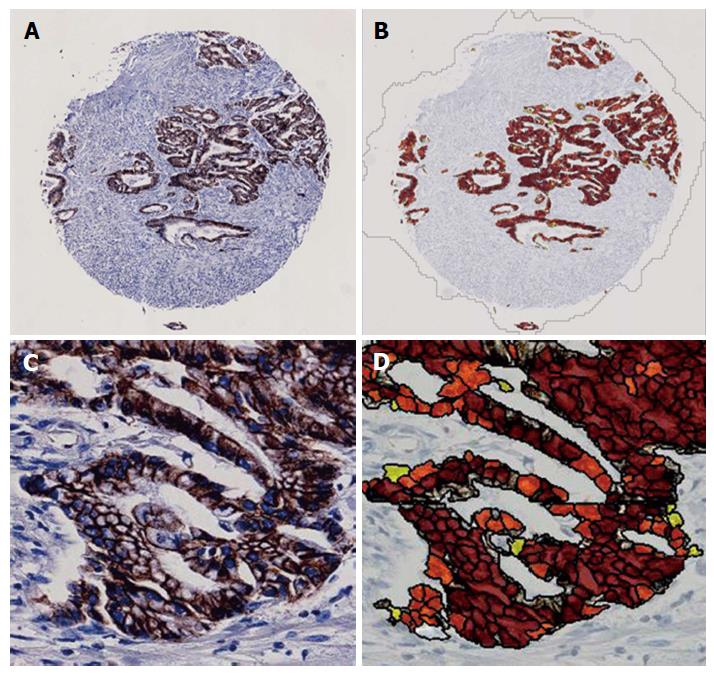
Immunostained tissue microarray slides were digitally scanned by the NanoZoomer 2.0-HT digital slide scanner (Hamamatsu Photonics, Hamamatsu, Japan) with 20× magnification for the imaging analysis. The numbers of positively stained inflammatory cells were automatically counted by the imaging analysis software, Tissue Studio (Definiens, München, Germany) (Figure 2). The membranous expression of E-cadherin was assessed by the histological score that was automatically calculated by Tissue Studio (Figure 3). Tissue Studio digitally evaluated the membranous expression of E-cadherin and categorized the expression into three grades (high, medium and low), and the histological score was calculated by the following formula: 1 × %Low + 2 × %Medium + 3 × %High.
We used JMP ver. 12 software (SAS Institute, Cary, NC, United States) for all statistical analyses. The comparisons of two groups were performed using a simple linear regression analysis, and each pair was analyzed using Student’s t-test as appropriate. Probability values < 0.05 were considered significant.
The numbers of inflammatory cells per TMA core are summarized in Table 2. Many acute inflammatory cells such as MPO+ neutrophils and CD68+ macrophages (average numbers/core were 2692.39 and 2452.99, respectively) were infiltrated into invasive sites of the GBCs. Regarding the composition of infiltrating lymphocytes, CD8+ killer T cells showed the largest number, followed by CD4+ helper T cells; CD20+ B cells were the least in number (avg. nos./core were 919.44, 583.01 and 467.95). All of the types of inflammatory cells showed a large standard deviation, indicating that the number and composition of inflammatory cells were quite different in each case.
| Maximun positive cell counts/core | Minimun positive cell counts/core | Average/core | Standard deviation/core | No. of analyzable cores | |
| LCA | 13962 | 73 | 3108.27 | 2734.79 | 136 |
| MPO | 10911 | 388 | 2692.39 | 1830.47 | 131 |
| CD3 | 14702 | 74 | 1967.06 | 2058.45 | 130 |
| CD4 | 6583 | 0 | 583.01 | 934.52 | 134 |
| CD8 | 5572 | 10 | 919.44 | 1034.35 | 131 |
| CD20 | 7097 | 4 | 467.95 | 834.74 | 133 |
| CD68 | 11355 | 97 | 2452.99 | 2043.92 | 135 |
The results of our single linear regression analysis between E-cadherin expression and the type of inflammatory cells are summarized in Table 3. The immunohistochemical markers of inflammatory cells that were shown to be significantly correlated with the expression of E-cadherin were LCA (P = 0.0482), CD3 (P = 0.011) and CD8 (P = 0.0001). The linear regression models of these factors are demonstrated in Figure 4. An inverse correlation between the number of CD8+ cells and the expression of E-cadherin was observed, but the degree of this correlation was relatively weak (R = 0.32).
| Cells | Regression equation | Adjusted R2 | R | Standard error | P-value |
| LCA | EHS = 117.67879 − 0.0029223 × LCA | 0.0216 | 0.15 | 46.5793 | 0.0482 |
| CD20 | EHS = 112.37344 − 0.0083497 × CD20 | 0.0153 | 0.12 | 45.8466 | 0.083 |
| CD3 | EHS = 119.86794 − 0.0050479 × CD3 | 0.0421 | 0.21 | 45.7107 | 0.011 |
| CD4 | EHS = 109.63264 − 0.0003939 × CD4 | < 0.0001 | n/a | 47.1913 | 0.9285 |
| CD8 | EHS = 121.37735 − 0.0146326 × CD8 | 0.1011 | 0.32 | 43.6707 | 0.0001 |
| MPO | EHS = 104.23773 + 0.0012811 × MPO | −0.00523 | n/a | 46.9647 | 0.5701 |
| CD68 | EHS = 113.83072 − 0.0023317 × CD68 | 0.0029 | 0.05 | 46.8666 | 0.2412 |
The clinicopathological data, number of CD8+ cells (means of analyzable cores in each case) and E-cadherin histological score (means of analyzable cores in each cases) of the 50 GBC cases are presented in Table 4. The numbers of cases in which the pathologically assessed differentiation of invasive front was observed were as follows. G1 (well-differentiated), 16 cases (32.0%); G2 (moderately differentiated), 19 cases (38.0%); G3 (poorly differentiated), 15 cases (30.0%). The median ± SD of CD8+ cells was 580.0 ± 1154.5, and the E-cadherin histological score was 114.3 ± 37.8.
| Age | Mean ± SD | 68.7 ± 8.4 |
| Gender | Male | 15 (30.0) |
| Female | 35 (70.0) | |
| Differentiation of invasive front | G1 | 16 (32.0) |
| G2 | 19 (38.0) | |
| G3 | 15 (30.0) | |
| T-stage | T2 | 18 (36.0) |
| T3 | 28 (56.0) | |
| T4 | 4 (8.0) | |
| N | N0 | 17 (34.0) |
| N1 | 33 (66.0) | |
| No. of CD8-positive cells (means of analyzable cores in each case) | Median ± SD | 580.0 ± 1154.5 |
| E-cadherin histological score | Median ± SD | 114.3 ± 37.8 |
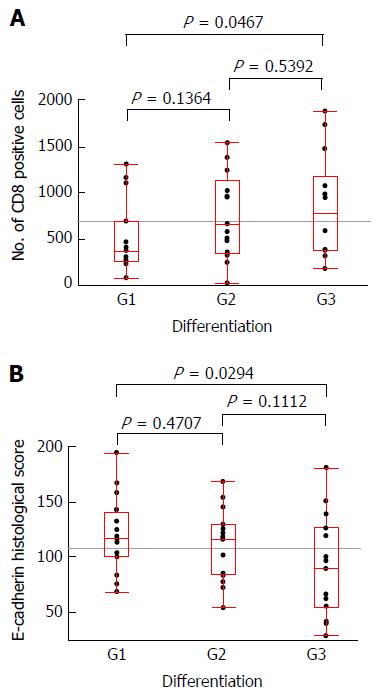
Figure 5 illustrates the correlations of pathologically assessed differentiation with the number of infiltrating CD8+ cells in each case or with the E-cadherin histological score in each case, with each pair analyzed by Student’s t-test. A significant difference was observed in the comparison of G1 and G3 cases according to the number of CD8+ cells (P = 0.0467) and according to the E-cadherin histological score (P = 0.0294).
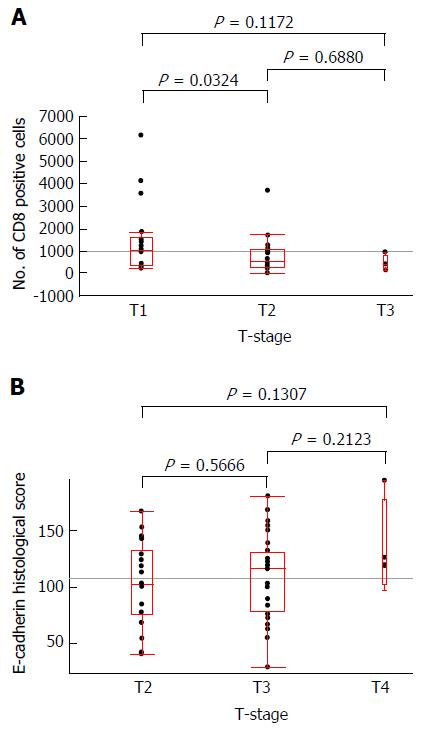
No distant metastasis (M1) case was involved in this study. The mean ± SD of number of infiltrating CD8+ cells with T2, T3 and T4 tumors were 1489.05 ± 1607.22, 747.33 ± 719.87 and 506.92 ± 336.37, respectively. The mean ± SD of E-cadherin histological score with T2, T3 and T4 tumors were 101.69 ± 37.90, 108.27 ± 37.04 and 133.75 ± 42.30, respectively. Figure 6 illustrates the correlations of T-stage with the E-cadherin histological score in each case or with the number of infiltrating CD8+ cells in each case. A significant difference was observed in the comparison of T2 and T3 cases according to the number of CD8+ cells (P = 0.0324).
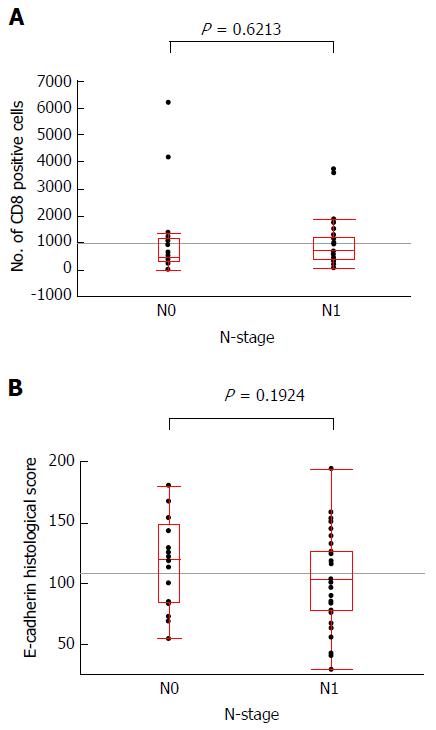
The mean ± SD of number of infiltrating CD8+ cells of N0 and N1 cases was 1109.10 ± 1618.16 and 936.39 ± 849.25, respectively. The mean ± SD of E-cadherin histological score of N0 and N1 cases was 117.73 ± 9.11 and 102.90 ± 6.54, respectively. Figure 7 illustrates the N-stage with the E-cadherin histological score in each case or with the number of infiltrating CD8+ cells in each case. No significant difference was observed in each comparison.
This study analyzed the association between the expression of E-cadherin at tumor cells and inflammatory cells infiltrating into the invasive area of GBC, using the TMA technique and imaging analysis software. Our observation that relatively large numbers of acute inflammatory cells such as neutrophils and macrophages had infiltrated into invasive areas seems reasonable, since the gallbladder frequently develops acute inflammation manifested as acute cholecystitis. Although neutrophils have the potential for cell damage/destruction by the degranulation of their arsenal of cytotoxic chemicals and enzymes[10], we observed no association between neutrophil infiltration and the E-cadherin expression of the tumor cells in this study.
Among the analyzed inflammatory cells, significant associations with E-cadherin expression by tumor cells were observed in the infiltration of leukocytes (LCA), T cells (CD3) and CD8+ T cells. In light of the degree of statistical correlation and theoretical considerations, we interpret our present findings as showing that CD8+ T cells are involved in the loss or attenuation of E-cadherin expression in GBC.
Generally, CD8+ T cells have been considered manifestations of host immune reactions against cancer cells, and favorable prognostic impacts of CD8+ T cells have been found in a wide variety of solid cancer tissues[11-18]. Regarding GBC, the prognostic impact of CD8+ T cell has been less investigated, and it remains controversial[19,20]. Herein we investigated the correlation between the invasion of CD8+ T cells or E-cadherin expression of tumor cells and the prognosis of GBC cases (disease free survival, overall survival and disease specific survival), and no significant relationship was found (data not shown).
It is interesting finding that the number of infiltrating CD8+ cells were significantly fewer in T3 cases than that of T2 cases. Although it is not statistically significant, the number of infiltrating CD8+ cells were fewer in T4 cases than that of T3 cases. Similar results, namely inverse correlation of T-stage and the density of CD8+ cell infiltration has been reported in colorectal cancer[21]. It is hypothesized that progressive decrease of CD8+ cell densities along with tumor invasion could indicate a progressive immune escape and the magnitude of the immune reaction at the early stage of the disease could be a major determinant for controlling the evolution of colorectal cancer[21].
Same as other sites of cancer, a reduced expression of E-cadherin by cancer cells compared to non-tumorous epithelium has been reported in GBC[22]. The major finding of the present study is the inverse correlation of CD8+ T-cell infiltration and E-cadherin expression by cancer cells. This result might be interpreted in the following two ways. The first interpretation is that the expression of E-cadherin by tumor cells is initially reduced by unknown causes, and then the tumor invaded stroma and CD8+ T-cell infiltration is an immune response to the invading tumor. If this is so, it gives rise to the hypothesis that the more reduced the E-cadherin expression of the tumor is, the greater the amount of CD8+ T cells attracted will be.
A second interpretation of the results of the present study is that infiltrating CD8+ T cells affects the reduced expression of E-cadherin. The mechanisms of the inactivation of the E-cadherin are: (1) a consequence of genetic alterations of E-cadherin; (2) genetic alterations of beta-catenin; and (3) a loss of the interaction of beta-catenin and E-cadherin due to the tyrosine phosphorylation of beta-catenin[8]. If CD8+ T cells reduce E-cadherin expression, the focus of investigation should be to determine whether CD8+ T cells affect any or all of the above-described mechanisms for the inactivation of E-cadherin.
Either way, our results do not adequately establish the relationship between CD8+ T cell and E-cadherin expression. It also remains in doubt whether the results of a TMA analysis truly reflect the status of the entire tumor. In addition, the microenvironment of a tumor is not composed of only inflammatory cells but also extracellular matrix and surrounding blood vessels; a degree of hypoxia and tumor-associated fibroblasts also contribute to the tumor microenvironment and interact with each other in a complex manner. We found no study in the English literature that provides evidence that the loss of E-cadherin expression promotes CD8+ T-cell infiltration, or evidence that CD8+ T cells reduce the E-cadherin expression in cancer cells, which would support our results. Therefore, a prudent validation by different research methods is essential to establish the correlation between CD8+ T cells and E-cadherin expression in cancer cells.
In conclusion, the results of the present study indicate an inverse correlation of CD8+ T-cell infiltration and E-cadherin expression by cancer cells at invasive areas of GBC. However, our data are not enough to establish the above interaction, and further experimental and clinicopathological analyses are needed to test our results.
Gallbladder cancer (GBC) often shows the dedifferentiation or clustering of tumor cells at the areas of infiltration. The author speculated that the type or amount of inflammatory cells that infiltrate into invasive areas of GBC may play some roles in the loss of E-cadherin function, and that tumor-infiltrating inflammatory cells thus contribute to the dedifferentiation of GBC.
This study quantitatively assessed the type and amount of inflammatory cells infiltrating into invasive front of GBC using tissue microarray technique and latest imaging analysis software.
The results of present study indicate an inverse correlation of CD8+ T cell infiltration and cancer cells’ E-cadherin expression at invasive areas of GBC. No previous study in the English literature provides evidence that the loss of E-cadherin expression promotes CD8+ T cell infiltration, or evidence that CD8+ T cells reduce the E-cadherin expression in cancer cells. Their results also indicate the inverse correlation of T-stage and the number of CD8+ T cell infiltration.
The goal of the study is to clarify the correlation of CD8+ T cell infiltration and E-cadherin expression of cancer cells. These results would be applicable to clarify the mechanism of dedifferentiation and metastasis of cancer. However, further analyses are essential for conclusive result for the correlation of CD8+ T cell infiltration and E-cadherin expression of cancer cells.
E-cadherin is a well-known cell adhesion molecule and the E-cadherin-catenin complex plays a key role in cellular adhesion; the loss of this function has been associated with tumor dedifferentiation and metastasis. A CD8+ T cell was known as cytotoxic T cell or killer T cell that kills cancer cells, cells that are infected (particularly with viruses), or cells that are damaged in other ways.
This study investigates the association between the expression of E-cadherin and the numbers of several types of inflammatory cells infiltrating into the invasive portion of GBC.
| 1. | Kai K, Kohya N, Kitahara K, Masuda M, Miyoshi A, Ide T, Tokunaga O, Miyazaki K, Noshiro H. Tumor budding and dedifferentiation in gallbladder carcinoma: potential for the prognostic factors in T2 lesions. Virchows Arch. 2011;459:449-456. [RCA] [PubMed] [DOI] [Full Text] [Cited by in Crossref: 27] [Cited by in RCA: 25] [Article Influence: 1.7] [Reference Citation Analysis (0)] |
| 2. | Friedmann-Morvinski D, Verma IM. Dedifferentiation and reprogramming: origins of cancer stem cells. EMBO Rep. 2014;15:244-253. [RCA] [PubMed] [DOI] [Full Text] [Cited by in Crossref: 291] [Cited by in RCA: 388] [Article Influence: 32.3] [Reference Citation Analysis (0)] |
| 3. | Chui MH. Insights into cancer metastasis from a clinicopathologic perspective: Epithelial-Mesenchymal Transition is not a necessary step. Int J Cancer. 2013;132:1487-1495. [RCA] [PubMed] [DOI] [Full Text] [Cited by in Crossref: 78] [Cited by in RCA: 93] [Article Influence: 6.6] [Reference Citation Analysis (0)] |
| 4. | Gabbert H, Wagner R, Moll R, Gerharz CD. Tumor dedifferentiation: an important step in tumor invasion. Clin Exp Metastasis. 1985;3:257-279. [PubMed] |
| 5. | Prall F. Tumour budding in colorectal carcinoma. Histopathology. 2007;50:151-162. [RCA] [PubMed] [DOI] [Full Text] [Cited by in Crossref: 266] [Cited by in RCA: 287] [Article Influence: 15.1] [Reference Citation Analysis (0)] |
| 6. | Coman DR. Decreased mutual adhesiveness, a property of cells from squamous cell carcinomas. Cancer Res. 1944;4:625-629. |
| 7. | McCutcheon M, Coman DR, moore FB. Studies on invasiveness of cancer; adhesiveness of malignant cells in various human adenocarcinomas. Cancer. 1948;1:460-467. [PubMed] |
| 8. | Hirohashi S. Inactivation of the E-cadherin-mediated cell adhesion system in human cancers. Am J Pathol. 1998;153:333-339. [RCA] [PubMed] [DOI] [Full Text] [Cited by in Crossref: 620] [Cited by in RCA: 630] [Article Influence: 22.5] [Reference Citation Analysis (0)] |
| 9. | Sobin L, Gospodarowicz M, Wittekind C. TNM Classification of malignant tumors. Hoboken, NJ: John Wiley & Sons 2009; . |
| 10. | Segal AW. How neutrophils kill microbes. Annu Rev Immunol. 2005;23:197-223. [RCA] [PubMed] [DOI] [Full Text] [Cited by in Crossref: 1202] [Cited by in RCA: 1274] [Article Influence: 60.7] [Reference Citation Analysis (0)] |
| 11. | Naito Y, Saito K, Shiiba K, Ohuchi A, Saigenji K, Nagura H, Ohtani H. CD8+ T cells infiltrated within cancer cell nests as a prognostic factor in human colorectal cancer. Cancer Res. 1998;58:3491-3494. [PubMed] |
| 12. | Guidoboni M, Gafà R, Viel A, Doglioni C, Russo A, Santini A, Del Tin L, Macrì E, Lanza G, Boiocchi M. Microsatellite instability and high content of activated cytotoxic lymphocytes identify colon cancer patients with a favorable prognosis. Am J Pathol. 2001;159:297-304. [RCA] [PubMed] [DOI] [Full Text] [Cited by in Crossref: 224] [Cited by in RCA: 254] [Article Influence: 10.2] [Reference Citation Analysis (0)] |
| 13. | Wakabayashi O, Yamazaki K, Oizumi S, Hommura F, Kinoshita I, Ogura S, Dosaka-Akita H, Nishimura M. CD4+ T cells in cancer stroma, not CD8+ T cells in cancer cell nests, are associated with favorable prognosis in human non-small cell lung cancers. Cancer Sci. 2003;94:1003-1009. [PubMed] |
| 14. | Prall F, Dührkop T, Weirich V, Ostwald C, Lenz P, Nizze H, Barten M. Prognostic role of CD8+ tumor-infiltrating lymphocytes in stage III colorectal cancer with and without microsatellite instability. Hum Pathol. 2004;35:808-816. [PubMed] |
| 15. | Fukunaga A, Miyamoto M, Cho Y, Murakami S, Kawarada Y, Oshikiri T, Kato K, Kurokawa T, Suzuoki M, Nakakubo Y. CD8+ tumor-infiltrating lymphocytes together with CD4+ tumor-infiltrating lymphocytes and dendritic cells improve the prognosis of patients with pancreatic adenocarcinoma. Pancreas. 2004;28:e26-e31. [PubMed] |
| 16. | Leffers N, Gooden MJ, de Jong RA, Hoogeboom BN, ten Hoor KA, Hollema H, Boezen HM, van der Zee AG, Daemen T, Nijman HW. Prognostic significance of tumor-infiltrating T-lymphocytes in primary and metastatic lesions of advanced stage ovarian cancer. Cancer Immunol Immunother. 2009;58:449-459. [RCA] [PubMed] [DOI] [Full Text] [Cited by in Crossref: 307] [Cited by in RCA: 324] [Article Influence: 19.1] [Reference Citation Analysis (0)] |
| 17. | de Jong RA, Leffers N, Boezen HM, ten Hoor KA, van der Zee AG, Hollema H, Nijman HW. Presence of tumor-infiltrating lymphocytes is an independent prognostic factor in type I and II endometrial cancer. Gynecol Oncol. 2009;114:105-110. [RCA] [PubMed] [DOI] [Full Text] [Cited by in Crossref: 127] [Cited by in RCA: 170] [Article Influence: 10.0] [Reference Citation Analysis (0)] |
| 18. | Shah W, Yan X, Jing L, Zhou Y, Chen H, Wang Y. A reversed CD4/CD8 ratio of tumor-infiltrating lymphocytes and a high percentage of CD4(+)FOXP3(+) regulatory T cells are significantly associated with clinical outcome in squamous cell carcinoma of the cervix. Cell Mol Immunol. 2011;8:59-66. [RCA] [PubMed] [DOI] [Full Text] [Cited by in Crossref: 152] [Cited by in RCA: 216] [Article Influence: 13.5] [Reference Citation Analysis (1)] |
| 19. | Nakakubo Y, Miyamoto M, Cho Y, Hida Y, Oshikiri T, Suzuoki M, Hiraoka K, Itoh T, Kondo S, Katoh H. Clinical significance of immune cell infiltration within gallbladder cancer. Br J Cancer. 2003;89:1736-1742. [RCA] [PubMed] [DOI] [Full Text] [Full Text (PDF)] [Cited by in Crossref: 76] [Cited by in RCA: 78] [Article Influence: 3.4] [Reference Citation Analysis (0)] |
| 20. | Kai K, Masuda M, Ide T, Takase Y, Miyoshi A, Kitahara K, Miyazaki K, Noshiro H, Tokunaga O. Mitotic count reflects prognosis of gallbladder cancer particularly among patients with T3 tumor. Mol Clin Oncol. 2013;1:633-638. [RCA] [PubMed] [DOI] [Full Text] [Full Text (PDF)] [Cited by in Crossref: 4] [Cited by in RCA: 4] [Article Influence: 0.3] [Reference Citation Analysis (0)] |
| 21. | Mlecnik B, Tosolini M, Kirilovsky A, Berger A, Bindea G, Meatchi T, Bruneval P, Trajanoski Z, Fridman WH, Pagès F. Histopathologic-based prognostic factors of colorectal cancers are associated with the state of the local immune reaction. J Clin Oncol. 2011;29:610-618. [RCA] [PubMed] [DOI] [Full Text] [Cited by in Crossref: 689] [Cited by in RCA: 806] [Article Influence: 53.7] [Reference Citation Analysis (1)] |
| 22. | Priya TP, Kapoor VK, Krishnani N, Agrawal V, Agrawal S. Role of E-cadherin gene in gall bladder cancer and its precursor lesions. Virchows Arch. 2010;456:507-514. [RCA] [PubMed] [DOI] [Full Text] [Cited by in Crossref: 16] [Cited by in RCA: 18] [Article Influence: 1.1] [Reference Citation Analysis (0)] |
Manuscript source: Invited manuscript
Specialty type: Medicine, research and experimental
Country of origin: Japan
Peer-review report classification
Grade A (Excellent): 0
Grade B (Very good): B
Grade C (Good): C, C
Grade D (Fair): 0
Grade E (Poor): 0
Open-Access: This article is an open-access article which was selected by an in-house editor and fully peer-reviewed by external reviewers. It is distributed in accordance with the Creative Commons Attribution Non Commercial (CC BY-NC 4.0) license, which permits others to distribute, remix, adapt, build upon this work non-commercially, and license their derivative works on different terms, provided the original work is properly cited and the use is non-commercial. See: http://creativecommons.org/licenses/by-nc/4.0/
P- Reviewer: Ding HG, Peng Y, Wang DH S- Editor: Qiu S L- Editor: A E- Editor: Li D


