Published online Jul 26, 2023. doi: 10.12998/wjcc.v11.i21.5023
Peer-review started: March 3, 2023
First decision: May 19, 2023
Revised: June 1, 2023
Accepted: June 26, 2023
Article in press: June 26, 2023
Published online: July 26, 2023
Processing time: 145 Days and 11.7 Hours
Gastric cancer (GC) is one of the most common cancers and has a poor prognosis. Treatment of GC has remained unchanged over the past few years.
To investigate the potential therapeutic targets and related regulatory biomarkers of GC.
We obtained the public GC transcriptome sequencing dataset from the Gene Expression Omnibus database. The datasets contained 348 GC tissues and 141 healthy tissues. In total, 251 differentially expressed genes (DEGs) were identified, including 187 down-regulated genes and 64 up-regulated genes. The DEGs’ enriched functions and pathways include Progesterone-mediated oocyte matura
We focused on three critical genes, which were highly expressed in GC, but negatively related to patient survival. Furthermore, we found that knockdown of BIRC5, TRIP13 or UBE2C significantly inhibited cell proliferation and induced cell apoptosis. In addition, knockdown of BIRC5, TRIP13 or UBE2C increased cellular sensitivity to cisplatin.
Our study identified significantly upregulated genes in GC with a poor prognosis using integrated bioinformatics methods.
Core Tip: Gastric cancer (GC) is one of the most common malignancies of the digestive system with few genetic markers for its early detection and prevention. 348 GC tissues and 141 normal tissues were analyzed in this study; 251 differentially expressed genes (DEGs) were identified including 187 down-regulated genes and 64 up-regulated genes. Significantly upregulated genes with a poor prognosis in GC were detected using integrated bioinformatics methods. Furthermore, the molecular mechanism of GC via bioinformatics analysis showed three DEGs (BIRC5, TRIP13, or UBE2C) which play key roles in the progression of CG.
- Citation: Yu K, Zhang D, Yao Q, Pan X, Wang G, Qian HY, Xiao Y, Chen Q, Mei K. Identification of functional genes regulating gastric cancer progression using integrated bioinformatics analysis. World J Clin Cases 2023; 11(21): 5023-5034
- URL: https://www.wjgnet.com/2307-8960/full/v11/i21/5023.htm
- DOI: https://dx.doi.org/10.12998/wjcc.v11.i21.5023
Gastric cancer (GC) remains the most common cause of cancer death globally, although the mortality of GC has markedly declined in the past year[1]. Although tremendous efforts have been made to analyze the pathogenesis, there is limited knowledge on the exact molecular mechanisms involved in GC. It was reported that several prognostic potential biomarkers have been examined, but the precise pathogenic mechanism of GC remains to be illustrated[2,3]. It is essential to investigate the variations in global gene expression to enhance the efficacy of treatment and to assist us in understanding the pathogenesis of GC. As a mature technology, gene chip is widely used in modern medicine[4]. It can detect differentially expressed genes (DEGs) quickly, which are stored in public databases. Therefore, many related studies on GC have been published in recent years[5-8]. Genetic factors were revealed to play an important role in susceptibility to GC.
The Gene Expression Omnibus (GEO) datasets GSE13911, GSE66229, and GSE79973 were selected for this study. The GEO2R web tool and Venn diagram software were used to assess the DEGs in the three datasets mentioned above. To examine the screened DEGs with Gene Ontology (GO) and Kyoto Encyclopedia of Genes and Genomes (KEGG) pathway enrichment analysis, we used the Database for Annotation, Visualization, and Integrated Discovery (DAVID, http://david.abcc.ncifcrf.gov). Then, we analyzed the DEGs and screened the protein-protein interaction (PPI) network modules in GC using the PPI network DEGs.
We applied Cytotype Molecular Complex Detection (MCODE) to screen the key gene modules and co-expression networks to identify their relative significance in the three datasets above. Among these DEGs, 26 genes showed a significant difference in the PPI network. Subsequently, the 26 core DEGs were generated by the Kaplan Meier plotter online database (http://www.kmplot.com) for crucial prognostic information (P < 0.05). Also, we determined the expression of the DEGs in Gene Expression Profiling Interactive Analysis (GEPIA, http://gepia.cancer-pku.cn) (P < 0.05) between GC tissues and normal gastric tissues.
We found 22 DEGs based on these data. The 22 DEGs were then re-analyzed for KEGG pathway enrichment. Subsequently, based on survival analysis, three DEGs (BIRC5, TRIP13, and UBE2C) were important related genes and played key roles in cellular pathways. Thus, we identified the underlying gene pathways and potential molecular mechanisms. These results may contribute to the treatment, diagnosis, and prevention of GC. Cellular experiments also revealed that targeting these three genes inhibited proliferation of GC cell lines and overcame resistance to cisplatin, which may provide novel therapeutic targets for GC.
The expression profiles of GC and healthy gastric tissues in the GSE13911, GSE66229, and GSE79973 datasets were available from the NCBI-GEO (http://www.ncbi.nlm.nih.gov/geo/), which were all performed on the GPL570 platform, an open database of microarray/gene profiles. Microarray data of GSE13911, GSE66229, and GSE79973 were all based on Affymetrix HGU 133 Plus 2 microarrays (Affymetrix, Inc., Santa Clara, CA, United States).
In GSE13911, there were 69 samples from 38 GC patients and 31 normal individuals; GSE66229 contains microarray data from healthy controls and GC patients. There were 400 samples in GSE66229, including 300 GC samples and 100 control samples. GSE79973 contains data from 10 cognitively healthy controls and 10 GC patients.
DEGs in GC tissues and healthy tissues were identified via GEO2R online tools[9] with an adjusted P value < 0.05 and
Gene ontology (GO; http://www.geneontology.org) analysis is a commonly used approach for the unification of biology that offers information on gene product function using ontologies to represent biological knowledge[10]. The KEGG is a large-scale database[11] including drugs, genomes, diseases, chemical materials, biological pathways, and so on. The DAVID is a useful bioinformatics tool designed to check a large number of gene or protein functions online[12]. We used DAVID to identify GO categories and pathways (P < 0.05).
Based on the Search Tool for the Retrieval of Interacting Genes (STRING) information database[13], the PPI network was constructed. The STRING database was then visualized using Cytoscape software version, a popular open-source software tool from the network: www.Cytoscape.org[14], to identify the prognostic correlation among the DEGs above, we set the confidence score to ³0.4 (modest confidence). The MCODE program in Cytoscape was also used to explore the PPI network modules (we set: Node score cut off = 0.2, degree cut off = 2, k-core = 2, and max. depth from seed = 100).
Kaplan Meier-plotter (KM plotter, http://kmplot.com/analysis/) was used to assess the effect of numerous genes on survival based on EGA, TCGA database, and GEO. The log-rank P value and hazard ratio with 95% confidence intervals (CI) were computed and are shown on the plot[15]. To validate these DEGs, we used the GEPIA website to analyze RNA sequencing expression data based on thousands of samples from the GTEx projects and TCGA[16].
We performed RT-PCR analysis of 15 pairs of patient samples including tumor and adjacent normal tissues in accordance with the ethics permission approved by our hospital. RNA was extracted using Trizol methods as previously described. The cDNA was the synthesized with a reverse transcription kit (Takara, China). The expression levels of BIRC5, TRIP13, and UBE2C genes were detected with a SYBR real-time PCR kit from Takara. The primers used for detecting these three genes were purchased from Thermo Fisher Co.; GAPDH was used as a control.
Human GC cell lines MKN-28 were purchased from the American Type Culture Collection. All cells were maintained at 37oC in a 5% CO2 humidity chamber, in RPMI-1640 medium supplemented with 10% fetal bovine serum (FBS, Gibco) and streptomycin and penicillin (10 mg/mL).
To determine cell proliferation, we used a CCK-8 assay and cells with specific gene knockdown. Briefly, 5000 cells were seeded in each well of 96 well plates. At 24 h, 48 h, and 72 h after plating, the cells were stained with CCK8 solution from a CCK-8 kit (Beyotime, China) and detected under OD570 wavelength. Cell apoptosis was performed using an Annexin V/PI double staining kit according to the manufacturer’s instructions.
For the colony formation assay, cells were seeded in 60 mm dishes at 400, 800, 1600, 3200 cells/dish. Twenty-four hours later, cells were treated with cisplatin at concentrations of 0 μM, 2 μM, 4 μM, and 8 μM. After treatment, the cells were returned to the incubator for an additional 10 d. Colonies were counted after staining with ultraviolet staining solution.
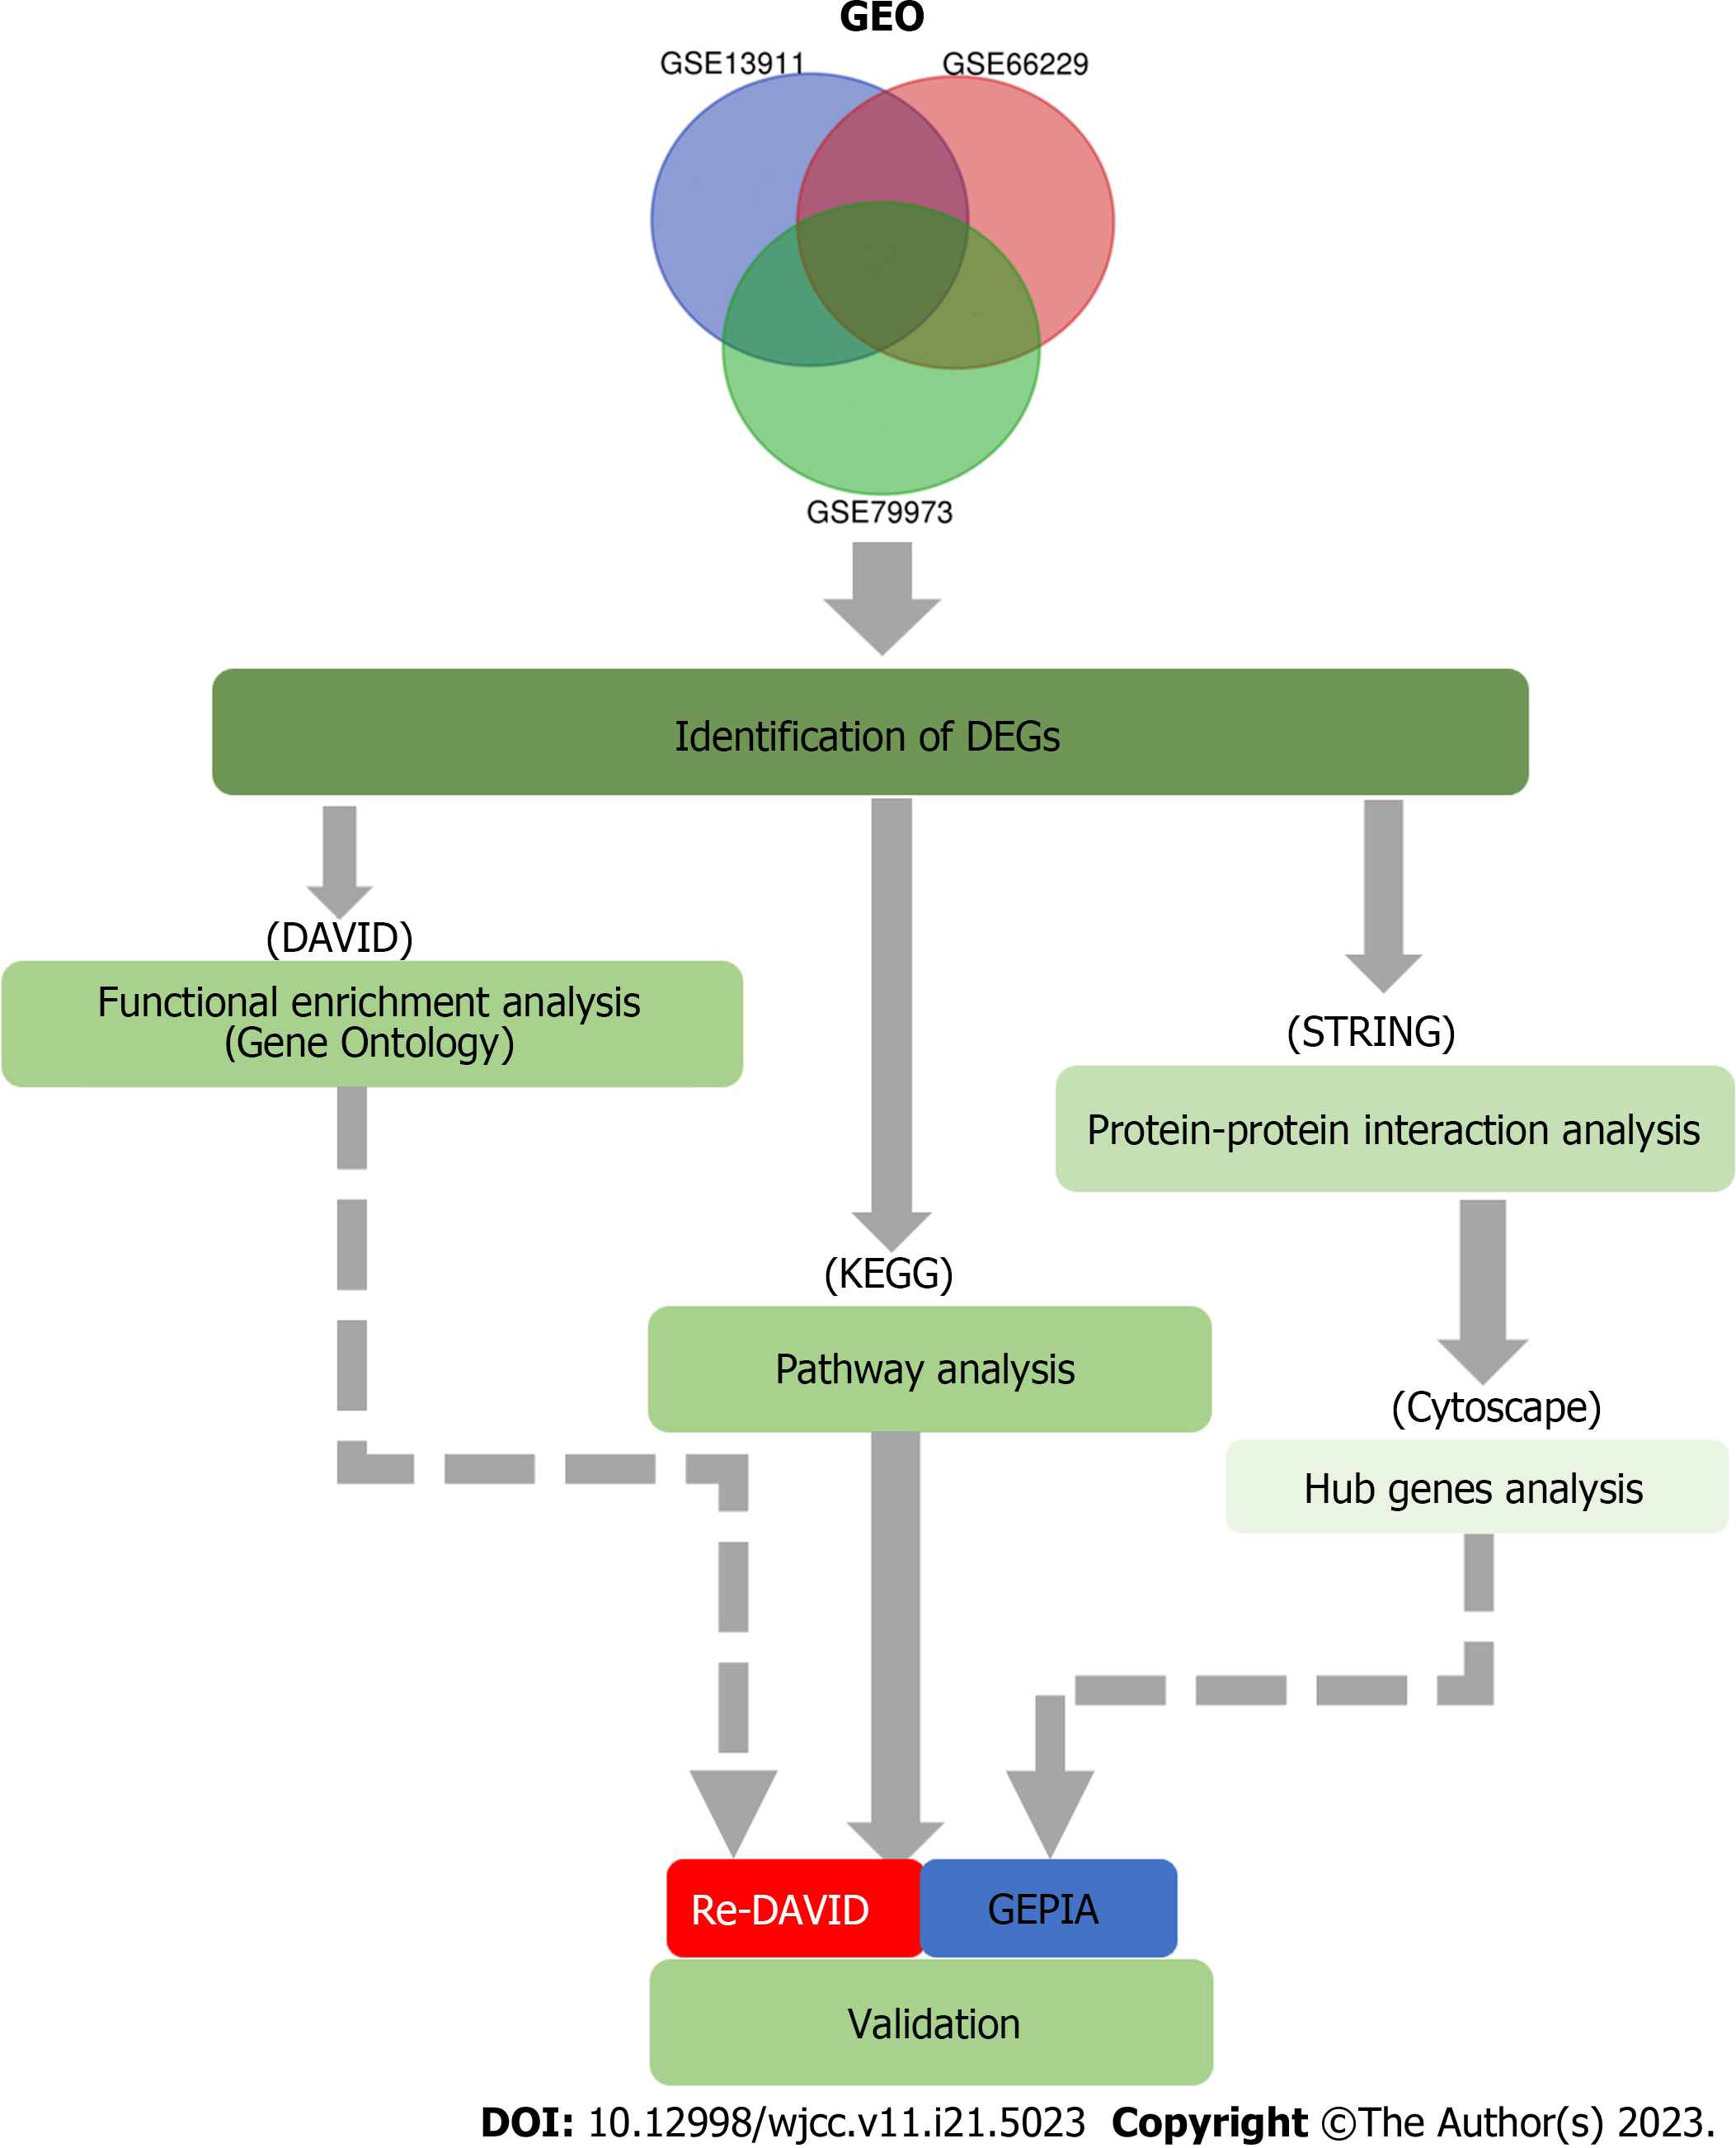
As shown in Figure 1, the flow diagram of this study demonstrates that the raw experimental data were processed using several software packages. The moderate t-test was applied to identify DEGs, and Fisher’s Exact test was used to analyze GO and KEGG annotation enrichments[17].
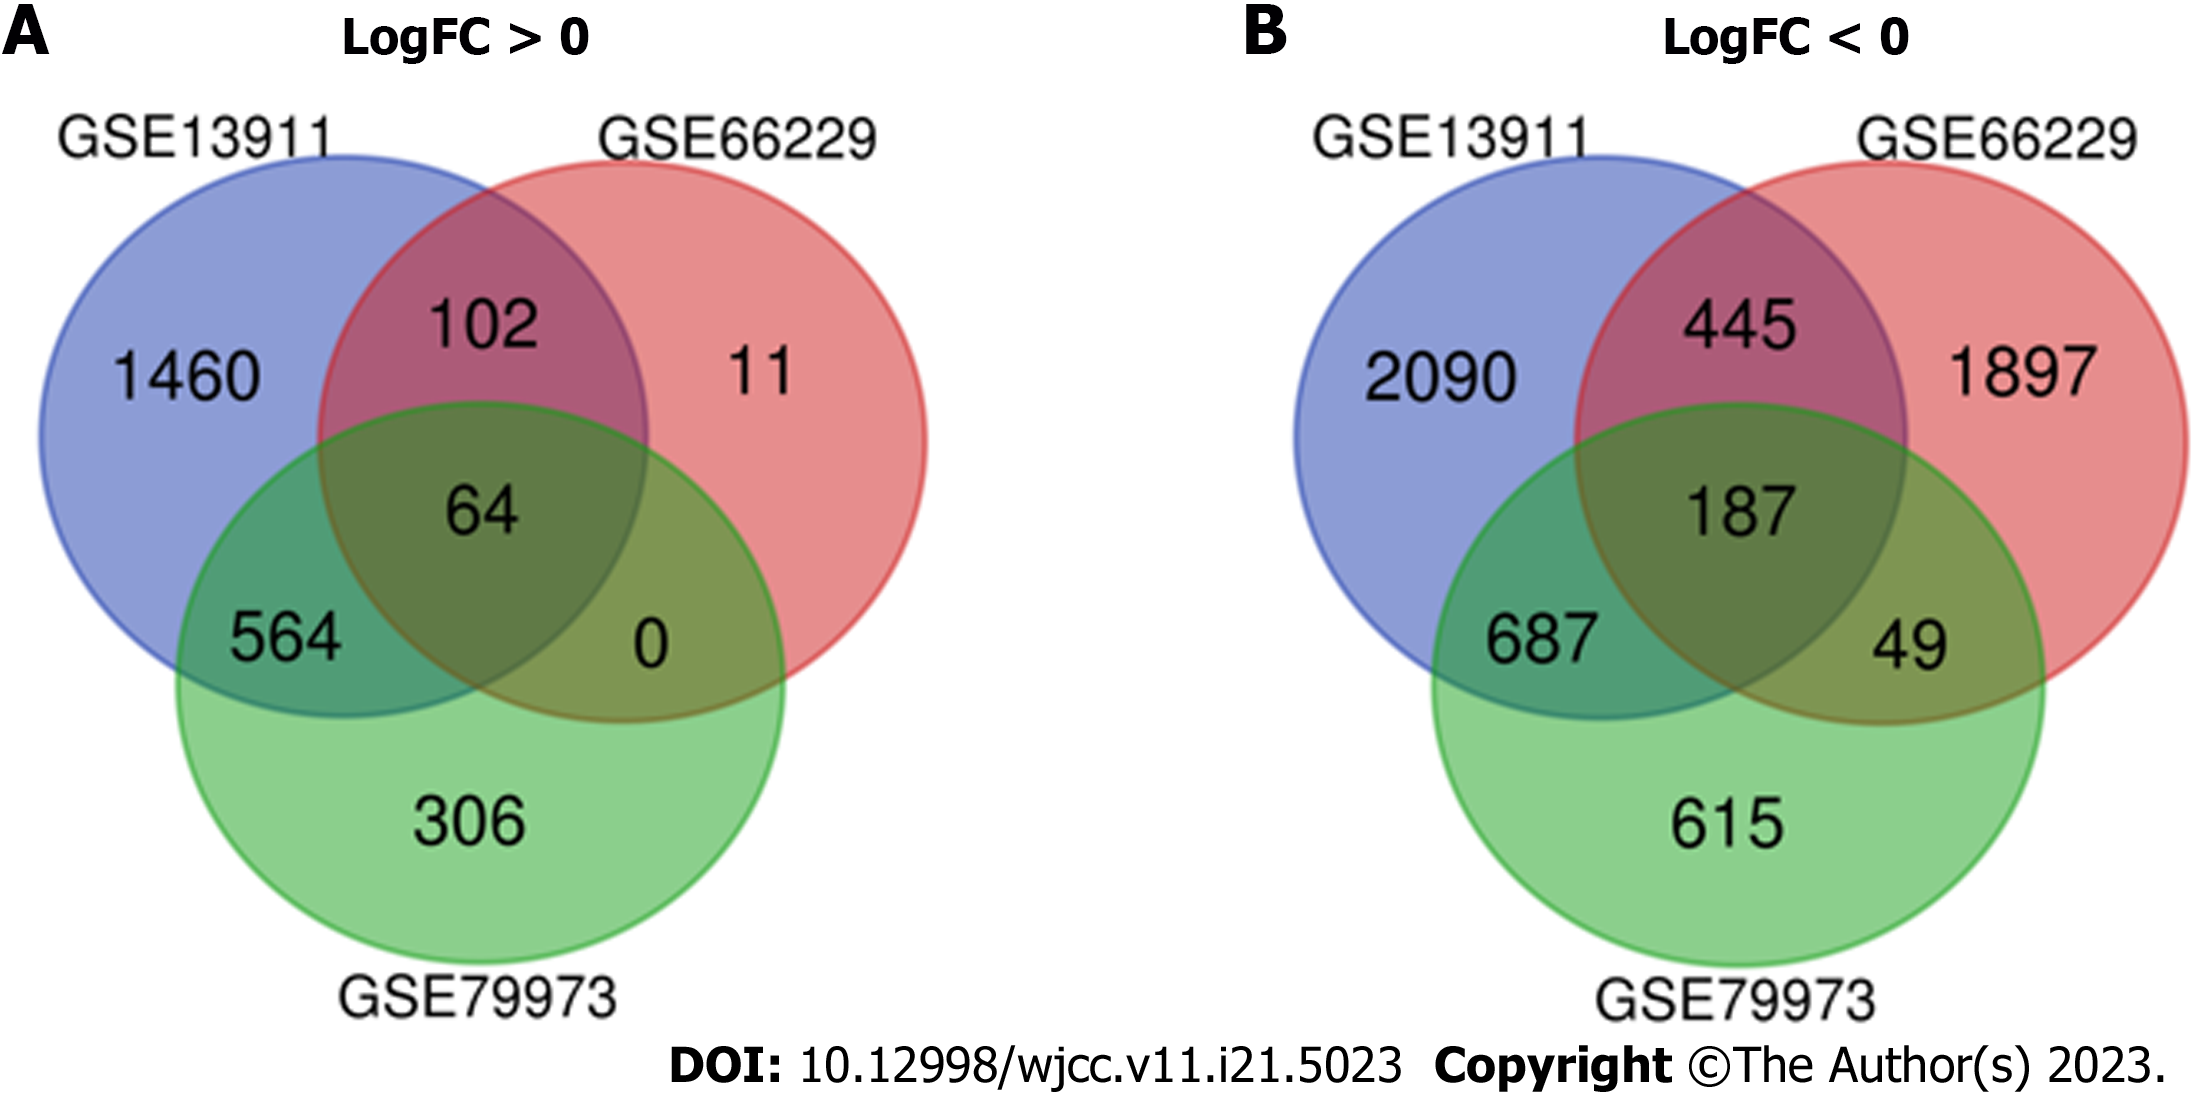
In the current study we included 348 GC tissues and 141 healthy tissues. With the help of GEO2R online tools, we obtained 5599, 2755, and 2473 DEGs from the three databases: GSE13911, GSE66229, and GSE79973, respectively. Among the three datasets, the common DEGs were identified via Venn diagram software. The findings revealed that 251 common DEGs were identified, including 187 and 64 genes which controlled down- and up-related genes in GC tissues, respectively (Supplementary Table 1; Figure 2).
Associated with GO terms, the up-regulated and down-regulated DEGs were enriched in cell division, mitotic nuclear division, and mast cell cytokine production. The markedly up-regulated and down-regulated DEGs in biological process (BP) were involved in cell division, mitotic nuclear division, and mast cell cytokine production. In addition to the enrichment in mitotic metaphase plate congression, the up-regulated DEGs were significantly enriched in the BPs of cell division. In contrast, the down-regulated DEGs were significantly enriched in the metabolic process.
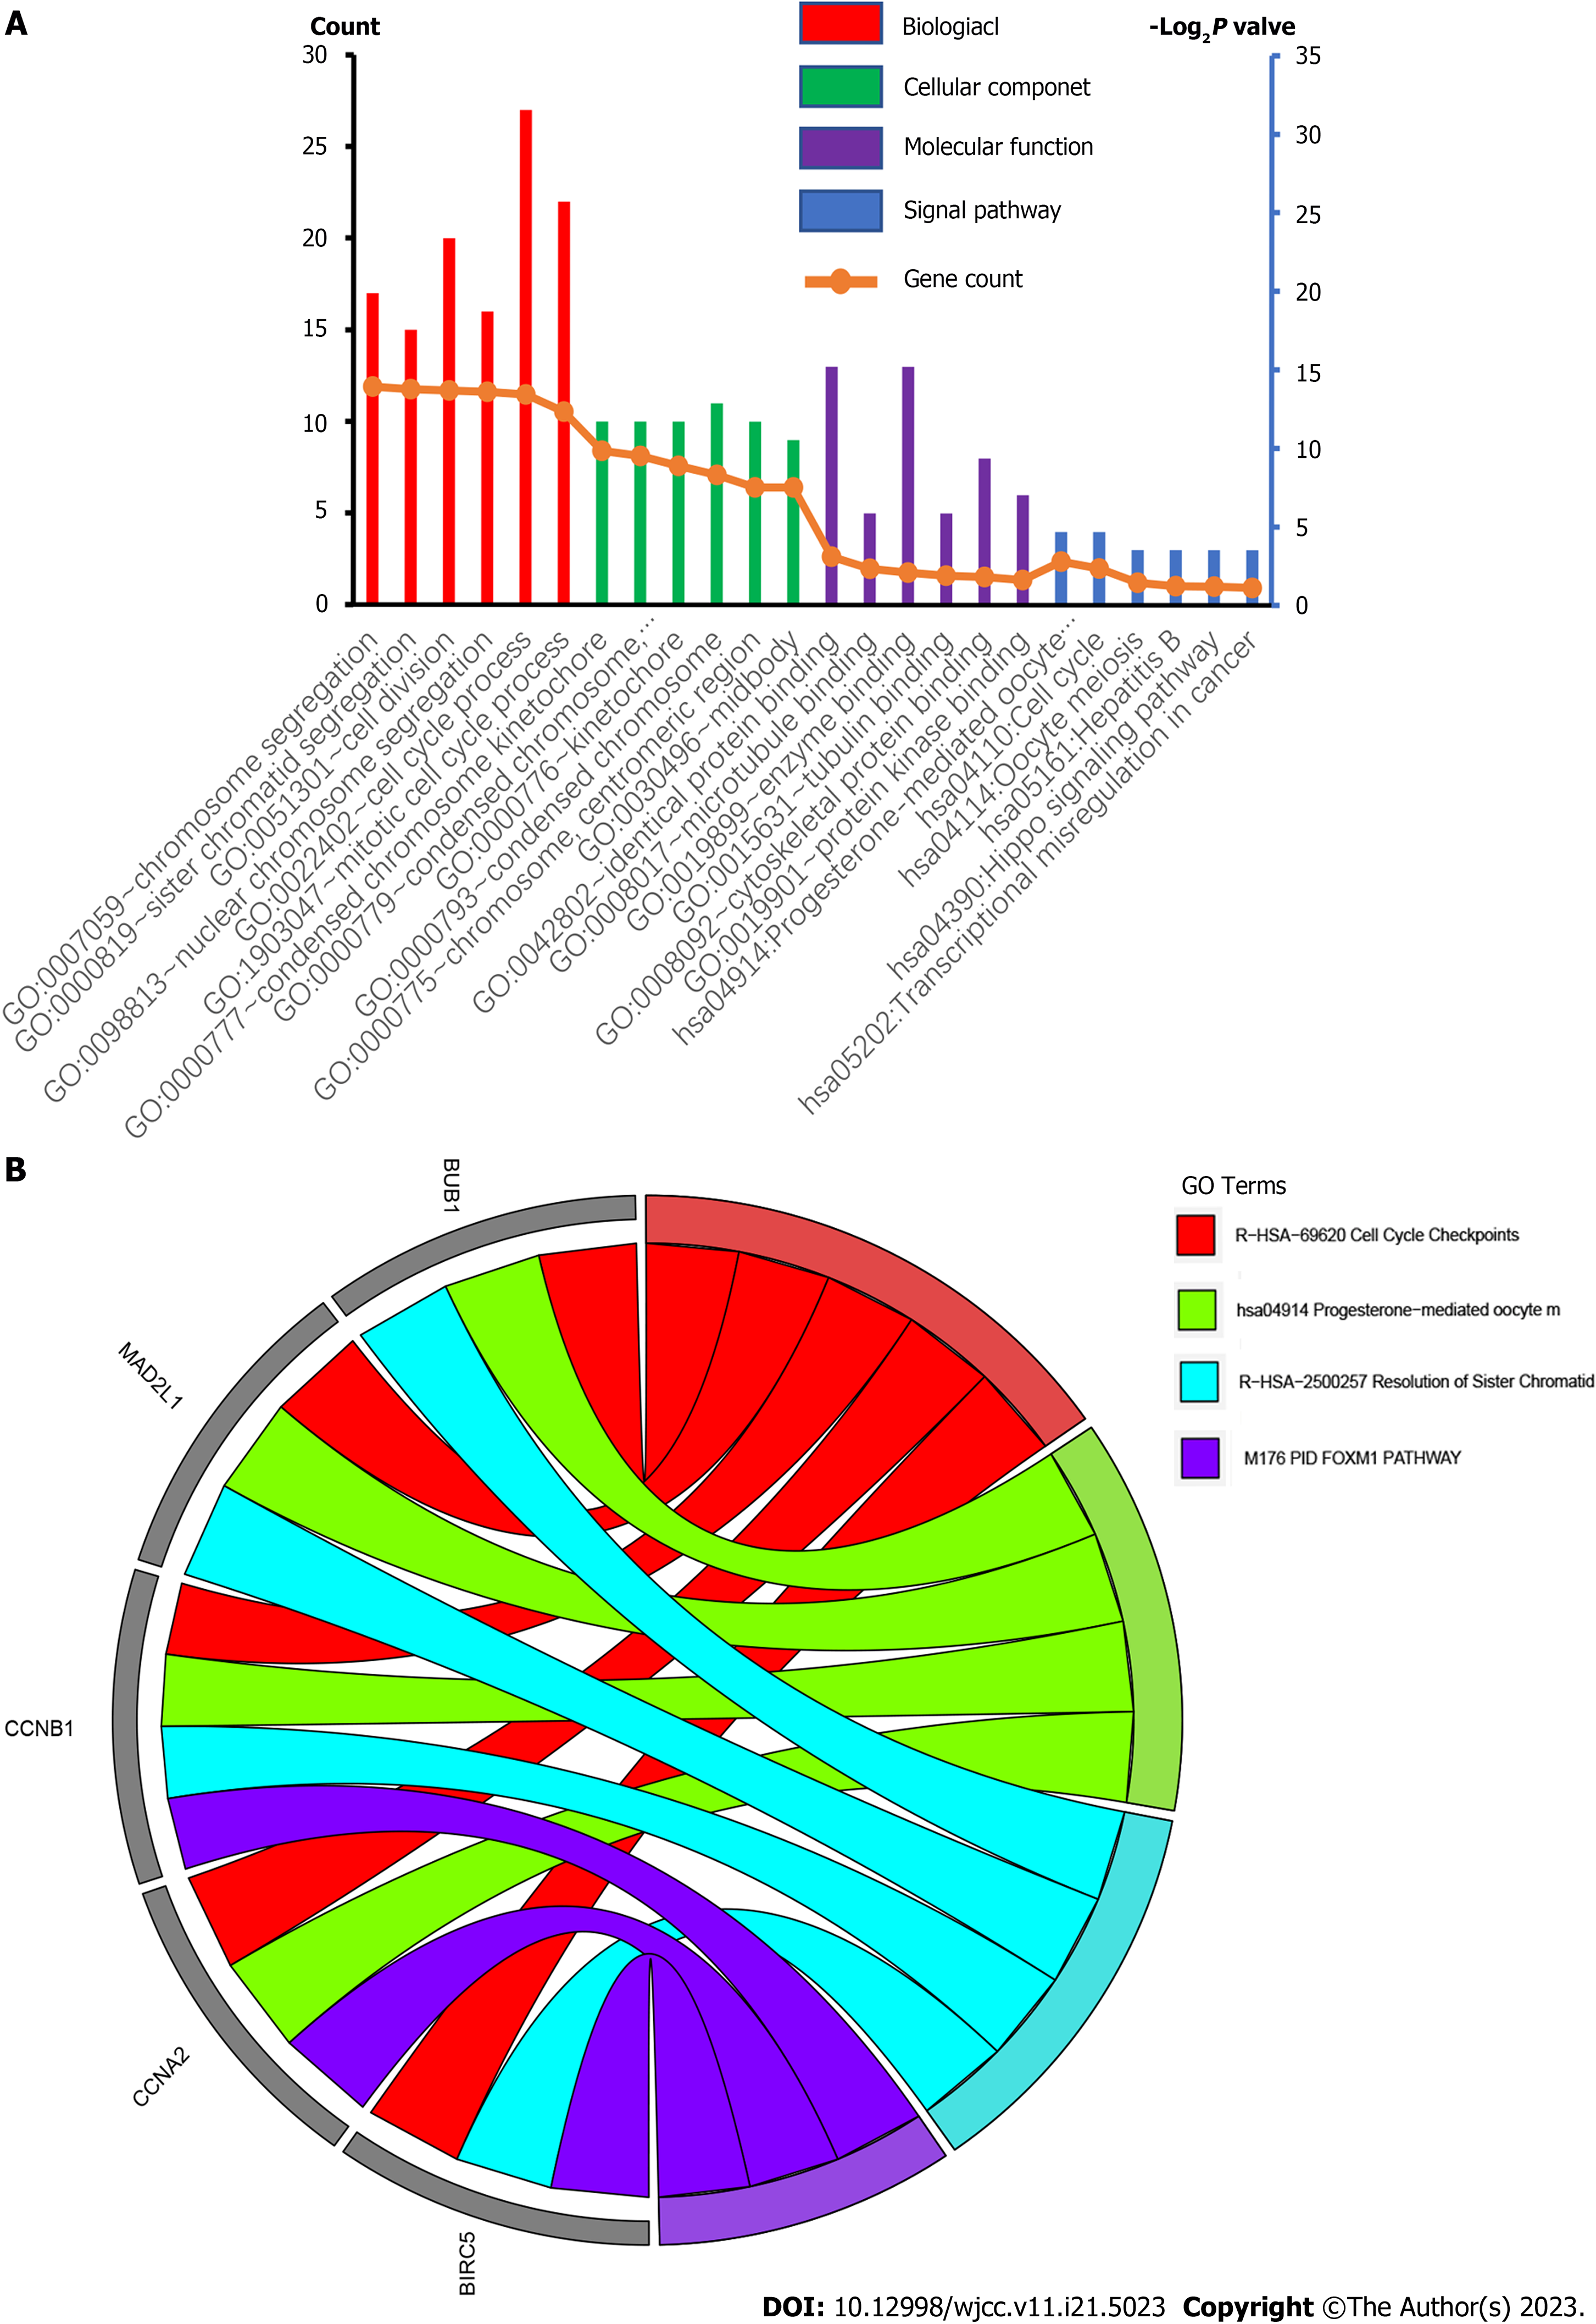
We performed functional and pathway enrichment analyses to investigate the biological classification of DEGs via DAVID. There were three categories in GO analysis: BP, cellular component (CC), and molecular function (MF) GO. In the BP-associated category shown by GO pathway enrichment analysis, the genes were significantly involved in nuclear chromosome segregation, sister chromatid segregation, cell division, cell cycle process, mitotic cell cycle process and down-regulated DEGs in organic acid catabolic process, carboxylic acid catabolic process, small molecule catabolic process, lipid modification, fatty acid catabolic process, and fatty acid oxidation (Supplementary Table 2). MF of DEGs were significantly enriched in identical protein binding, microtubule binding, enzyme binding, tubulin binding, cytoskeletal protein binding, protein kinase binding, cofactor binding, coenzyme binding, potassium channel regulator activity, ligand-gated ion channel activity, and ligand-gated channel activity (Supplementary Table 2). Changes in the CCs of DEGs were mainly enriched in the condensed chromosome kinetochore, condensed chromosome, centromeric region kinetochore, condensed chromosome, chromosome, centromeric region, and midbody (Supplementary Table 2; Figure 3).
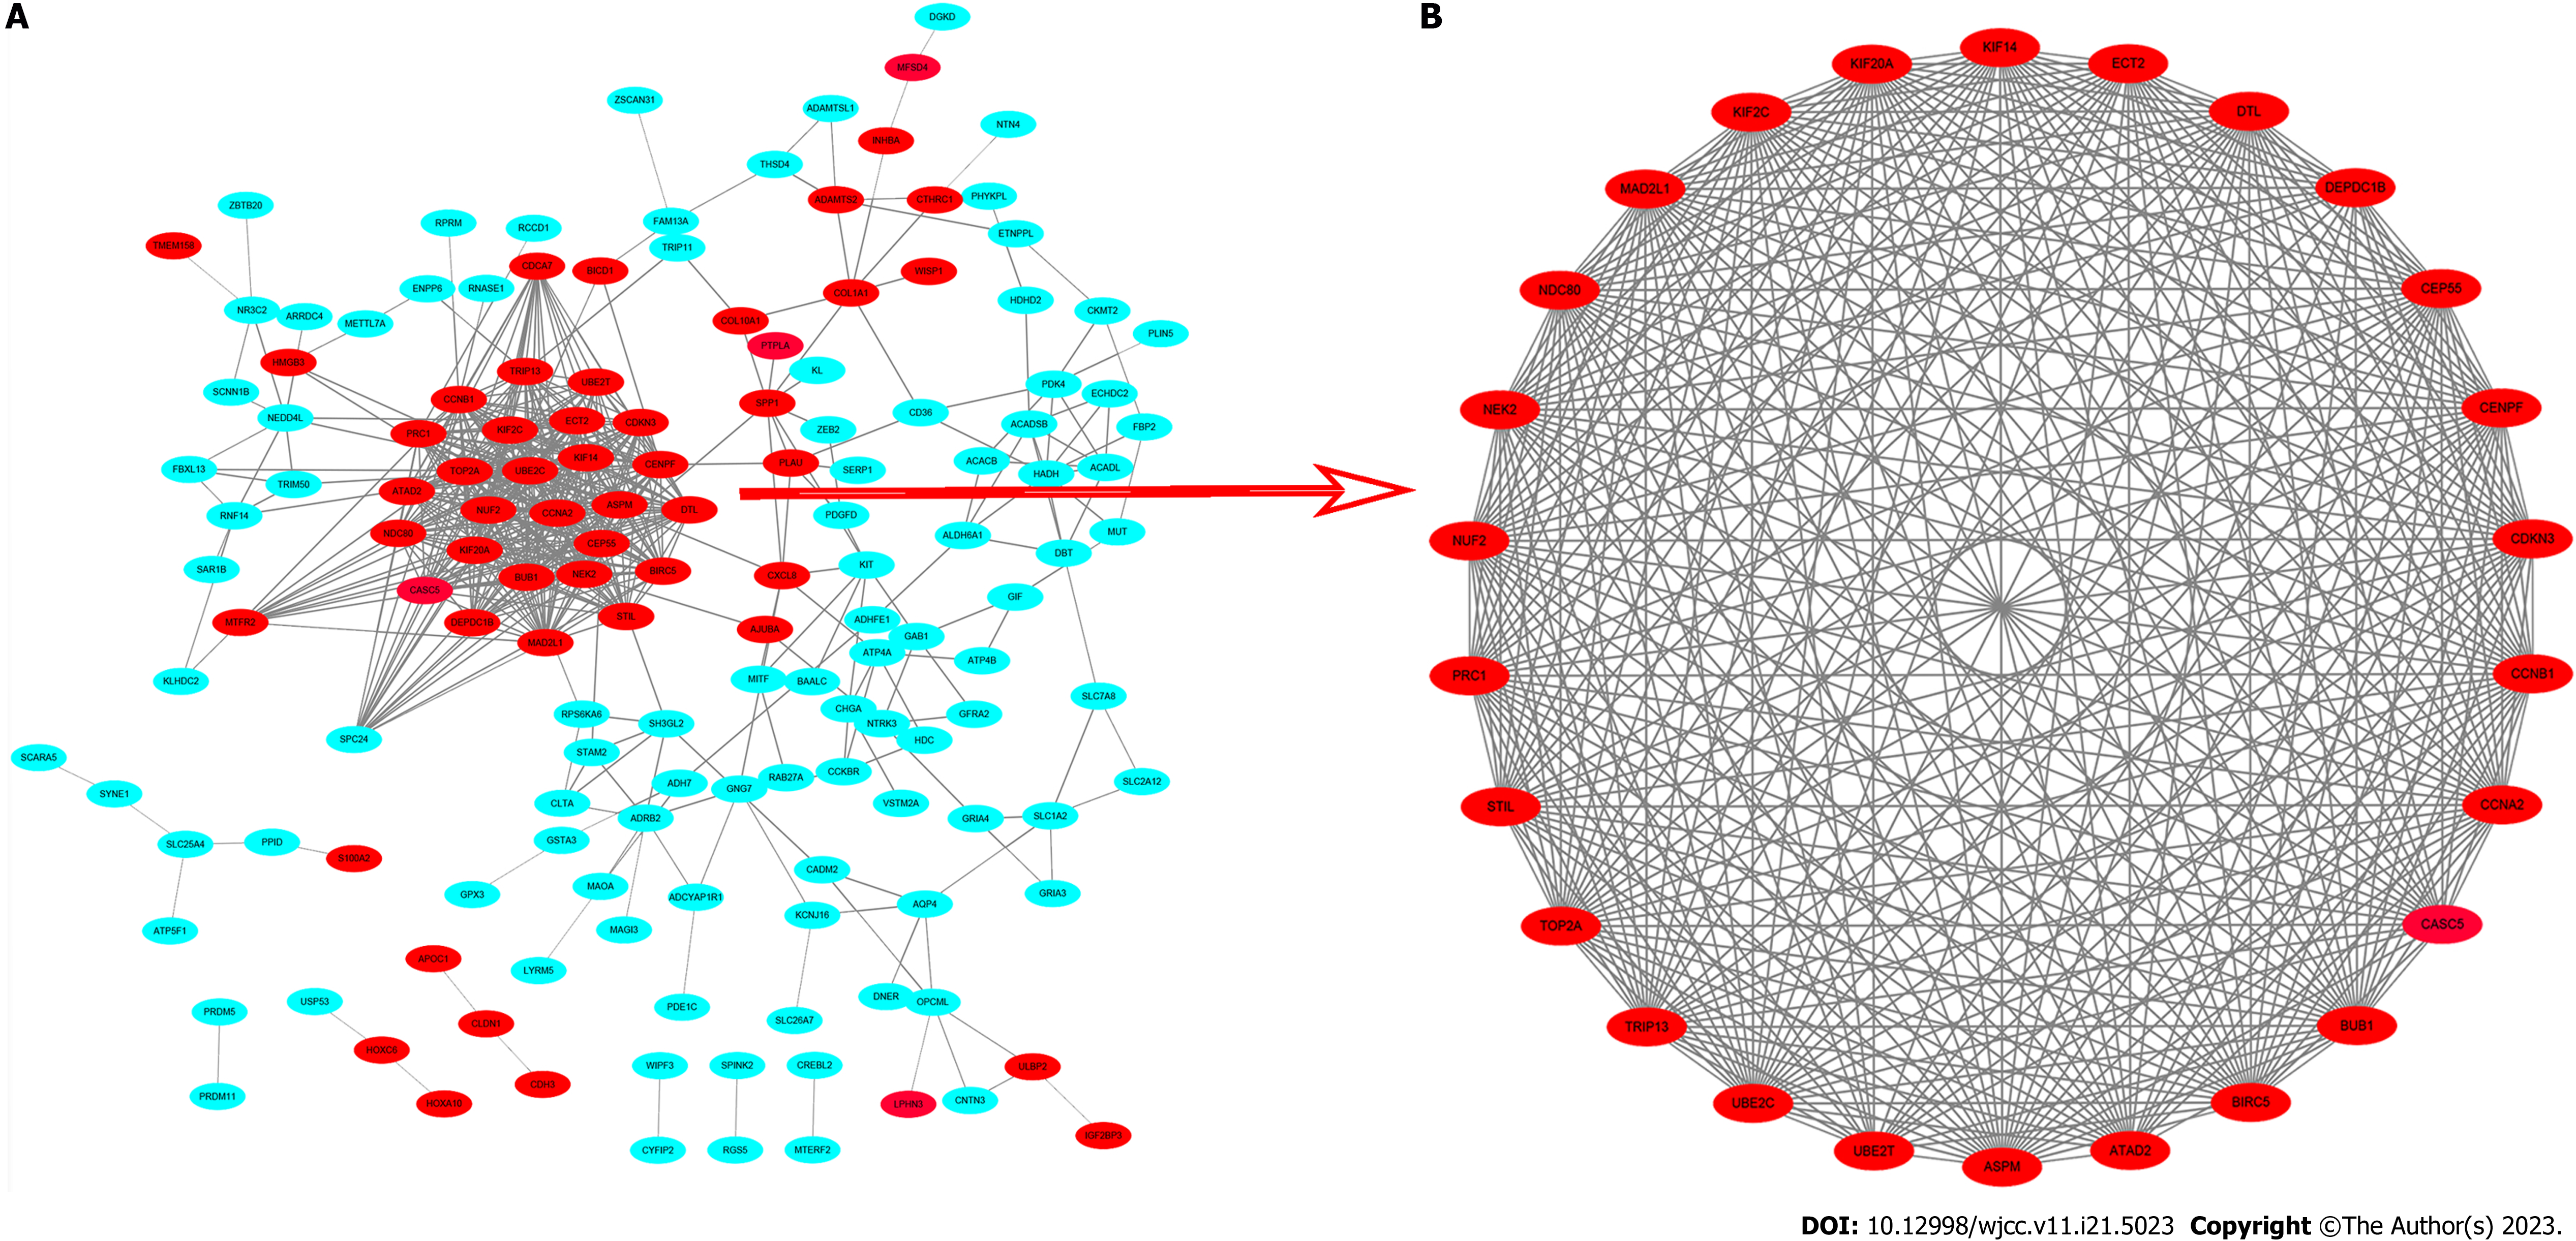
A total of 251 DEGs containing 193 nodes and 633 edges were imported into the DEGs PPI network complex, and 187 down-regulated and 64 up-regulated genes were included (Figure 4A). The 187 down-regulated DEGs were not contained in the DEGs PPI network (Figure 4A). We then used Cytotype MCODE to gain further results: The outcomes showed that among the 64 nodes there were 26 central nodes of up-regulated genes (Figure 4B).
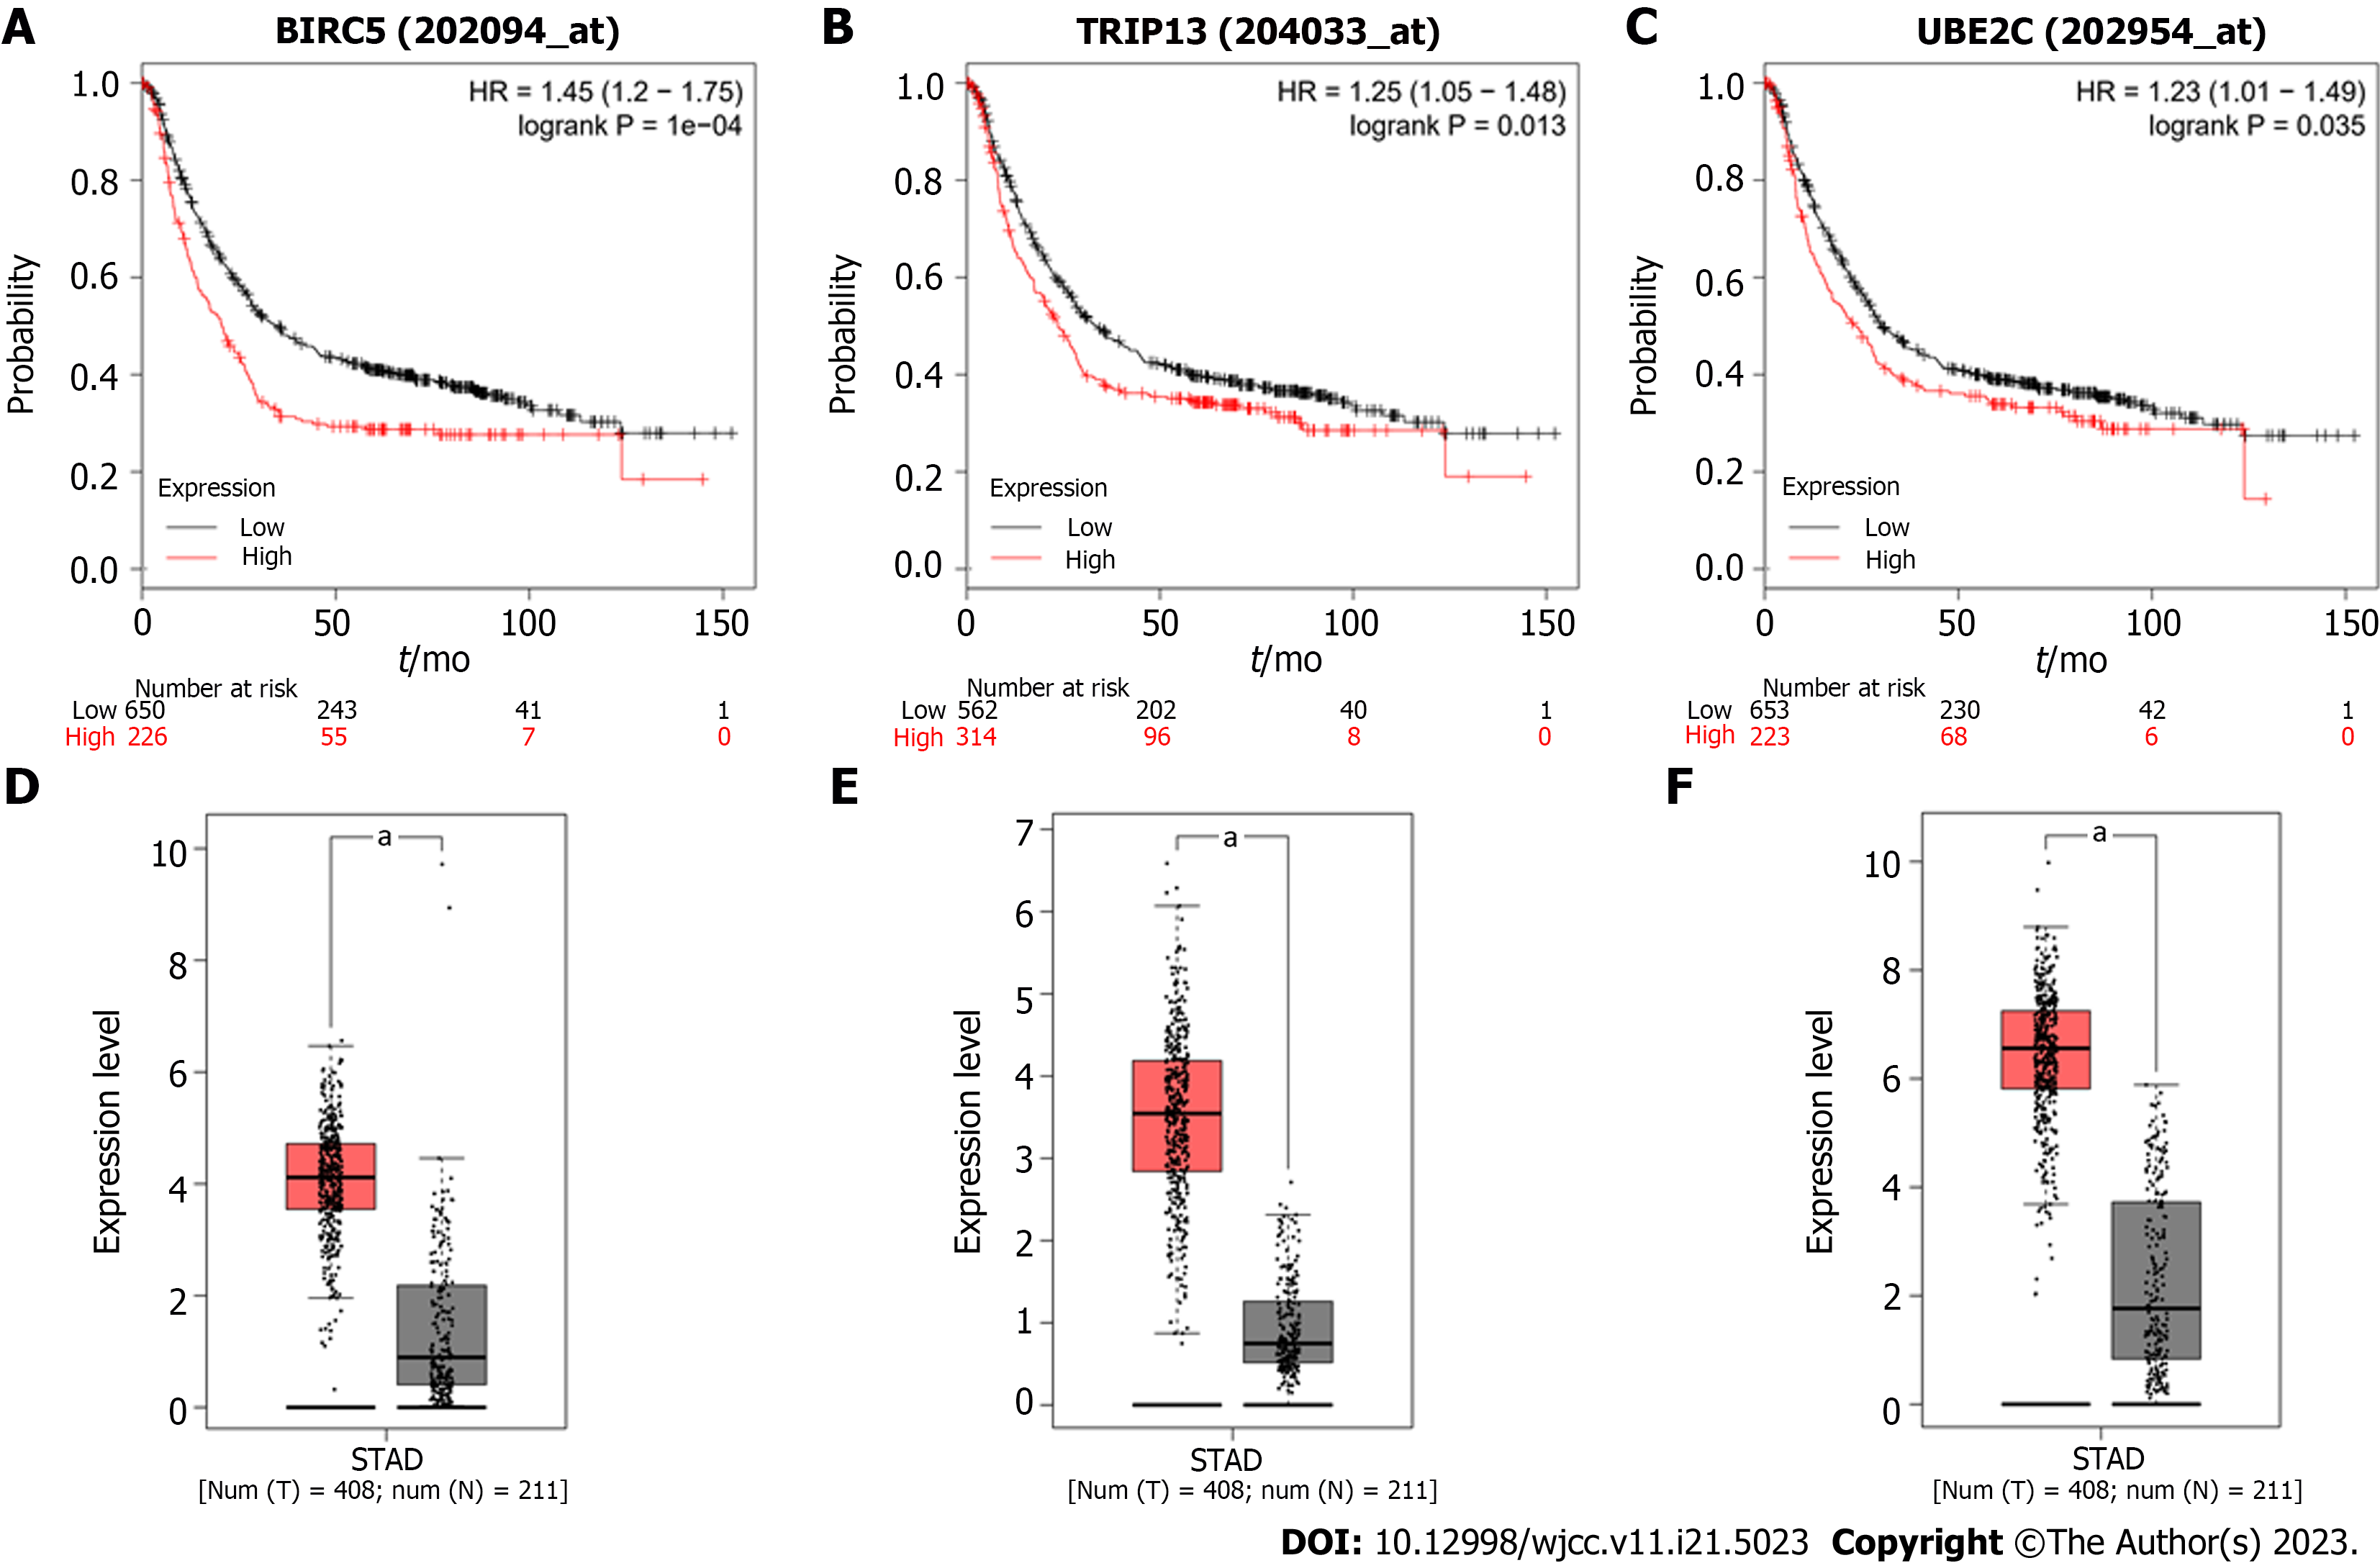
We identified the survival data related to 26 core genes via Kaplan Meier plotter (http://kmplot.com/analysis/). Among these genes, 24 genes showed a significantly poor survival, while 2 showed no significance (P < 0.05, Supplemen
To better understand the possible pathways of these 22 selected DEGs, we re-analyzed KEGG pathway enrichment via DAVID (P < 0.05). We found that five core genes (BUB1, MAD2L1, CCNA2, CCNB1, and BIRC5) were markedly enriched in the progesterone-mediated oocyte maturation and cell cycle pathway (P = 1.9E-3, Supplementary Table 5). Among these genes, the overexpression of BIRC5, TRIP13, and UBE2C was negatively correlated with poor outcomes in GC patients, and were further investigated.
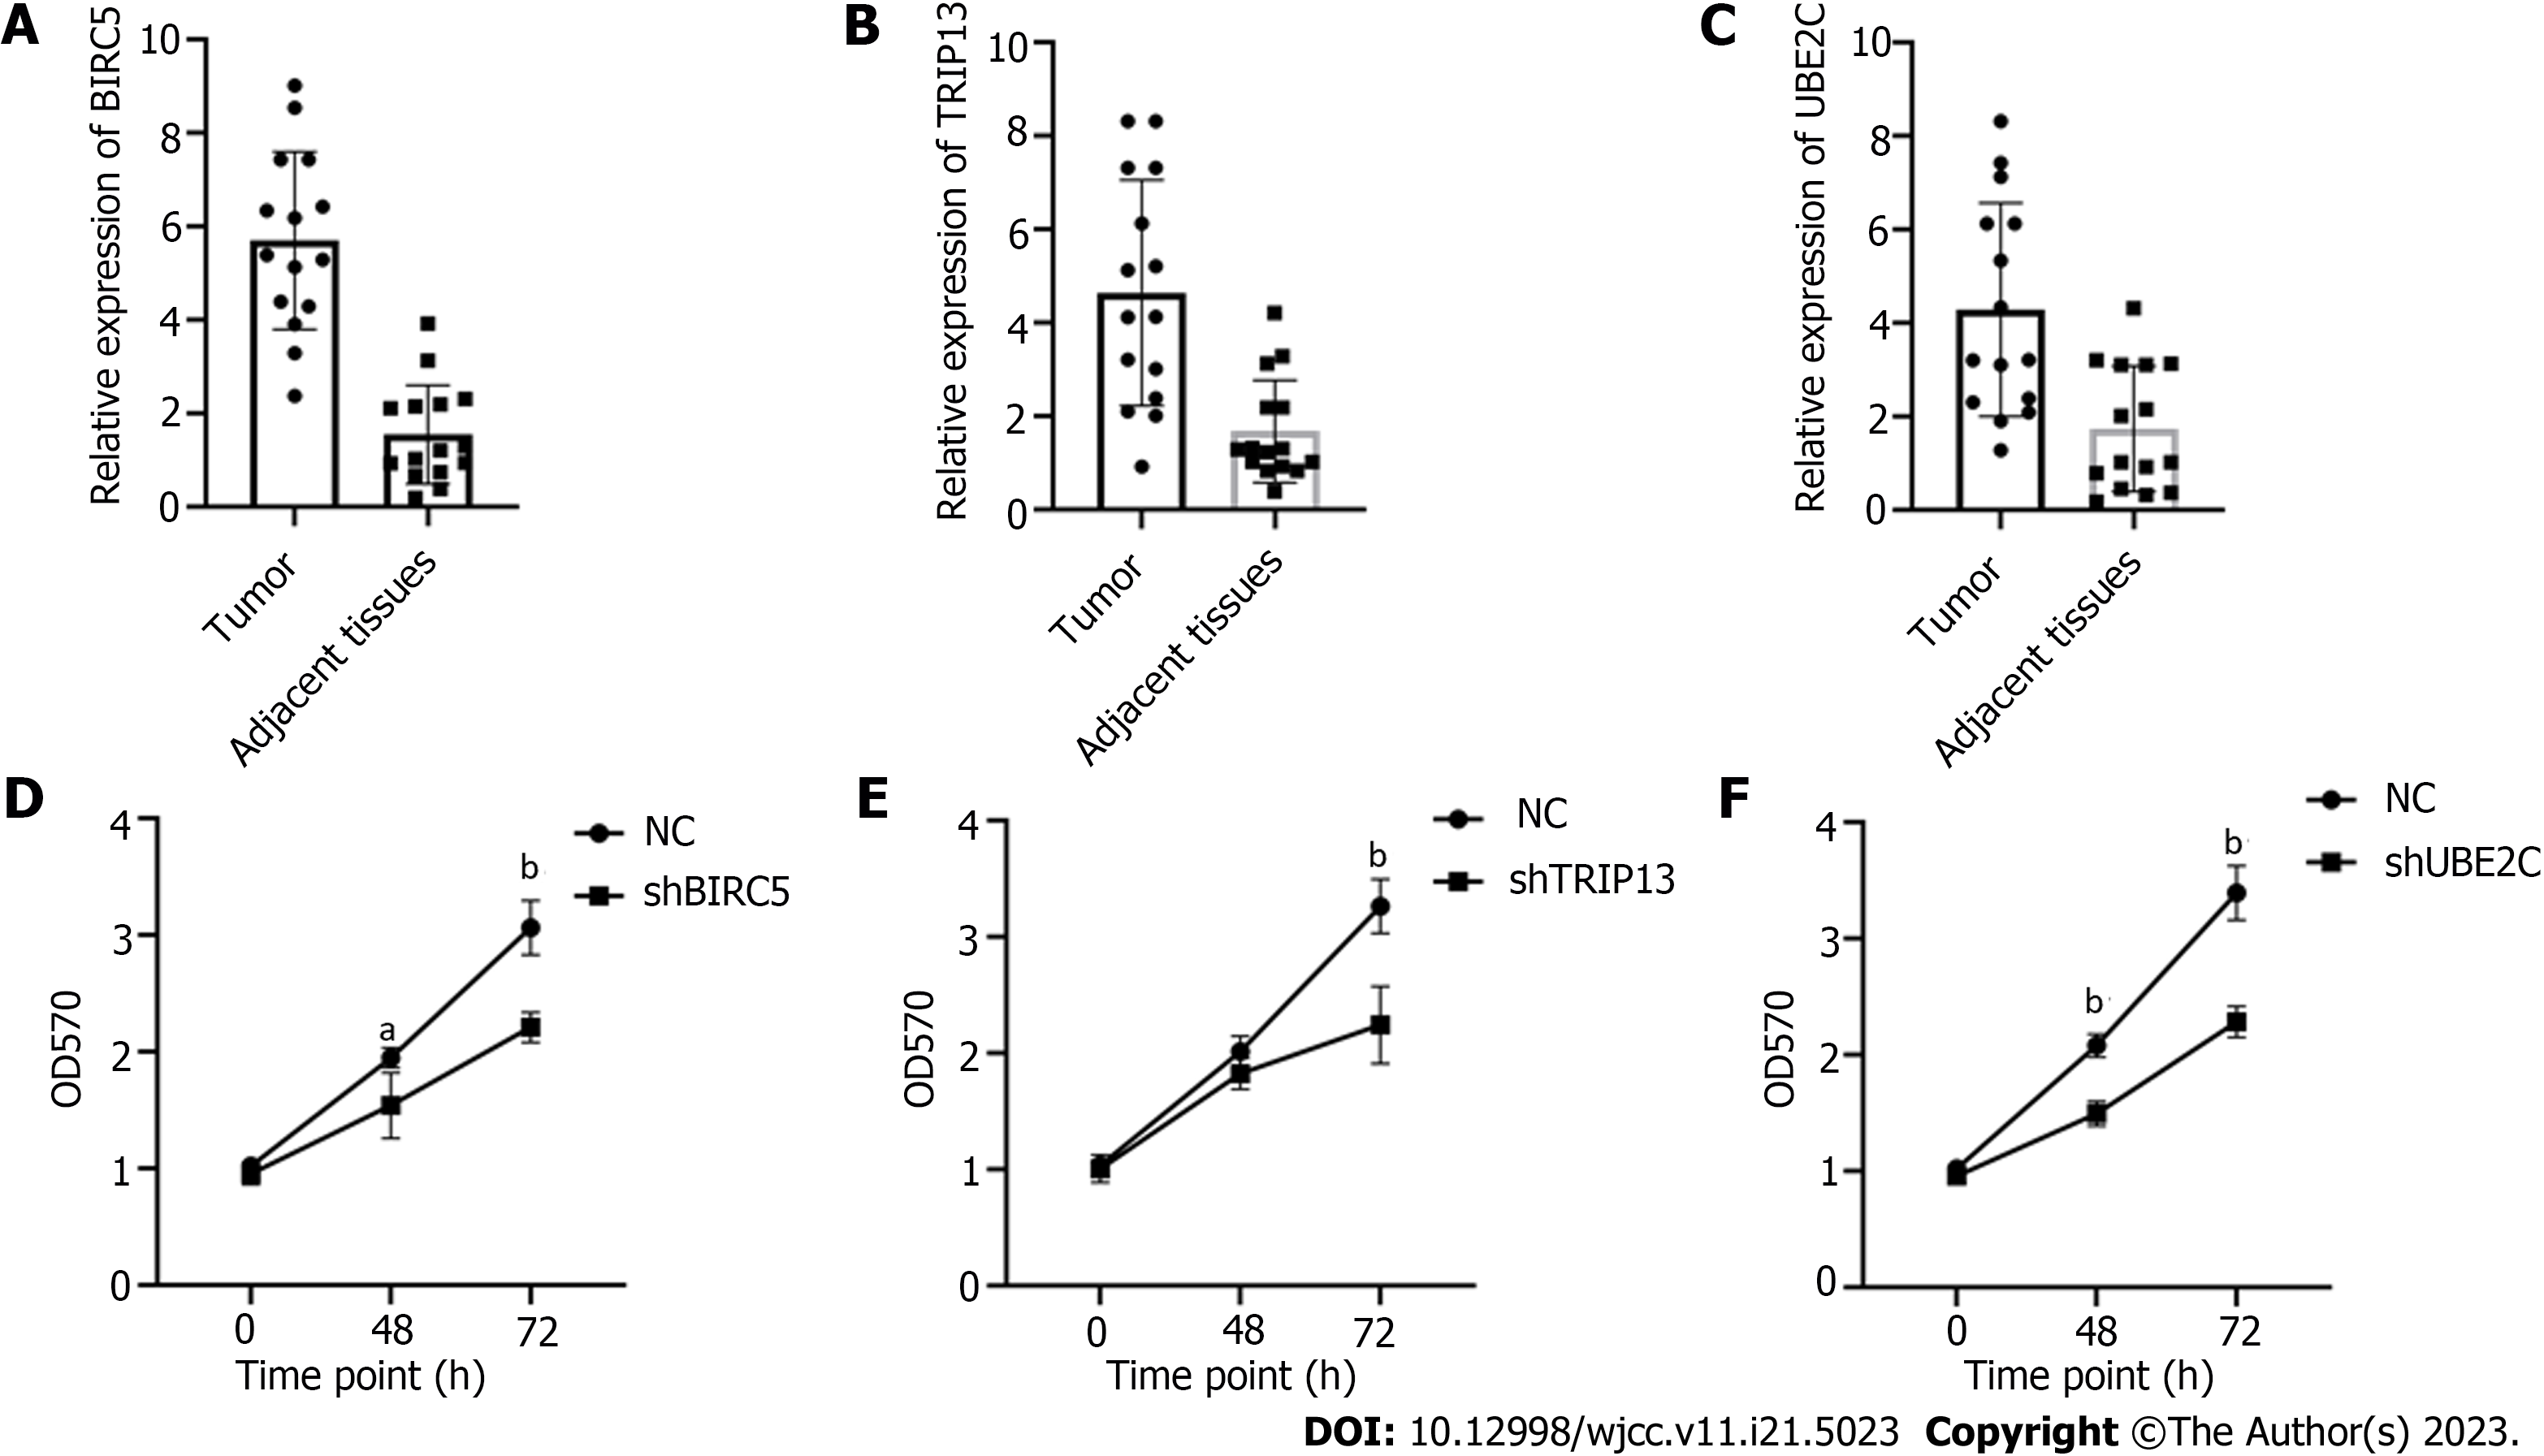
To validate the expression level of these potential genes in cancer tissues, we collected 15 pairs of GC tissues and adjacent normal tissues. Following RT-PCR assay, we found that BIRC5, TRIP13, and UBE2C were significantly upregulated in tumor tissues (Figure 6A-C), and these data showed that these genes may be used as biomarkers for GC. To investigate whether these genes exert key functions in cancer, we transfected specific shRNAs into GC cells. Using the CCK-8 assay, we observed that cell proliferation was significantly suppressed in BIRC5, TRIP13, or UBE2C knockdown cells, respectively (Figure 6D-F).
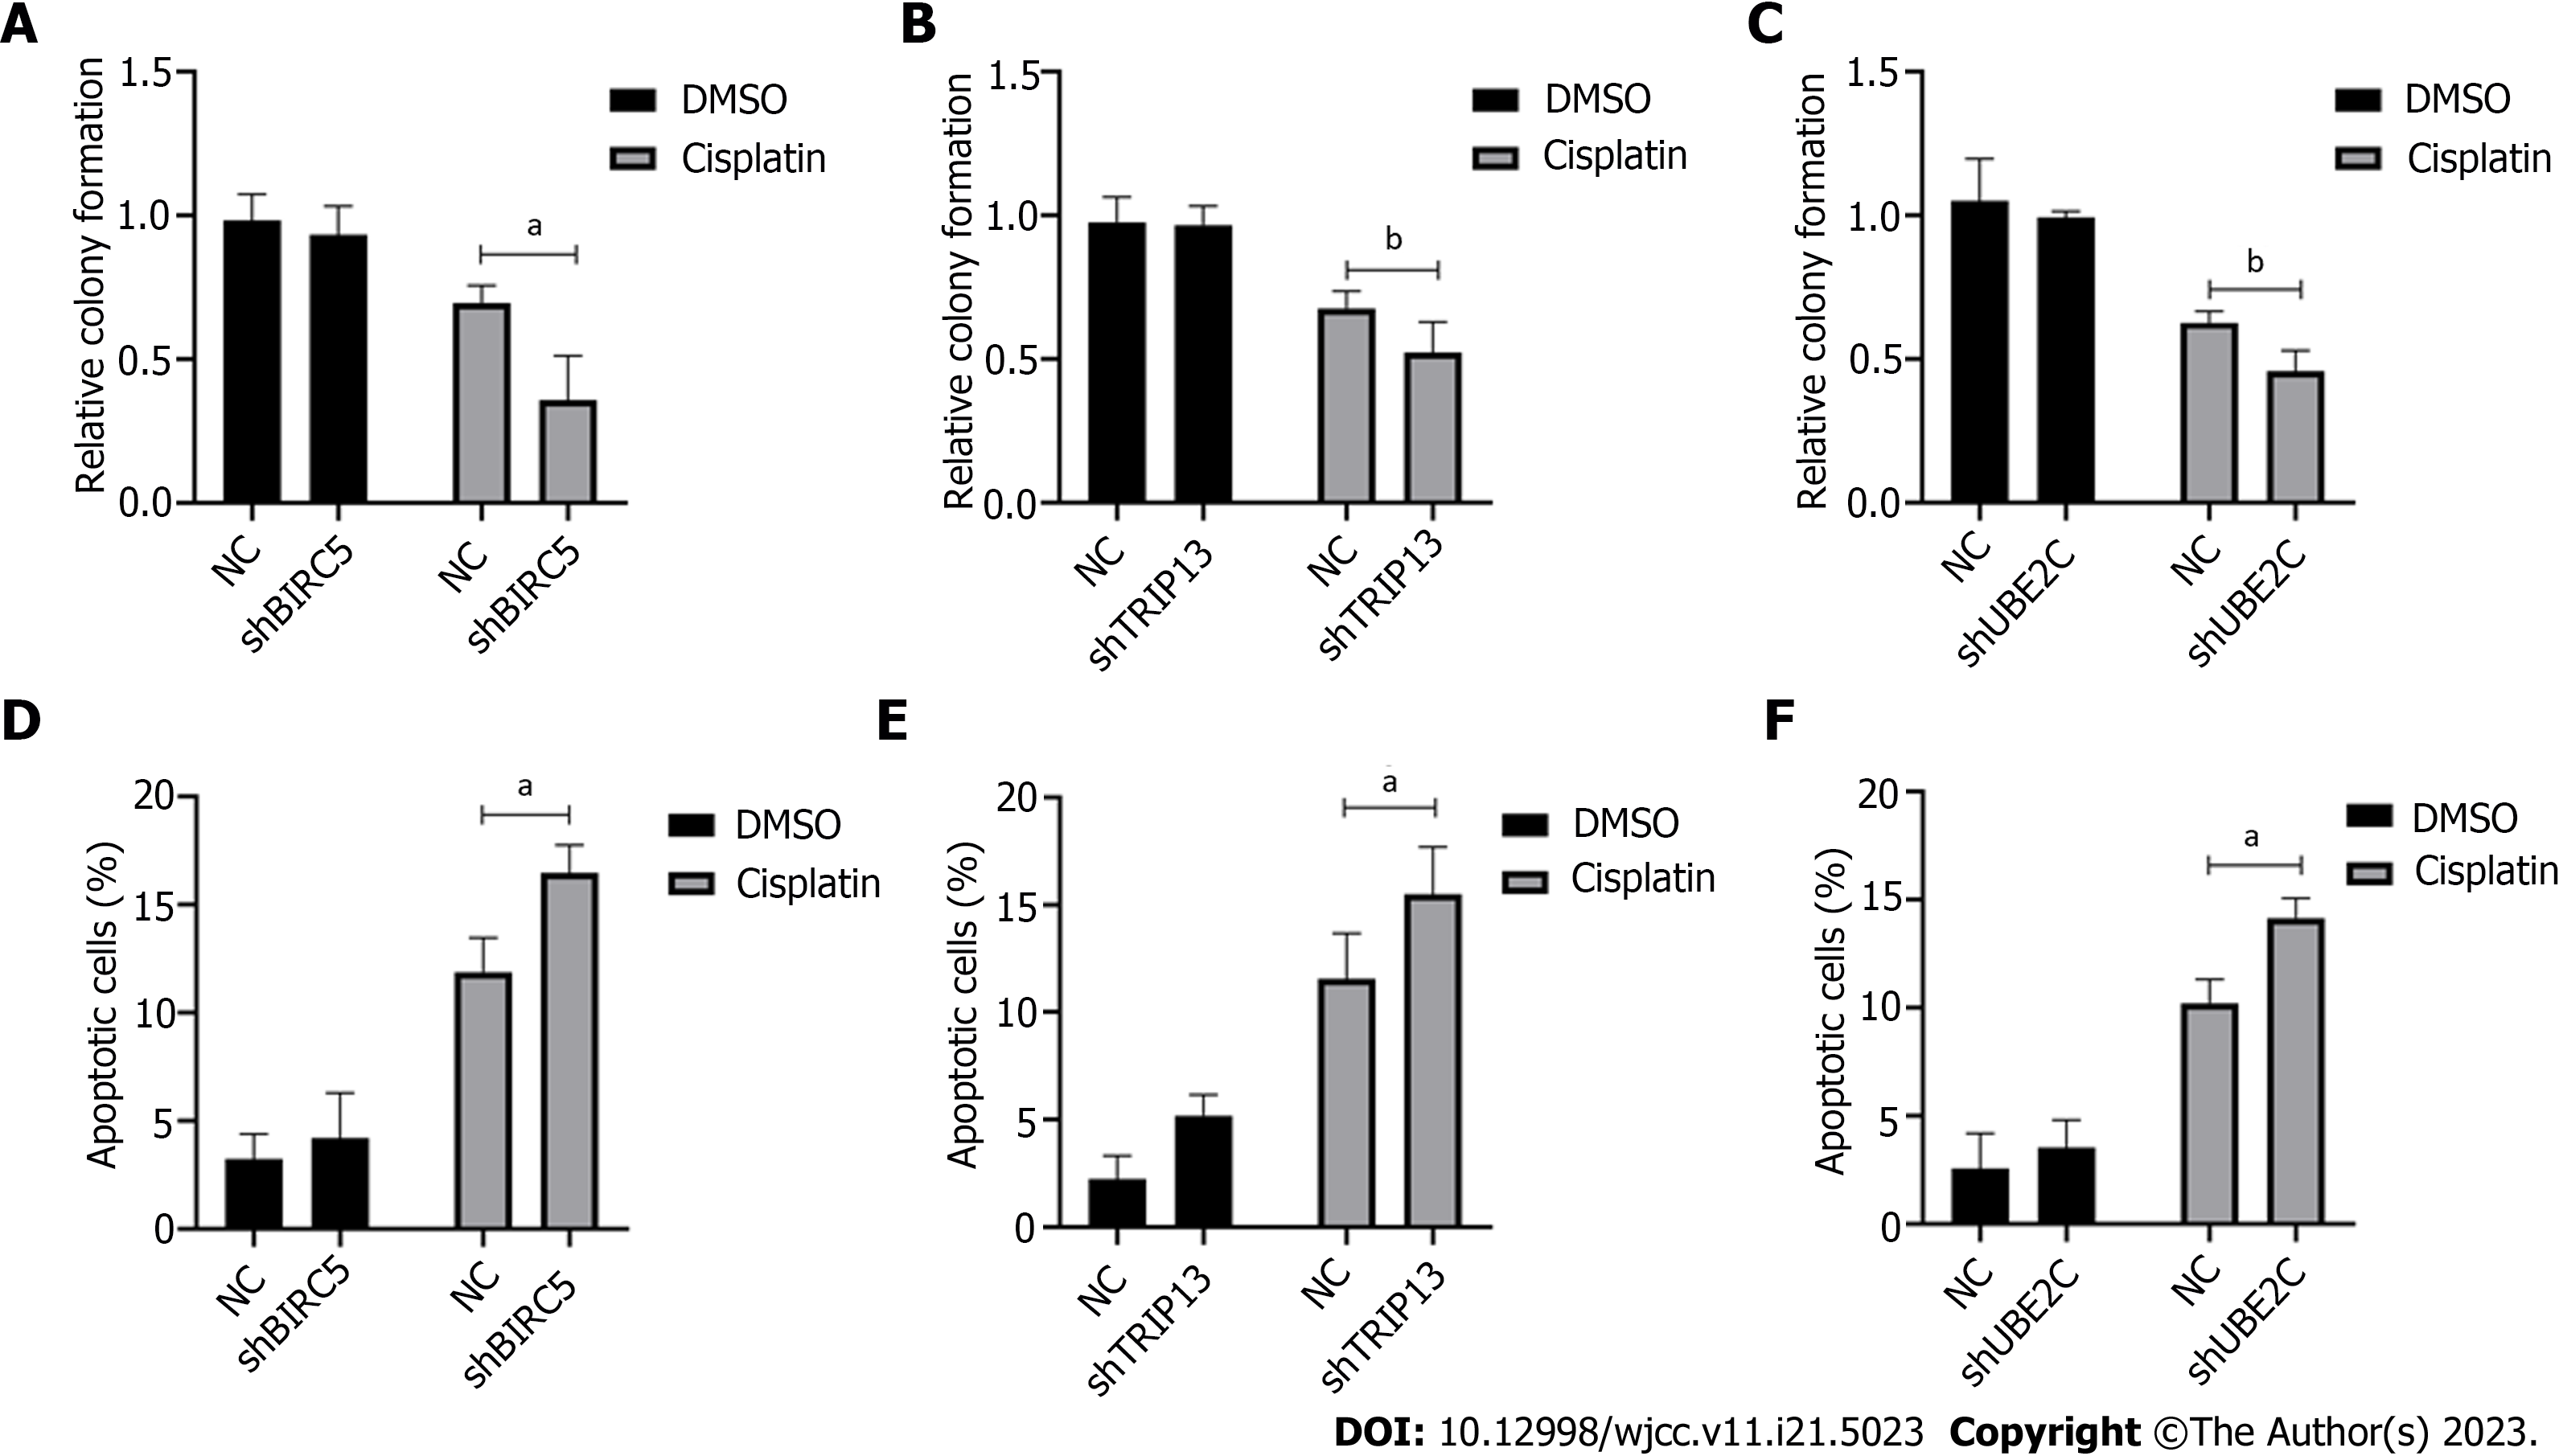
Cisplatin is one of the most frequent drugs currently used to treat GC. However, cisplatin resistance is an obstacle for successful therapy. We investigated whether these critical genes were related to cisplatin resistance. The cells with knockdown of each specific gene were treated with cisplatin. Cell survival fraction and apoptosis were then examined. Our data showed that knockdown of BIRC5, TRIP13 or UBE2C significantly inhibited the cell survival fraction after cisplatin treatment (Figure 7A-C). Knockdown of these genes also significantly increased cisplatin-induced cell apoptosis (Figure 7D-F). These data suggested that high regulation of BIRC5, TRIP13 or UBE2C genes is closely related to cell proliferation as well as cisplatin resistance, and could be used as a potential target for treating GC.
In the present research, in order to identify more core prognostic biomarkers in GC, we used bioinformatics methods based on three profile datasets (GSE13911, GSE66229, and GSE79973). Three hundred and forty-eight GC specimens and 141 normal specimens were included in this study. We discovered 251 changed DEGs (settings: |logFC| > 0.5 and adjusted P value < 0.05) including 64 up-regulated (logFC > 0) and 187 down-regulated DEGs (logFC < 0) using GEO2R and the Venn software platform. The GO and Pathway Enrichment Analysis using DAVID methods showed that: (1) For BP, up-regulated DEGs were particularly enriched in the regulation of nuclear chromosome segregation, sister chromatid segregation, cell division, cell cycle process, mitotic cell cycle process and down-regulated DEGs in organic acid catabolic process, carboxylic acid catabolic process, small molecule catabolic process, lipid modification, fatty acid catabolic process, and fatty acid oxidation; (2) for MF, up-regulated DEGs were enriched in identical protein binding, microtubule binding, enzyme binding, tubulin binding, cytoskeletal protein binding, protein kinase binding and down-regulated DEGs in cofactor binding, coenzyme binding, potassium channel regulator activity, ligand-gated ion channel activity, ligand-gated channel activity; and (3) for changes in CC, up-regulated DEGs were enriched in condensed chromosome kinetochore, condensed chromosome, centromeric region kinetochore, condensed chromosome, chromosome, centromeric region, and midbody, and down-regulated DEGs in mitochondrial matrix, mitochondrial part, mitochon
BUB1, which is from BUB (budding uninhibited by Benzimidazole) gene families, can encode proteins to form a large kinetochore-associated multi-protein complex. It has been suggested that altering BUB1 gene expression levels could disrupt its function, leading to aberrant chromosomal segregation. Stahl et al[18] indicated that tumors with a low frequency of BUB1 expression were associated with larger tumor size, higher incidence of lymph node metastases, distant metastases and higher UICC stage. Moreover, BUB1 expression was inversely correlated with the residual tumor stage. It was reported that the expression of BUB1 was also associated with taxane sensitivity in other types of cancer such as breast and esophageal cancer[19,20]. Furthermore, Kawakubo et al[21] found that BUB1 insufficiency leads to the lack of eNOS expression both in vitro and in vivo. They also revealed that there was a lack of eNOS expression in GC tissues with low BUBR1 expression.
Mitotic arrest deficient 2 (MAD2), is a key component of the mitotic spindle checkpoint pathway. It plays a vital role in maintaining spindle checkpoint function by generating special signals for monitoring the localization and segregation of chromosomes. Wang et al[22] also reported that the reduced expression of MAD2 resulted in a deficient mitotic checkpoint in several human cancers. Du et al[23] found that MAD2 interference could inhibit anticancer drug-induced apoptosis by up-regulating Bcl-2 and interfering with the mitochondria apoptosis pathway. Bargiela-Iparraguirre et al[24] demonstrated that depletion of MAD2 can delay Mcl-1 degradation, suggesting that exit to mitosis is delayed.
CCNB1 and CCNA2, which regulate cell progression via the G2/M transition during the cell cycle and encoded by related cyclin key genes, play significant roles in the G2/M phase. High levels of CCNA2[25] over-expression were detected in various cancers, including GC, non-small cell lung cancer and esophageal squamous cell carcinoma, resulting in uncontrolled cell growth. Up-regulation of CCNB1 expression was confirmed to promote the cell cycle in the G2/M phase, which was in line with poor survival in GC patients[26]. Moreover, Roncalli et al[27] indicated that CCNB1 arises in the cytoplasm of cells in S-phase, and is then transported to the nucleus at the G2/M transition where it is broken down during anaphase via a ubiquitin-dependent pathway. A recent study[28] showed that up-regulation of CCNA2 could be an indicator of pituitary adenoma invasiveness, as it played an essential role in monitoring protein in regulation of the cell cycle. Müssnich et al[29] found that downregulation of CCNA2 protein and mRNA levels decreased cell proliferation.
BIRC5, Baculoviral inhibitor of apoptosis repeat-containing 5, which is a well-known encoder of survivin, is a member of the inhibitor-of-apoptosis proteins (IAPs) family. During G2/M phase in tumor proliferating cells, BIRC5, located at 17q25, plays a key role in cell division, regulating cell apoptosis and the mitosis process. Several reports revealed that BIRC5 not only interacts with caspases but also enables the formation of the chromosomal passenger complex, which is vital for promoting mitosis[30-32]. Nabilsi et al[33] indicated that BIRC5 is related to sex hormones, and that overexpression of BIRC5 is associated with high levels of female sex hormones. Leung et al[34] reported that low expression of survivin may lead to a decrease in cell cycle function, which may result in the loss of related cells.
Based on patient survival analysis, we focused on three critical genes, including BIRC5, TRIP13, and UBE2C. It was found that these three genes were proved to play important roles in the progression of various cancers; however, our search of databases on these genes related to GC found only a few reports which suggested this correlation[35,36]. We also performed cell experiments and found that knockdown of these genes inhibited cell proliferation and reduced cellular resistance to cisplatin. Our findings provide novel targets for the treatment of GC.
In conclusion, exploring the molecular mechanism of GC via bioinformatics analysis showed that three DEGs (BIRC5, TRIP13, or UBE2C) play key roles in the progression of GC. Hub genes and key pathways of GC were identified using bioinformatics leading to a molecular link between the pathway and gene expression potentially involved in GC. The current study identified related genes and cellular pathways involved in the emergence and development of GC. However, certain limitations still existed due to the lack of cell experiments. Hence, further experimental studies should be carried out to confirm the expression and function of the identified genes at the molecular level, which will help to elucidate GC pathogenesis and identify novel biomarkers or drug targets for improved diagnostics and therapeutics for GC.
Gastric cancer (GC) is one of the most common cancers and has a poor prognosis. Treatment of GC has remained unchanged over the past few years. Genetic factors have been revealed to play an important role in susceptibility to GC. Significantly upregulated genes associated with poor prognosis were detected in GC using integrated bioinformatics methods.
In order to identify core prognostic biomarkers in GC, several databases were searched for GC-related genes as tumor markers, and cellular tests were performed to confirm the results.
Bioinformatics analysis of the molecular mechanism involved in GC revealed that three differentially expressed genes (DEGs) (BIRC5, TRIP13, or UBE2C) play critical roles in the progression of GC. Bioinformatics were used to identify hub genes and important pathways in GC, resulting in a biological relationship between the pathways and gene expression likely involved in GC.
In the theoretical analysis, microarray data information, data processing of DEGs, Gene Ontology and pathway enrichment analysis, PPI network and module analysis, and survival analysis were used. In the cellular experiments, RNA sequencing expression of core genes, patient samples and RT-PCR detection, cells and transfection, CCK-8 assay, apoptosis assay, colony formation assay, and statistical analysis were used.
Three hundred and forty-eight GC tissues and 141 normal tissues were analyzed; 251 DEGs were identified including 187 down-regulated genes and 64 up-regulated genes. We found that knockdown of BIRC5, TRIP13, or UBE2C significantly inhibited cell proliferation and induced cell apoptosis. Knockdown of BIRC5, TRIP13, or UBE2C increased cellular sensitivity to cisplatin.
The molecular mechanism of GC, via bioinformatics analysis, showed that three DEGs (BIRC5, TRIP13, or UBE2C) played key roles in the progression of GC. These findings will help to elucidate GC pathogenesis and identify novel biomarkers or drug targets for improved diagnostics and therapeutics for GC.
Bioinformatics was used to identify hub genes and important pathways in GC, resulting in a biological relationship between the pathways and gene expression likely involved in the progression of GC. Bioinformatics analysis revealed the relevant genes and cellular pathways involved in the genesis and development of GC.
We are grateful to Dr. Qingqiang Xu from Naval Medical University for kind discussions.
| 1. | Ferlay J, Soerjomataram I, Dikshit R, Eser S, Mathers C, Rebelo M, Parkin DM, Forman D, Bray F. Cancer incidence and mortality worldwide: sources, methods and major patterns in GLOBOCAN 2012. Int J Cancer. 2015;136:E359-E386. [RCA] [PubMed] [DOI] [Full Text] [Cited by in Crossref: 20108] [Cited by in RCA: 20715] [Article Influence: 1883.2] [Reference Citation Analysis (23)] |
| 2. | Huang L, Hu C, Cao H, Wu X, Wang R, Lu H, Li H, Chen H. MicroRNA-29c Increases the Chemosensitivity of Pancreatic Cancer Cells by Inhibiting USP22 Mediated Autophagy. Cell Physiol Biochem. 2018;47:747-758. [RCA] [PubMed] [DOI] [Full Text] [Cited by in Crossref: 42] [Cited by in RCA: 65] [Article Influence: 8.1] [Reference Citation Analysis (0)] |
| 3. | Chen F, Hu SJ. Effect of microRNA-34a in cell cycle, differentiation, and apoptosis: a review. J Biochem Mol Toxicol. 2012;26:79-86. [RCA] [PubMed] [DOI] [Full Text] [Cited by in Crossref: 124] [Cited by in RCA: 149] [Article Influence: 9.9] [Reference Citation Analysis (0)] |
| 4. | Kim TH, Dekker J. ChIP-chip. Cold Spring Harb Protoc. 2018;2018. [RCA] [PubMed] [DOI] [Full Text] [Cited by in Crossref: 6] [Cited by in RCA: 8] [Article Influence: 1.0] [Reference Citation Analysis (0)] |
| 5. | Chen S, Wei Y, Liu H, Gong Y, Zhou Y, Yang H, Tang L. Analysis of Collagen type X alpha 1 (COL10A1) expression and prognostic significance in gastric cancer based on bioinformatics. Bioengineered. 2021;12:127-137. [RCA] [PubMed] [DOI] [Full Text] [Full Text (PDF)] [Cited by in Crossref: 14] [Cited by in RCA: 45] [Article Influence: 7.5] [Reference Citation Analysis (0)] |
| 6. | Fang J, Ge X, Xu W, Xie J, Qin Z, Shi L, Yin W, Bian M, Wang H. Bioinformatics analysis of the prognosis and biological significance of HMGB1, HMGB2, and HMGB3 in gastric cancer. J Cell Physiol. 2020;235:3438-3446. [RCA] [PubMed] [DOI] [Full Text] [Cited by in Crossref: 22] [Cited by in RCA: 43] [Article Influence: 6.1] [Reference Citation Analysis (0)] |
| 7. | Patel TH, Cecchini M. Targeted Therapies in Advanced Gastric Cancer. Curr Treat Options Oncol. 2020;21:70. [RCA] [PubMed] [DOI] [Full Text] [Cited by in Crossref: 47] [Cited by in RCA: 183] [Article Influence: 30.5] [Reference Citation Analysis (0)] |
| 8. | Lou S, Meng F, Yin X, Zhang Y, Han B, Xue Y. Comprehensive Characterization of RNA Processing Factors in Gastric Cancer Identifies a Prognostic Signature for Predicting Clinical Outcomes and Therapeutic Responses. Front Immunol. 2021;12:719628. [RCA] [PubMed] [DOI] [Full Text] [Full Text (PDF)] [Cited by in Crossref: 6] [Cited by in RCA: 24] [Article Influence: 4.8] [Reference Citation Analysis (0)] |
| 9. | Davis S, Meltzer PS. GEOquery: a bridge between the Gene Expression Omnibus (GEO) and BioConductor. Bioinformatics. 2007;23:1846-1847. [RCA] [PubMed] [DOI] [Full Text] [Cited by in Crossref: 1224] [Cited by in RCA: 2118] [Article Influence: 111.5] [Reference Citation Analysis (0)] |
| 10. | Ashburner M, Ball CA, Blake JA, Botstein D, Butler H, Cherry JM, Davis AP, Dolinski K, Dwight SS, Eppig JT, Harris MA, Hill DP, Issel-Tarver L, Kasarskis A, Lewis S, Matese JC, Richardson JE, Ringwald M, Rubin GM, Sherlock G. Gene ontology: tool for the unification of biology. The Gene Ontology Consortium. Nat Genet. 2000;25:25-29. [RCA] [PubMed] [DOI] [Full Text] [Cited by in Crossref: 29963] [Cited by in RCA: 30166] [Article Influence: 1160.2] [Reference Citation Analysis (1)] |
| 11. | Ogata H, Goto S, Sato K, Fujibuchi W, Bono H, Kanehisa M. KEGG: Kyoto Encyclopedia of Genes and Genomes. Nucleic Acids Res. 1999;27:29-34. [RCA] [PubMed] [DOI] [Full Text] [Cited by in Crossref: 3237] [Cited by in RCA: 3853] [Article Influence: 142.7] [Reference Citation Analysis (0)] |
| 12. | Huang da W, Sherman BT, Lempicki RA. Systematic and integrative analysis of large gene lists using DAVID bioinformatics resources. Nat Protoc. 2009;4:44-57. [RCA] [PubMed] [DOI] [Full Text] [Cited by in Crossref: 24735] [Cited by in RCA: 28578] [Article Influence: 1681.1] [Reference Citation Analysis (0)] |
| 13. | Szklarczyk D, Franceschini A, Wyder S, Forslund K, Heller D, Huerta-Cepas J, Simonovic M, Roth A, Santos A, Tsafou KP, Kuhn M, Bork P, Jensen LJ, von Mering C. STRING v10: protein-protein interaction networks, integrated over the tree of life. Nucleic Acids Res. 2015;43:D447-D452. [RCA] [PubMed] [DOI] [Full Text] [Full Text (PDF)] [Cited by in Crossref: 6477] [Cited by in RCA: 7816] [Article Influence: 651.3] [Reference Citation Analysis (0)] |
| 14. | Krispel CM, Chen CK, Simon MI, Burns ME. Prolonged photoresponses and defective adaptation in rods of Gbeta5-/- mice. J Neurosci. 2003;23:6965-6971. [PubMed] |
| 15. | Szász AM, Lánczky A, Nagy Á, Förster S, Hark K, Green JE, Boussioutas A, Busuttil R, Szabó A, Győrffy B. Cross-validation of survival associated biomarkers in gastric cancer using transcriptomic data of 1,065 patients. Oncotarget. 2016;7:49322-49333. [RCA] [PubMed] [DOI] [Full Text] [Full Text (PDF)] [Cited by in Crossref: 582] [Cited by in RCA: 765] [Article Influence: 95.6] [Reference Citation Analysis (0)] |
| 16. | Tang Z, Li C, Kang B, Gao G, Zhang Z. GEPIA: a web server for cancer and normal gene expression profiling and interactive analyses. Nucleic Acids Res. 2017;45:W98-W102. [RCA] [PubMed] [DOI] [Full Text] [Full Text (PDF)] [Cited by in Crossref: 5550] [Cited by in RCA: 7432] [Article Influence: 825.8] [Reference Citation Analysis (1)] |
| 17. | Fisher RA. On the Interpretation of χ2 from Contingency Tables, and the Calculation of P. J Royal Stat Soc. 1922;85:87-94. [DOI] [Full Text] |
| 18. | Stahl D, Braun M, Gentles AJ, Lingohr P, Walter A, Kristiansen G, Gütgemann I. Low BUB1 expression is an adverse prognostic marker in gastric adenocarcinoma. Oncotarget. 2017;8:76329-76339. [RCA] [PubMed] [DOI] [Full Text] [Full Text (PDF)] [Cited by in Crossref: 16] [Cited by in RCA: 27] [Article Influence: 3.0] [Reference Citation Analysis (0)] |
| 19. | McGrogan BT, Gilmartin B, Carney DN, McCann A. Taxanes, microtubules and chemoresistant breast cancer. Biochim Biophys Acta. 2008;1785:96-132. [RCA] [PubMed] [DOI] [Full Text] [Cited by in Crossref: 99] [Cited by in RCA: 233] [Article Influence: 12.3] [Reference Citation Analysis (0)] |
| 20. | Tanaka K, Mohri Y, Ohi M, Yokoe T, Koike Y, Morimoto Y, Miki C, Tonouchi H, Kusunoki M. Mitotic checkpoint genes, hsMAD2 and BubR1, in oesophageal squamous cancer cells and their association with 5-fluorouracil and cisplatin-based radiochemotherapy. Clin Oncol (R Coll Radiol). 2008;20:639-646. [RCA] [PubMed] [DOI] [Full Text] [Cited by in Crossref: 19] [Cited by in RCA: 22] [Article Influence: 1.2] [Reference Citation Analysis (0)] |
| 21. | Kawakubo E, Matsumoto T, Yoshiya K, Yamashita S, Jogo T, Saeki H, Oki E, Furuyama T, Oda Y, Maehara Y. BUBR1 Insufficiency Is Correlated with eNOS Reduction Experimentally In Vitro and In Vivo, and in Gastric Cancer Tissue. Anticancer Res. 2018;38:6099-6106. [RCA] [PubMed] [DOI] [Full Text] [Cited by in Crossref: 2] [Cited by in RCA: 5] [Article Influence: 0.6] [Reference Citation Analysis (0)] |
| 22. | Wang X, Jin DY, Ng RW, Feng H, Wong YC, Cheung AL, Tsao SW. Significance of MAD2 expression to mitotic checkpoint control in ovarian cancer cells. Cancer Res. 2002;62:1662-1668. [PubMed] |
| 23. | Du Y, Yin F, Liu C, Hu S, Wang J, Xie H, Hong L, Fan D. Depression of MAD2 inhibits apoptosis of gastric cancer cells by upregulating Bcl-2 and interfering mitochondrion pathway. Biochem Biophys Res Commun. 2006;345:1092-1098. [RCA] [PubMed] [DOI] [Full Text] [Cited by in Crossref: 24] [Cited by in RCA: 25] [Article Influence: 1.3] [Reference Citation Analysis (0)] |
| 24. | Bargiela-Iparraguirre J, Prado-Marchal L, Pajuelo-Lozano N, Jiménez B, Perona R, Sánchez-Pérez I. Mad2 and BubR1 modulates tumourigenesis and paclitaxel response in MKN45 gastric cancer cells. Cell Cycle. 2014;13:3590-3601. [RCA] [PubMed] [DOI] [Full Text] [Cited by in Crossref: 36] [Cited by in RCA: 45] [Article Influence: 4.1] [Reference Citation Analysis (0)] |
| 25. | Yasuda M, Takesue F, Inutsuka S, Honda M, Nozoe T, Korenaga D. Overexpression of cyclin B1 in gastric cancer and its clinicopathological significance: an immunohistological study. J Cancer Res Clin Oncol. 2002;128:412-416. [RCA] [PubMed] [DOI] [Full Text] [Full Text (PDF)] [Cited by in Crossref: 44] [Cited by in RCA: 46] [Article Influence: 1.9] [Reference Citation Analysis (0)] |
| 26. | Shi Q, Wang W, Jia Z, Chen P, Ma K, Zhou C. ISL1, a novel regulator of CCNB1, CCNB2 and c-MYC genes, promotes gastric cancer cell proliferation and tumor growth. Oncotarget. 2016;7:36489-36500. [RCA] [PubMed] [DOI] [Full Text] [Full Text (PDF)] [Cited by in Crossref: 40] [Cited by in RCA: 63] [Article Influence: 7.0] [Reference Citation Analysis (0)] |
| 27. | Roncalli M, Bosari S, Marchetti A, Buttitta F, Bossi P, Graziani D, Peracchia A, Bonavina L, Viale G, Coggi G. Cell cycle-related gene abnormalities and product expression in esophageal carcinoma. Lab Invest. 1998;78:1049-1057. [PubMed] |
| 28. | Zhao P, Zhang P, Hu W, Wang H, Yu G, Wang Z, Li C, Bai J, Zhang Y. Upregulation of cyclin B1 plays potential roles in the invasiveness of pituitary adenomas. J Clin Neurosci. 2017;43:267-273. [RCA] [PubMed] [DOI] [Full Text] [Cited by in Crossref: 11] [Cited by in RCA: 20] [Article Influence: 2.2] [Reference Citation Analysis (1)] |
| 29. | Müssnich P, Raverot G, Jaffrain-Rea ML, Fraggetta F, Wierinckx A, Trouillas J, Fusco A, D'Angelo D. Downregulation of miR-410 targeting the cyclin B1 gene plays a role in pituitary gonadotroph tumors. Cell Cycle. 2015;14:2590-2597. [RCA] [PubMed] [DOI] [Full Text] [Cited by in Crossref: 36] [Cited by in RCA: 42] [Article Influence: 3.8] [Reference Citation Analysis (0)] |
| 30. | Shin S, Sung BJ, Cho YS, Kim HJ, Ha NC, Hwang JI, Chung CW, Jung YK, Oh BH. An anti-apoptotic protein human survivin is a direct inhibitor of caspase-3 and -7. Biochemistry. 2001;40:1117-1123. [RCA] [PubMed] [DOI] [Full Text] [Cited by in Crossref: 510] [Cited by in RCA: 532] [Article Influence: 21.3] [Reference Citation Analysis (0)] |
| 31. | Tamm I, Wang Y, Sausville E, Scudiero DA, Vigna N, Oltersdorf T, Reed JC. IAP-family protein survivin inhibits caspase activity and apoptosis induced by Fas (CD95), Bax, caspases, and anticancer drugs. Cancer Res. 1998;58:5315-5320. [PubMed] |
| 32. | Rosa J, Canovas P, Islam A, Altieri DC, Doxsey SJ. Survivin modulates microtubule dynamics and nucleation throughout the cell cycle. Mol Biol Cell. 2006;17:1483-1493. [RCA] [PubMed] [DOI] [Full Text] [Cited by in Crossref: 106] [Cited by in RCA: 121] [Article Influence: 6.1] [Reference Citation Analysis (0)] |
| 33. | Nabilsi NH, Broaddus RR, McCampbell AS, Lu KH, Lynch HT, Chen LM, Loose DS. Sex hormone regulation of survivin gene expression. J Endocrinol. 2010;207:237-243. [RCA] [PubMed] [DOI] [Full Text] [Full Text (PDF)] [Cited by in Crossref: 22] [Cited by in RCA: 20] [Article Influence: 1.3] [Reference Citation Analysis (0)] |
| 34. | Leung CG, Xu Y, Mularski B, Liu H, Gurbuxani S, Crispino JD. Requirements for survivin in terminal differentiation of erythroid cells and maintenance of hematopoietic stem and progenitor cells. J Exp Med. 2007;204:1603-1611. [RCA] [PubMed] [DOI] [Full Text] [Full Text (PDF)] [Cited by in Crossref: 83] [Cited by in RCA: 87] [Article Influence: 4.6] [Reference Citation Analysis (0)] |
| 35. | Wang Y, Huang F, Liu M, Zhao Q. UBE2C mRNA expression controlled by miR-300 and HuR determines its oncogenic role in gastric cancer. Biochem Biophys Res Commun. 2021;534:597-603. [RCA] [PubMed] [DOI] [Full Text] [Cited by in Crossref: 5] [Cited by in RCA: 14] [Article Influence: 2.3] [Reference Citation Analysis (0)] |
| 36. | Carino A, Graziosi L, Marchianò S, Biagioli M, Marino E, Sepe V, Zampella A, Distrutti E, Donini A, Fiorucci S. Analysis of Gastric Cancer Transcriptome Allows the Identification of Histotype Specific Molecular Signatures With Prognostic Potential. Front Oncol. 2021;11:663771. [RCA] [PubMed] [DOI] [Full Text] [Full Text (PDF)] [Cited by in Crossref: 6] [Cited by in RCA: 22] [Article Influence: 4.4] [Reference Citation Analysis (0)] |
Open-Access: This article is an open-access article that was selected by an in-house editor and fully peer-reviewed by external reviewers. It is distributed in accordance with the Creative Commons Attribution NonCommercial (CC BY-NC 4.0) license, which permits others to distribute, remix, adapt, build upon this work non-commercially, and license their derivative works on different terms, provided the original work is properly cited and the use is non-commercial. See: https://creativecommons.org/Licenses/by-nc/4.0/
Provenance and peer review: Unsolicited article; Externally peer reviewed.
Peer-review model: Single blind
Specialty type: Gastroenterology and hepatology
Country/Territory of origin: China
Peer-review report’s scientific quality classification
Grade A (Excellent): 0
Grade B (Very good): B, B
Grade C (Good): 0
Grade D (Fair): 0
Grade E (Poor): 0
P-Reviewer: Matsumoto K, Japan; Shah OJ, India S-Editor: Chen YL L-Editor: Webster JR P-Editor: Cai YX


