Published online May 26, 2022. doi: 10.12998/wjcc.v10.i15.4737
Peer-review started: September 13, 2021
First decision: January 23, 2022
Revised: February 2, 2022
Accepted: April 2, 2022
Article in press: April 2, 2022
Published online: May 26, 2022
Processing time: 253 Days and 0.9 Hours
Metabolic reprogramming is a feature of tumour cells and is essential to support their rapid proliferation. The glycolytic activity of liver cancer cells is significantly higher than that of normal liver cells, and the rapidly proliferating tumour cells are powered by aerobic glycolysis. Lipid metabolism reprogramming enables tumour cells to meet their needs for highly proliferative growth and is an important driving force for the development of hepatocellular carcinoma (HCC).
To explore the influence of different metabolic subtypes of HCC and analyse their significance in guiding prognosis and treatment based on the molecular mechanism of glycolysis and fatty acid oxidation (FAO).
By downloading related data from public databases including the Cancer Genome Atlas (TCGA), the Molecular Signatures Database, and International Cancer Genome Consortium, we utilised unsupervised consensus clustering to divide TCGA Liver Hepatocellular Carcinoma samples into four metabolic subgroups and compared single nucleotide polymorphism, copy number variation, tumour microenvironment, and Genomics of Drug Sensitivity in Cancer and Tumour Immune Dysfunction and Exclusion between different metabolites. The differences and causes of survival and the clinical characteristics between them were analysed, and a prognostic model was established based on glycolysis and FAO genes. Combined with the clinical features, a Norman diagram was created to compare the pros and cons of each model.
In the four metabolic subgroups, with the increase in glycolytic expression, the median survival of patients showed the worst results, while FAO showed the best. When comparing the follow-up analysis of each group, we considered that the differences between them might be related to reactive oxygen species, somatic copy number variation of key genes, and immune microenvironment. It was also found that the FAO group and the low-risk group had better efficacy and response to immune checkpoint blockade treatment and anti-tumour drugs.
There are obvious differences in genes, chromosomes, and clinical characteristics between metabolic subgroups. The establishment of a prognostic model could predict patient prognosis and guide clinical treatment.
Core Tip: Through cluster analysis, we divided liver cancer samples into four subgroups and compared survival and molecular biological differences between different subtypes. The median survival of the fatty acid oxidation group was significantly better than that of the glycolytic group. We used Lasso regression to reduce dimensionality and selected RAE1 and CTNNB1 for modelling. We found that the model can identify patients with a better response to anti-cancer drugs, such as Sorafenib and Paclitaxel, which can also guide clinical treatment.
- Citation: Zou JY, Huang YJ, He J, Tang ZX, Qin L. Glycolytic and fatty acid oxidation genes affect the treatment and prognosis of liver cancer. World J Clin Cases 2022; 10(15): 4737-4760
- URL: https://www.wjgnet.com/2307-8960/full/v10/i15/4737.htm
- DOI: https://dx.doi.org/10.12998/wjcc.v10.i15.4737
Hepatocellular carcinoma (HCC) is the most common type of primary liver cancer, closely related to hepatitis B virus infection, alcohol, and eating aflatoxin-contaminated food[1]. However, early diagnosis of liver cancer has always been difficult because the symptoms are not obvious. There are no particularly effective anti-cancer drugs associated with HCC. As the second leading cause of cancer deaths worldwide[2,3], HCC is highly malignant and seriously threatens human health. In order to meet their own growth needs, tumour cells will change their metabolic pathways, involving glycolysis, fatty acid synthesis, oxidation, etc[4]. Thus, the study of metabolic reprogramming can help us eliminate tumour cells in a more targeted manner and provide new treatment ideas[5,6].
Compared with normal liver tissues, the glycolytic metabolic pathways in liver cancer cells are more active, and Otto Warburg believes that aerobic glycolysis powers the rapid growth of tumours[7]. Changes in lipid metabolism are vital to tumour metabolic reprogramming[8], with fatty acids an important source of cell energy and the main source of signal molecules for cell membrane synthesis[9,10]. Fatty acid oxidation (FAO) and fatty acid synthesis work together to maintain the balance of cell fatty acid content[11]. However, in order to meet the needs of high replication and growth in malignant tumour cells, FAO is inhibited and lipid accumulation is promoted.
The molecular classification of HCC used to guide targeted therapy lags behind other tumours and cannot provide an individualised treatment plan. By studying metabolic reprogramming, we can provide patients with more appropriate and individualised clinical treatment models based on the metabolic and molecular characteristics of HCC and targeted use of anti-cancer drugs and immunosuppressive therapy [immune checkpoint blockade (ICB) therapies]. Therefore, we conducted this study to investigate the molecular and clinical features of metabolic subtypes to establish a prognostic model and analyse the sensitivity of different subtypes to ICB and common clinical drugs to guide clinical treatment.
We downloaded the following related gene sets with different metabolic pathways: From The Molecular Signatures Database (https://www.gsea-msigdb.org/gsea/msigdb/index.jsp): 'REACTOME_ GLYCOLYSIS' (72) and 'WP_FATTY_ACID_BETA_OXIDATION' (34) as genes related to glycolysis and FAO; data sets containing genes related to different enrichment pathways: c2.cp.kegg.v7.4.symbols.gmt and c5.go.v7.4.symbols.gmt.
From The Cancer Genome Atlas website (TCGA, https://cancergenome.nih.gov/): TCGA-Liver Hepatocellular Carcinoma (LIHC) mRNA transcriptome data and corresponding clinical information; TCGA-LIHC single nucleotide polymorphism (SNP) data (TCGA-LIHC, data type: Annotated somatic mutation; workflow type: Varscan2 annotation).
From Broad Genome Data Analysis Center Firehose, (Broad GDAC Firehose, broadinstitute.org): Hg19 version of TCGA-LIHC data from.
From International Cancer Genome Consortium (https://dcc.icgc.org/) External verification data set: LIRI-JP.
We used the R language' ConsensusClusterPlus (36) v1.38' package to perform cluster analysis on two gene sets ['REACTOME_GLYCOLYSIS' (n = 72) and 'WP_FATTY_ACID_BETA_OXIDATION' (n = 34)]. Among the 100 samples taken, the sampling probability of the column dimension was 0.8, the sampling probability of the row dimension was 1, and ward.D2 served as the internal and final link function. Spearman was used as a distance measure, K = 3.
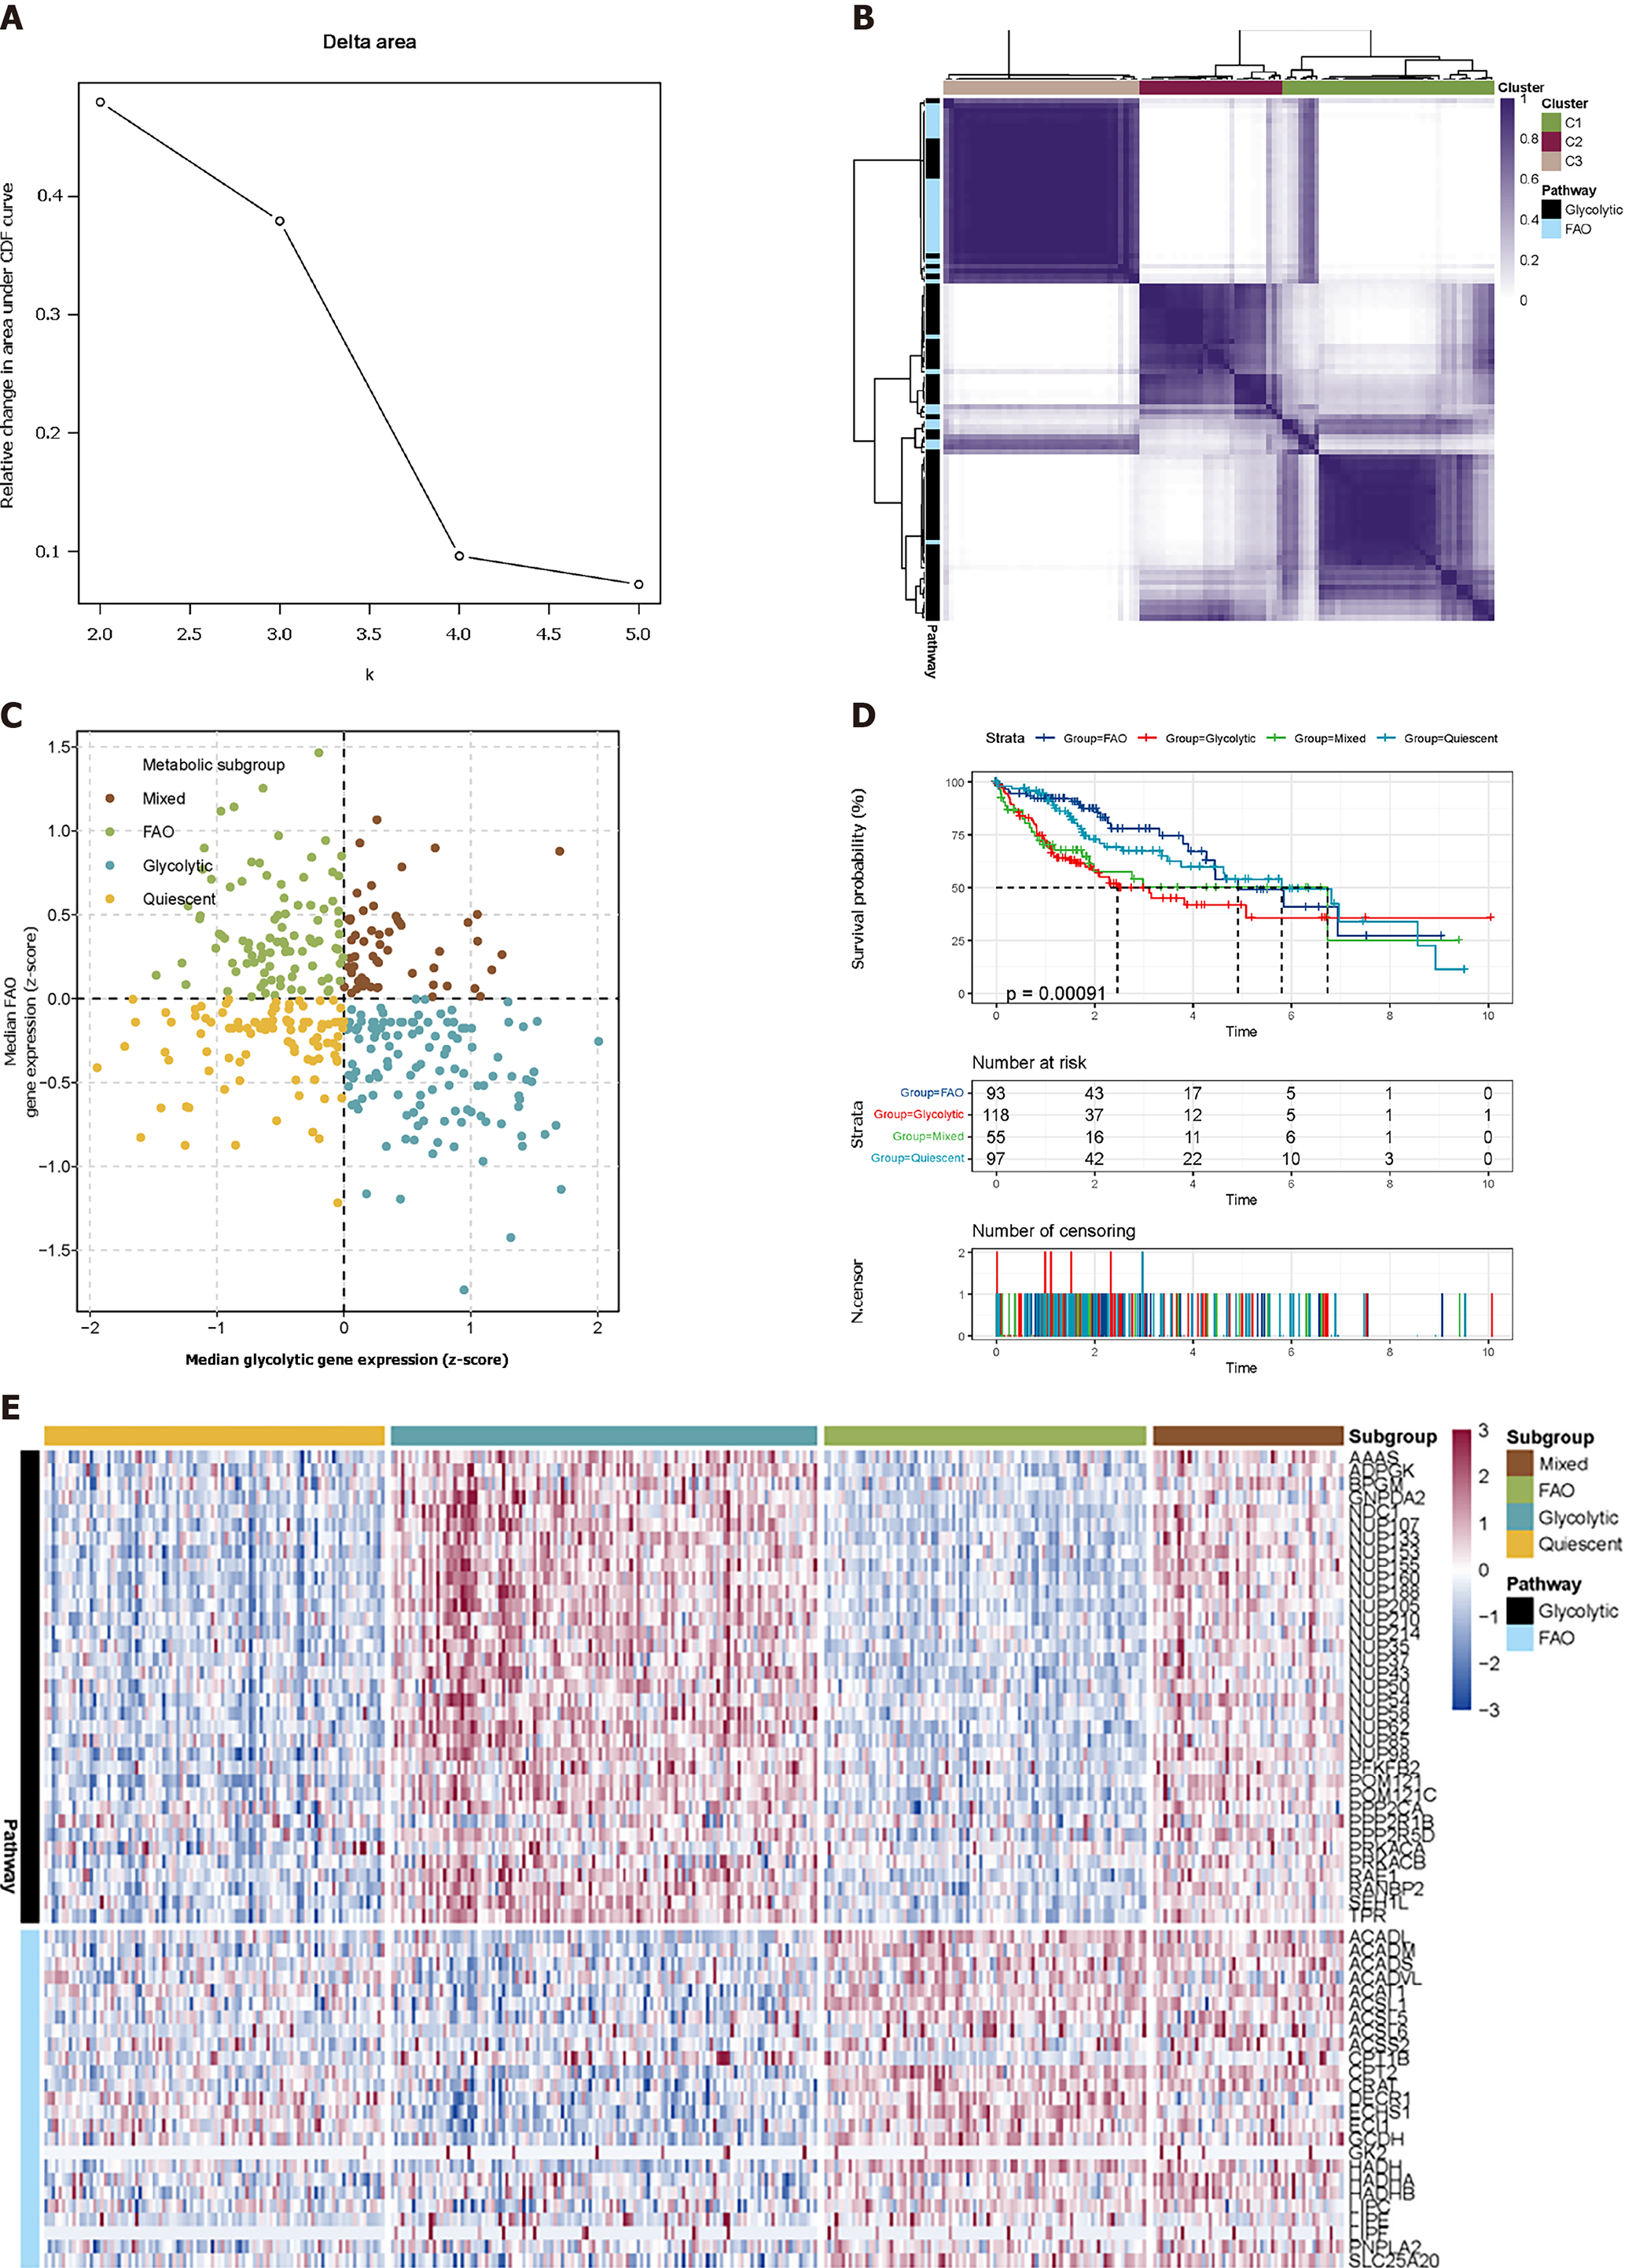
The metabolic genes with the highest correlation with glycolysis and FAO were screened out. According to the median expression value, these samples were divided into four metabolic subgroups: Glycolytic group (median gene expression value of glycolysis group > 0, median gene expression value of FAO group < 0); FAO group (glycolytic genes' median expression value < 0, FAO group genes' median expression value > 0); Mixed group (both median expression value > 0); Quiescent group (both median expression value < 0).
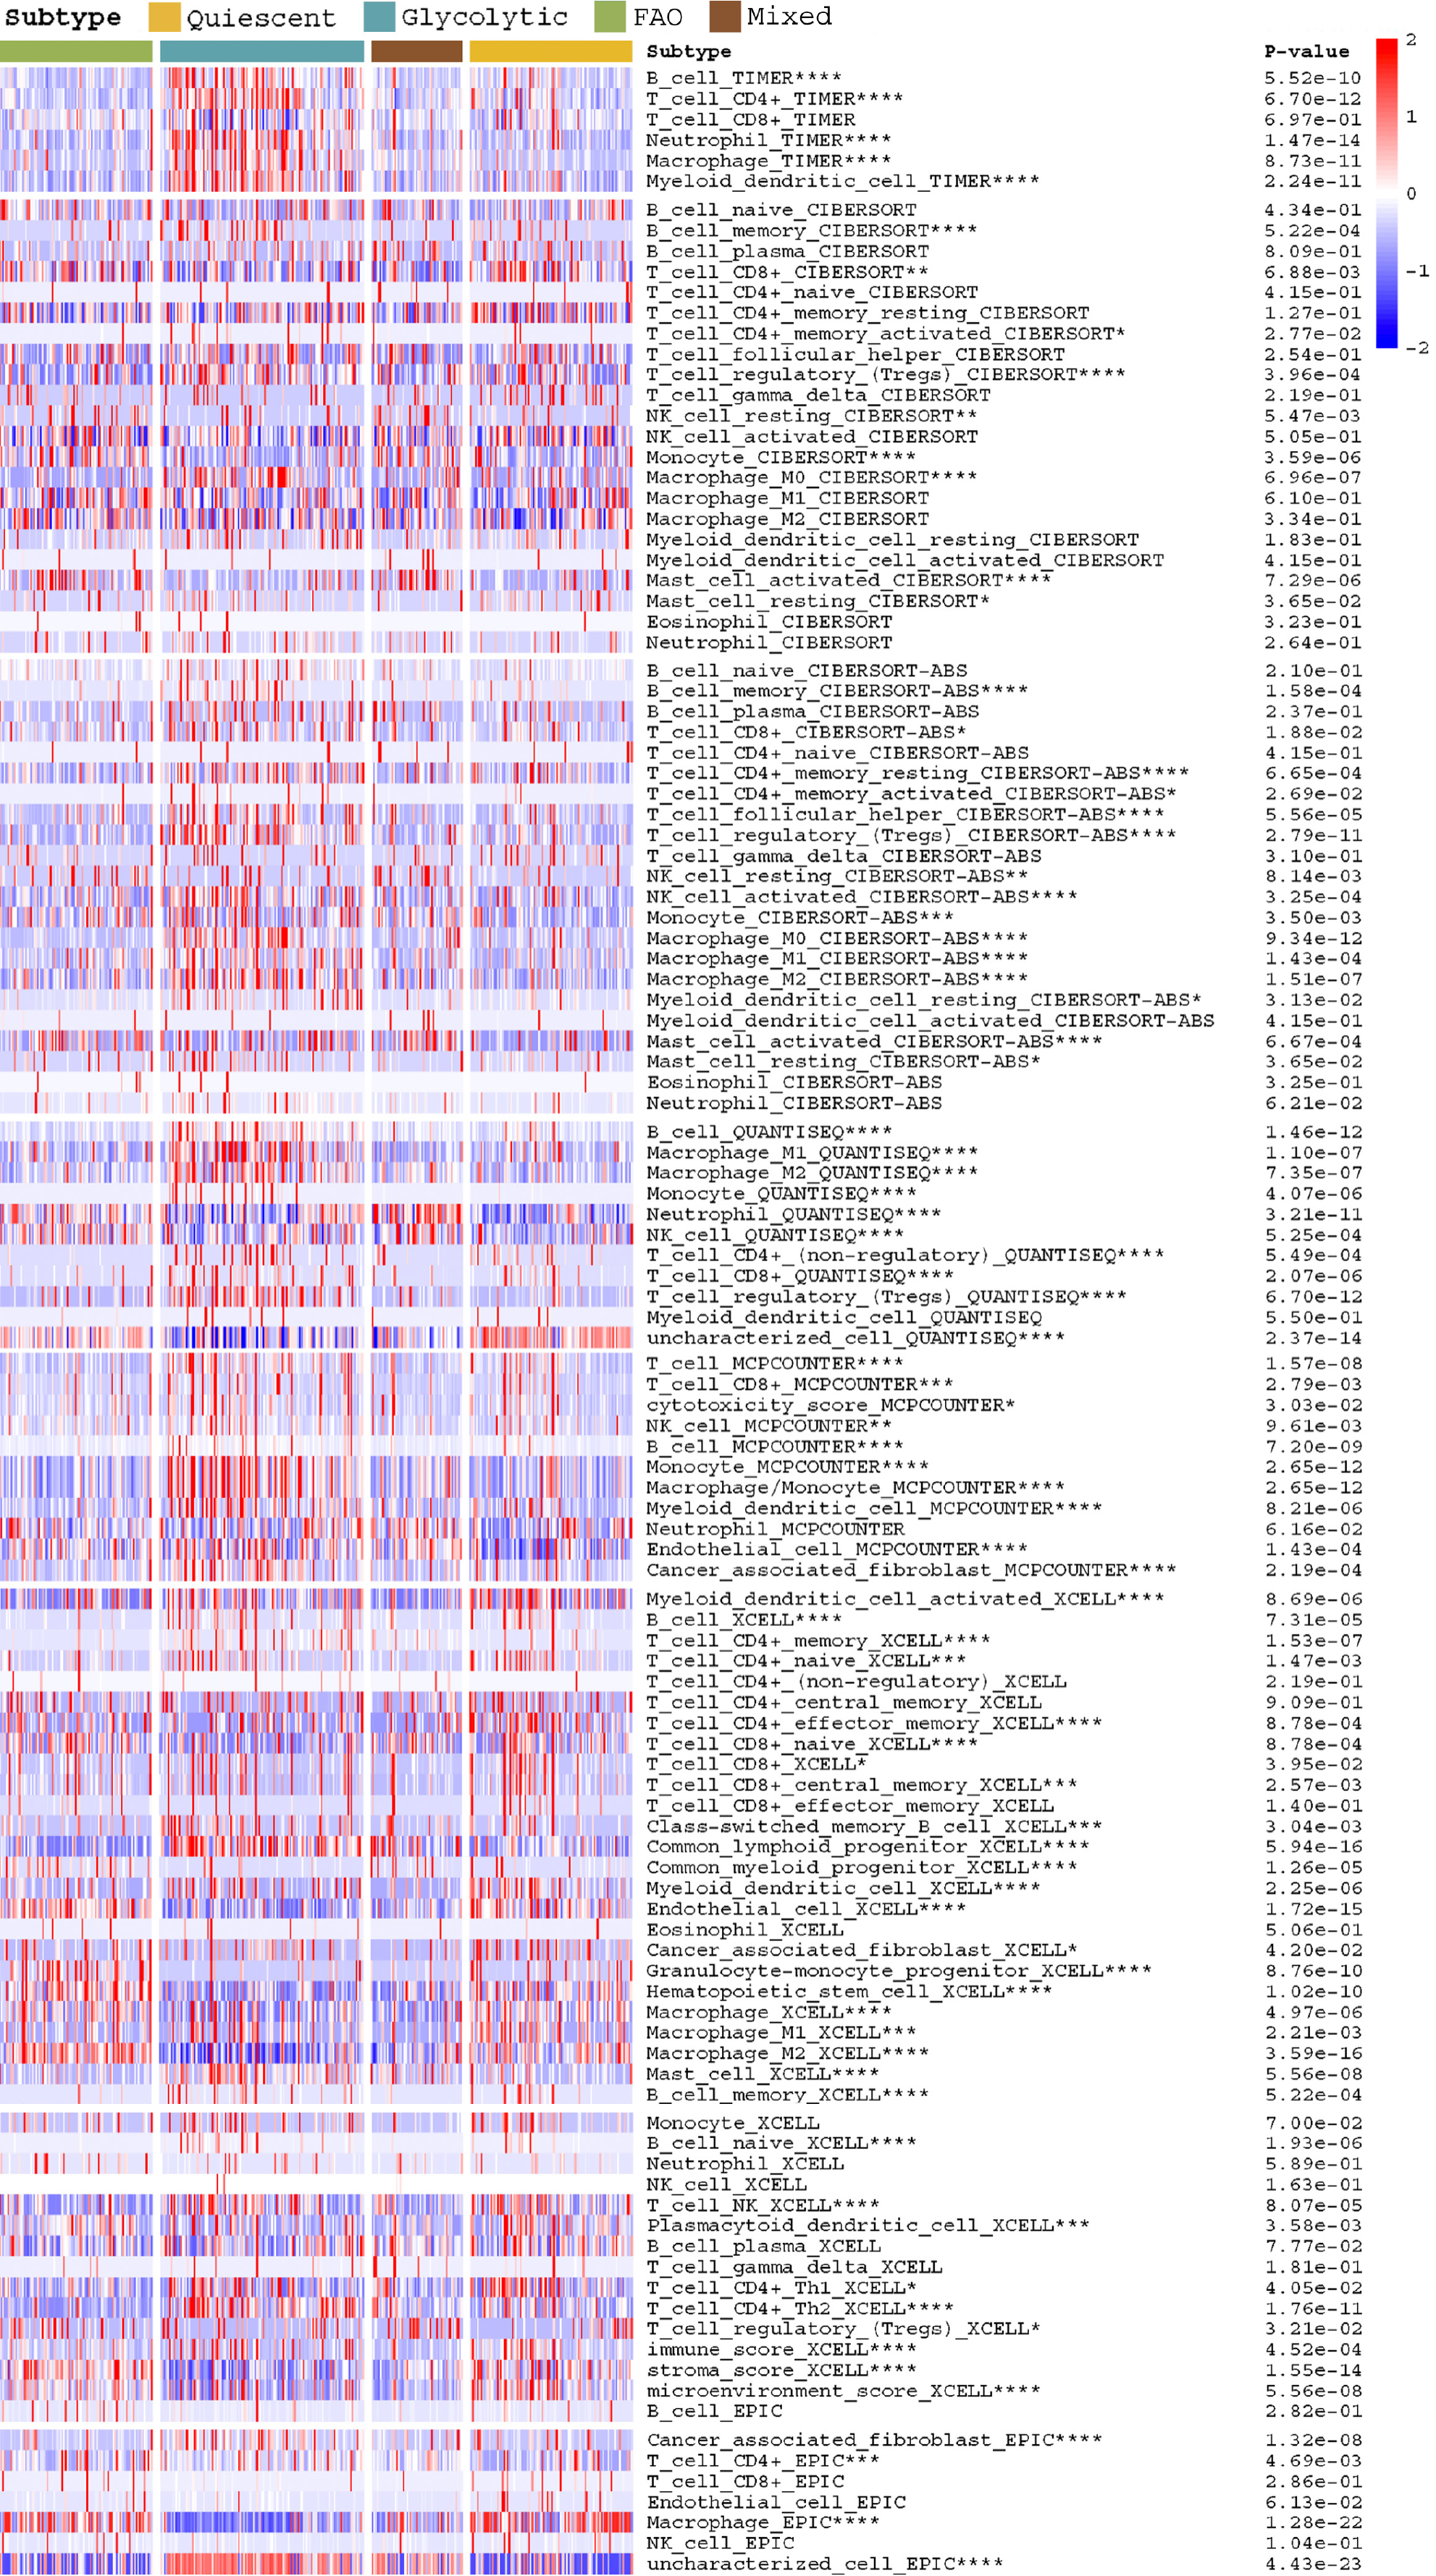
We used TIMER, CIBERSORT, CIBERSORT-ABS, QUANTISEQ, MCPCOUNTER, XCELL, and EPIC methods to compare the differences in immune cell infiltration in the four metabolic subtypes and calculated the differences between them using R's LIMMA package.
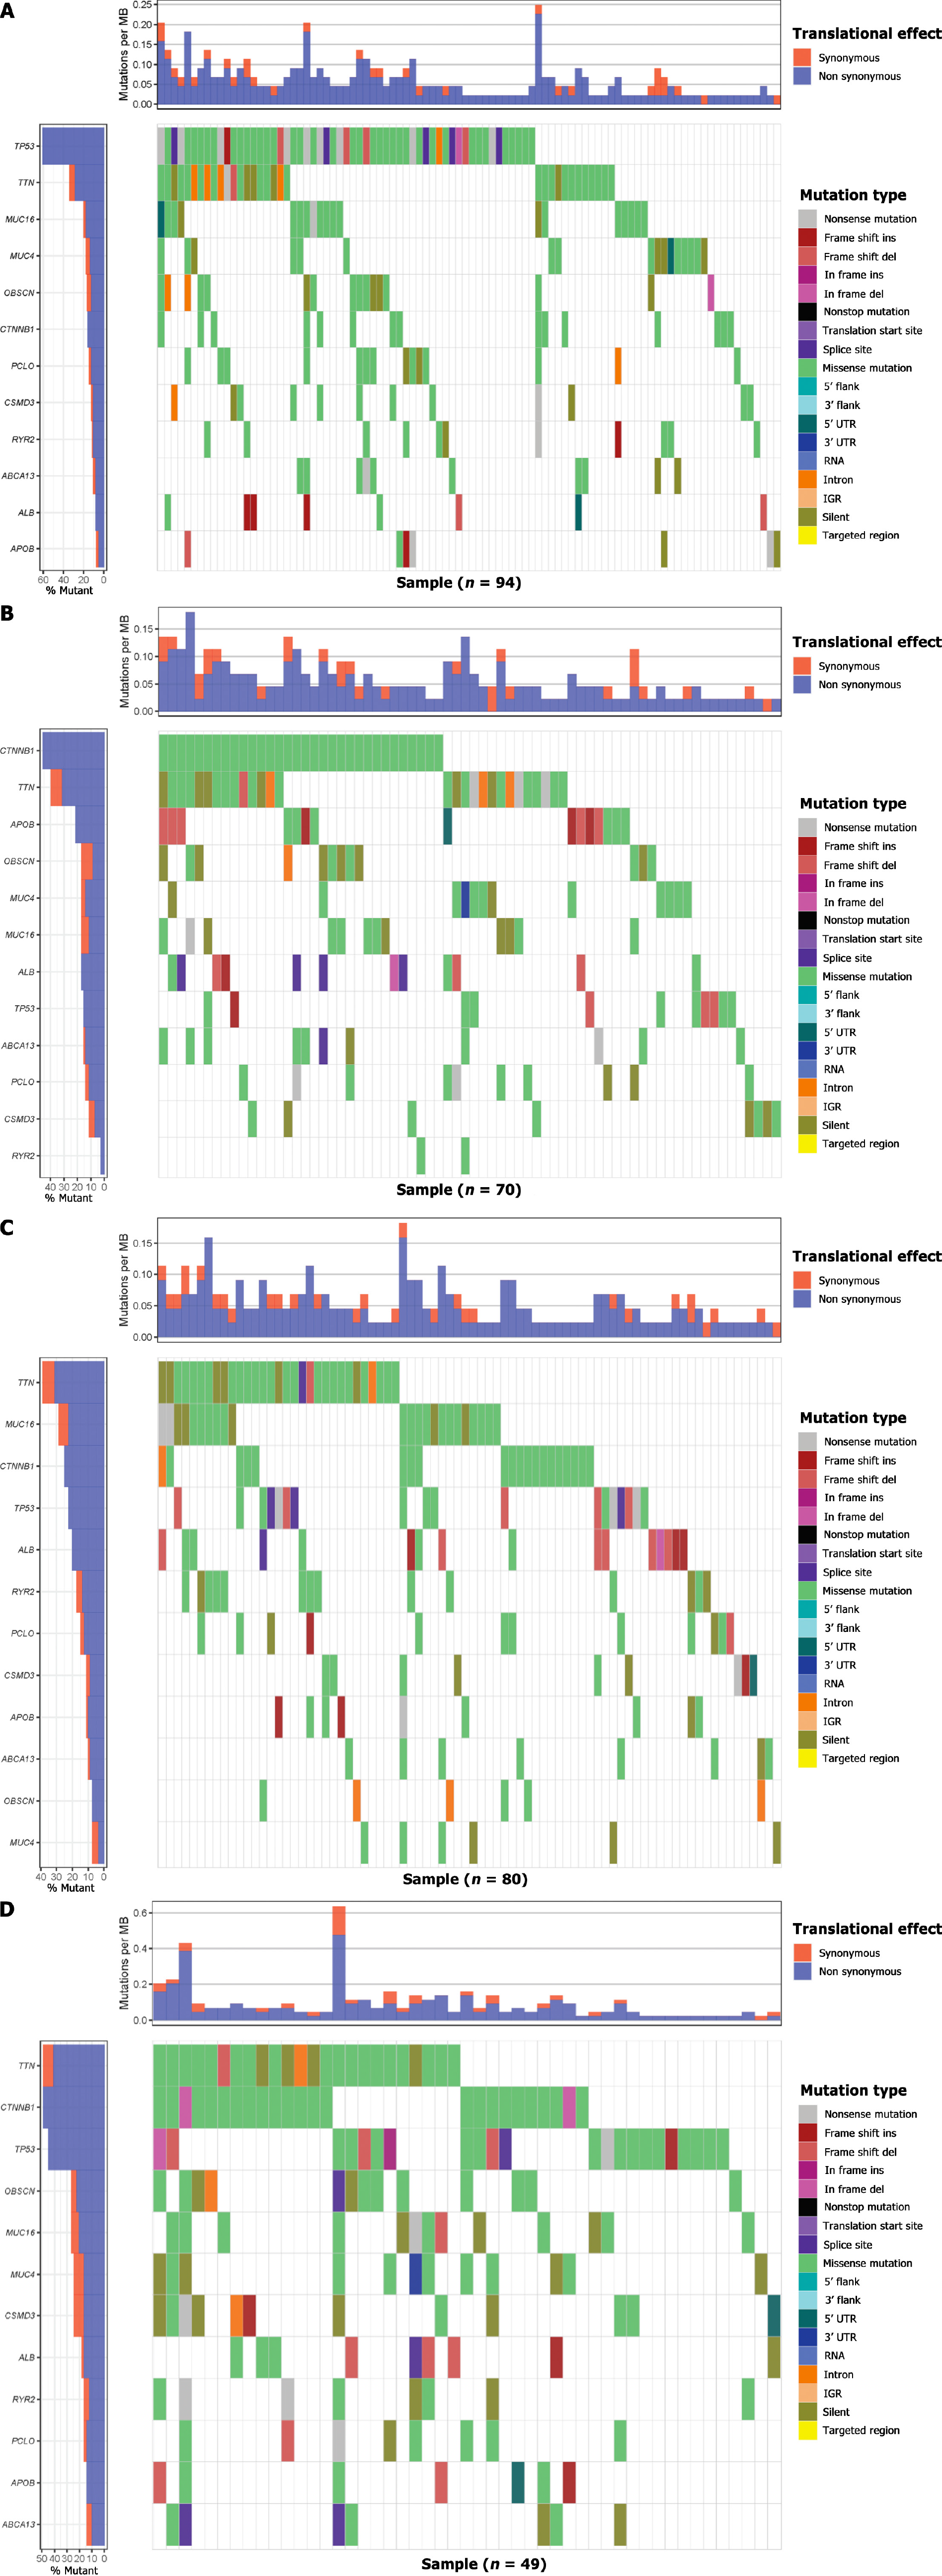
The genes with a mutation probability of more than 10% in each subtype were selected. A correlation waterfall chart was drawn, and the association between gene mutation and grouping was calculated (P < 0.05). A scatter plot reveals the relationship between the expression of each of the mutated genes and the expression of metabolic genes (P < 0.05).
The segment files obtained were divided into four metabolic subtypes. We ran Genomic Identification of Significant Targets in Cancer (GISTIC) 2.0 online on the GenePattern website (https://cloud.genepattern.org/) to get the GISTIC scores of each subtype and somatic copy number variation of each chromosome condition.
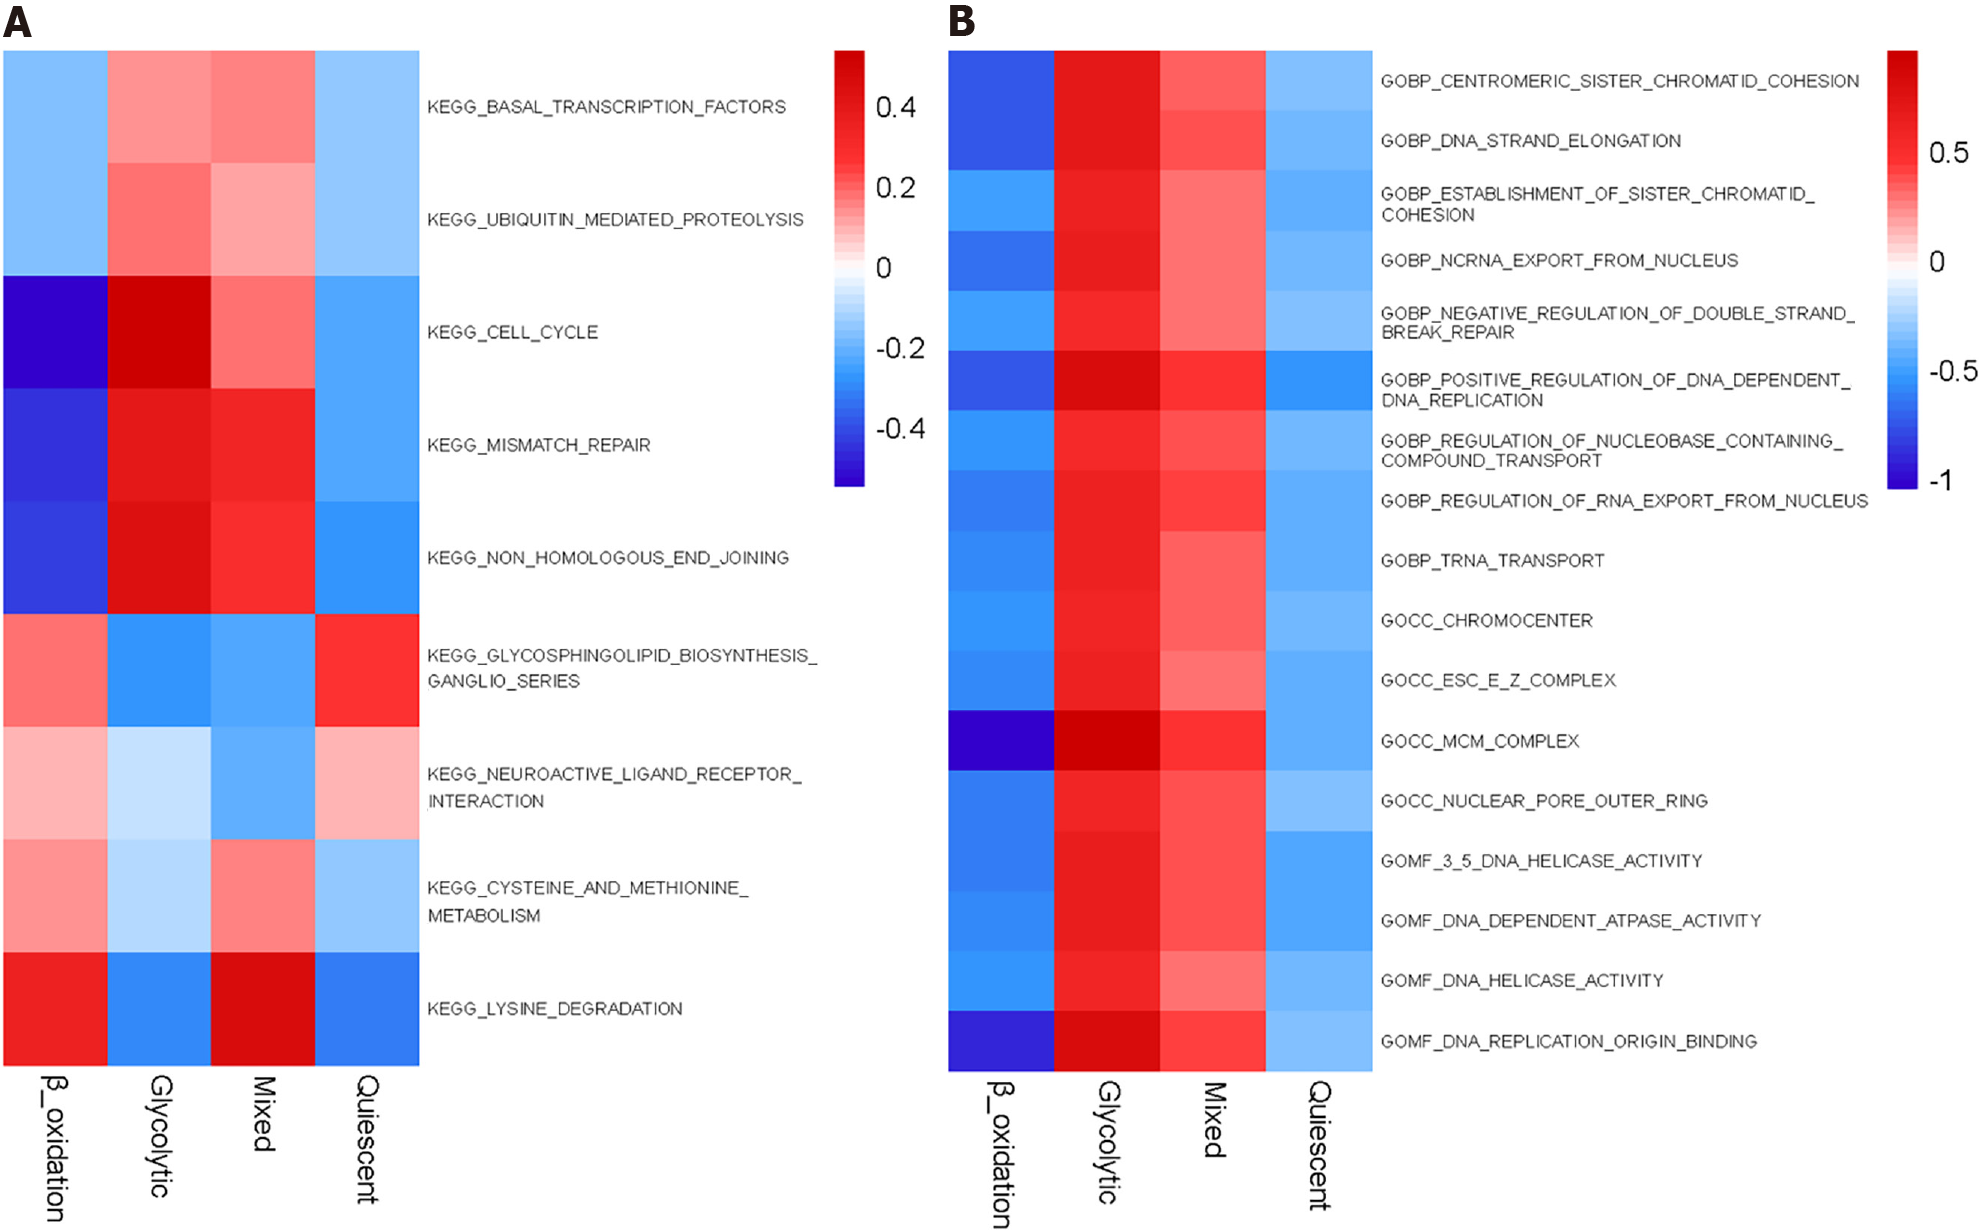
We calculated the enrichment score of each sample in TCGA-LIHC according to c2.cp.kegg. v7.4.symbols.gmt and c5.go.v7.4.symbols.gmt. The LIMMA package helped us filter pathways that differed from the other four groups (P < 0.05).
The tumour immune dysfunction and rejection algorithm [tumour immune dysfunction and exclusion (TIDE)] was used to predict immunotherapy response. With the help of the public pharmacogenomics database, the Genomics of Drug Sensitivity in Cancer (https://www.cancerrxgene.org/), we predicted the response of subtypes to different anti-cancer drugs. Based on the R package 'pRRophetic', the half-maximum inhibitory concentration (IC50) of samples was estimated through ridge regression, and the prediction accuracy was evaluated through 10-fold cross-validation.
We used the 35 glycolytic group genes and 25 FAO group genes obtained after clustering to construct a prognostic model. Univariate Cox regression analysis was implemented to find genes related to survivals in TCGA-LIHC. Combined with the 'glmnet' package of the R language, Lasso Cox regression further reduced the dimensionality. The penalty parameter (λ) of the model selected the minimum standard. The obtained genes were further subjected to multivariate Cox regression analysis, and genes with P < 0.05 were selected for modelling. Coefficients were recalculated to get a prognostic model, and survival curves were depicted. The time-dependent receiver operating characteristic (ROC) curve was drawn to evaluate the predictive value of the prognostic gene signature for overall survival using the R package 'survivalROC'.
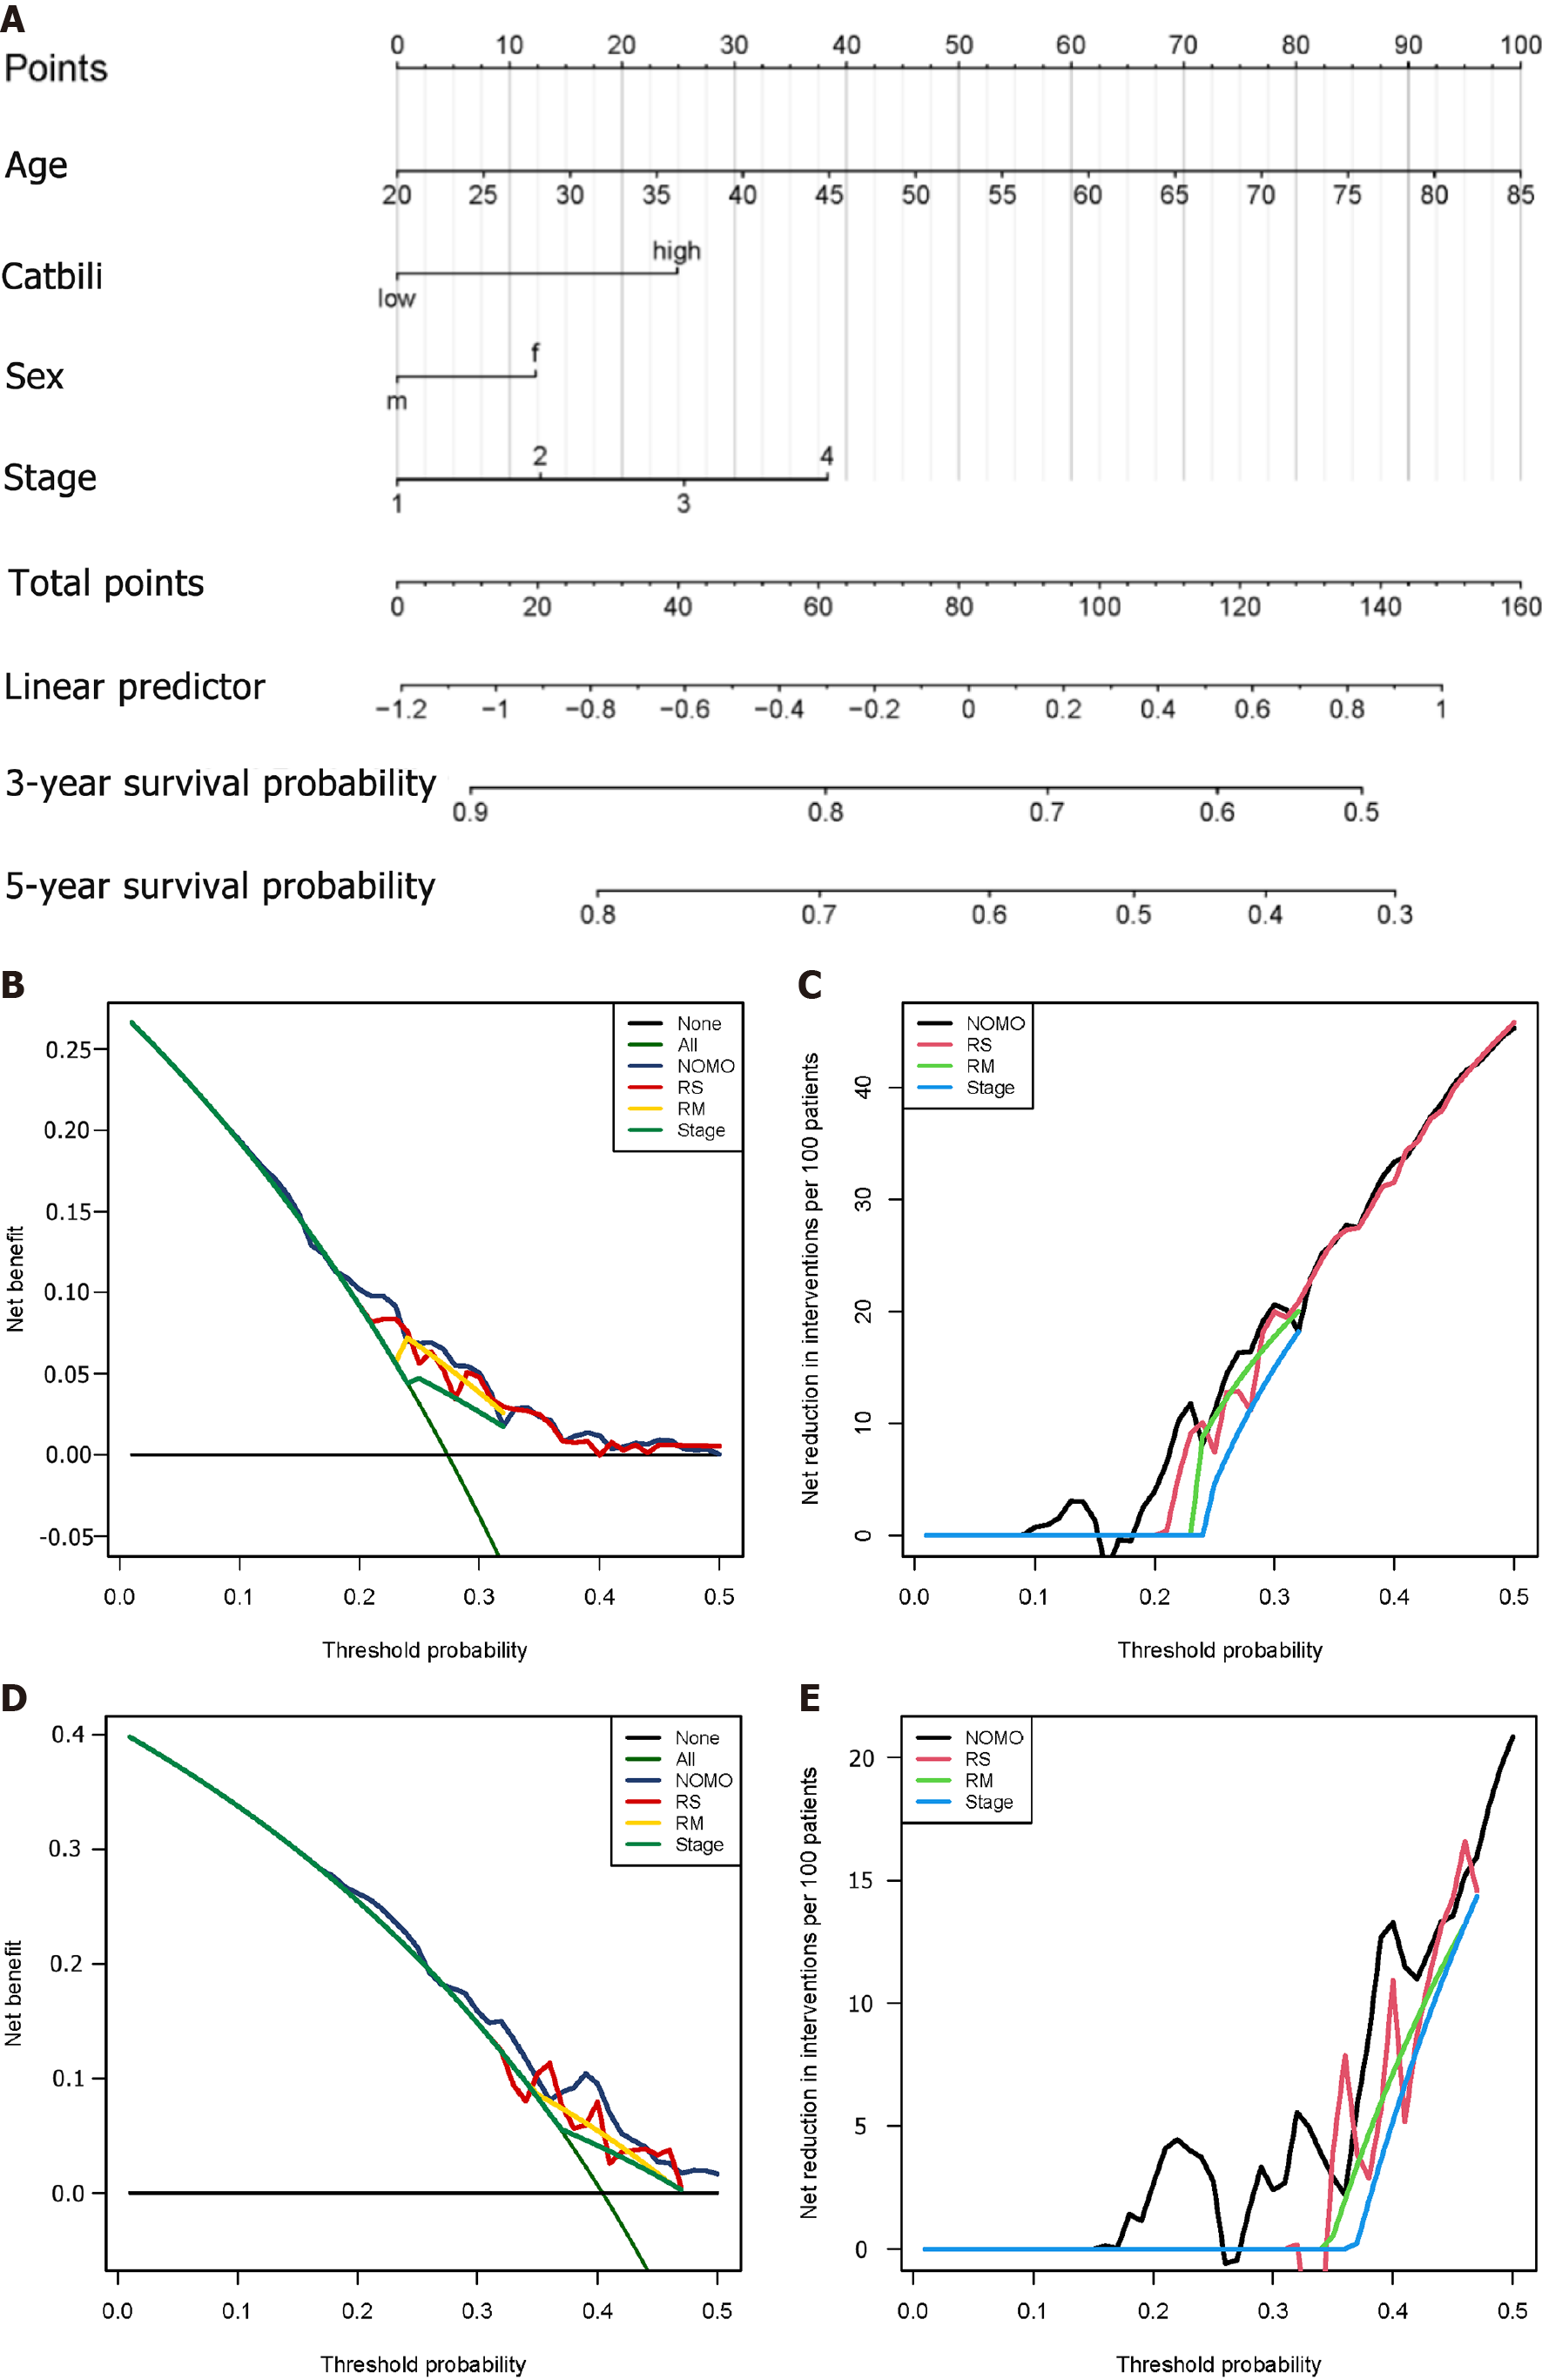
We used four prognostic factors, including gender, age, tumor, node, and metastasis (TNM) stage, and risk score to construct a nomogram to predict the patient's 3-year and 5-year overall survival. A Norman diagram was drawn based on the multivariate Cox regression model to visualise the risk model, age, gender, and tumor, node, and metastasis staging on patient survival.
Decision curve analysis (DCA) used R's 'DCA' package to compare clinical risk factors, risk prediction models, and the prognostic accuracy of a combination of clinical and risk prediction models. DCA was used to calculate the net clinical benefit of each model compared with all or no strategies. The best model was the one with the highest calculated net benefit.
We used the consensus supervised clustering method to filter and identify two sets of metabolic pathway-related genes (Figure 1A and B), including glycolysis (n = 35) and FAO (n = 25) for the grouping of metabolic subtypes (Figure 1). According to the median expression values of these two groups of genes, the TCGA-LIHC samples were divided into four subgroups: The glycolysis group (n = 123), the FAO group (n = 94), the mixed group (n = 55), and the quiescent group (n = 98) (Figure 1C). A heatmap is used to show the difference in expression of 60 genes in these four subgroups (Figure 1E).
The survival curve of the samples was drawn according to the grouping (long-rank test P = 0.00091). Glycolysis was seen to have the shortest median survival time of tumours. As the expression of FAO-related genes increased, these samples showed a better survival time. The Mixed and Quiescent groups had better survival time than the glycolysis group, while FAO related to the longest median survival time of the tumour.
The heatmap shows the difference in immune infiltration between metabolic subgroups (Figure 2). Among them, the glycolytic group had significantly more immune cell infiltration: Natural killer cells, CD4 T cells, regulatory T cells, mast cells, etc. In terms of SNP, the most frequent mutation gene of the glycolysis group was TP53, while for FAO it was CTNNB1 (Figure 3A and B). Combining the expression of mutant genes and metabolic genes, we found that TP53, OBSCN, PCLO, RYR2, TTN, CSMDS, MUC4, and MUC16 were positively correlated with the expression of glycolytic genes, and TP53, OBSCN,
We used the GISTIC algorithm to examine frequently changing regions in the genome and identified significant somatic copy amplification and deletion (Figure 5A-H). Significant amplification peaks could be detected at 17q25.3, 1q21.3, 11q13.3, and 6p21.1, while the frequently deleted genomic regions were 1p33.31, 2q23.1, 4q35.1, and 13q14.3. These peaks can also be observed in the glycolytic group, but the G-score was lower than that in the FAO group (Figure 5I-J). This suggests that there are different copy number variation characteristics between metabolic subgroups, which affect the progression and prognosis of tumours.
Kyoto Encyclopedia of Genes and Genomes enrichment analysis showed significant differences between metabolic subgroups, cell cycle, basic transcription factors, cysteine and methionine metabolism, mismatch repair, protein-mediated proteolysis, and non-homologous termination-related pathways (Figure 6A). In Gene Ontology enrichment analysis, minichromosome maintenance complex and DNA replication origin combined with DNA-dependent positive regulation of DNA replication indicated that these pathways were significantly higher in the glycolytic group than in the FAO group (Figure 6B).
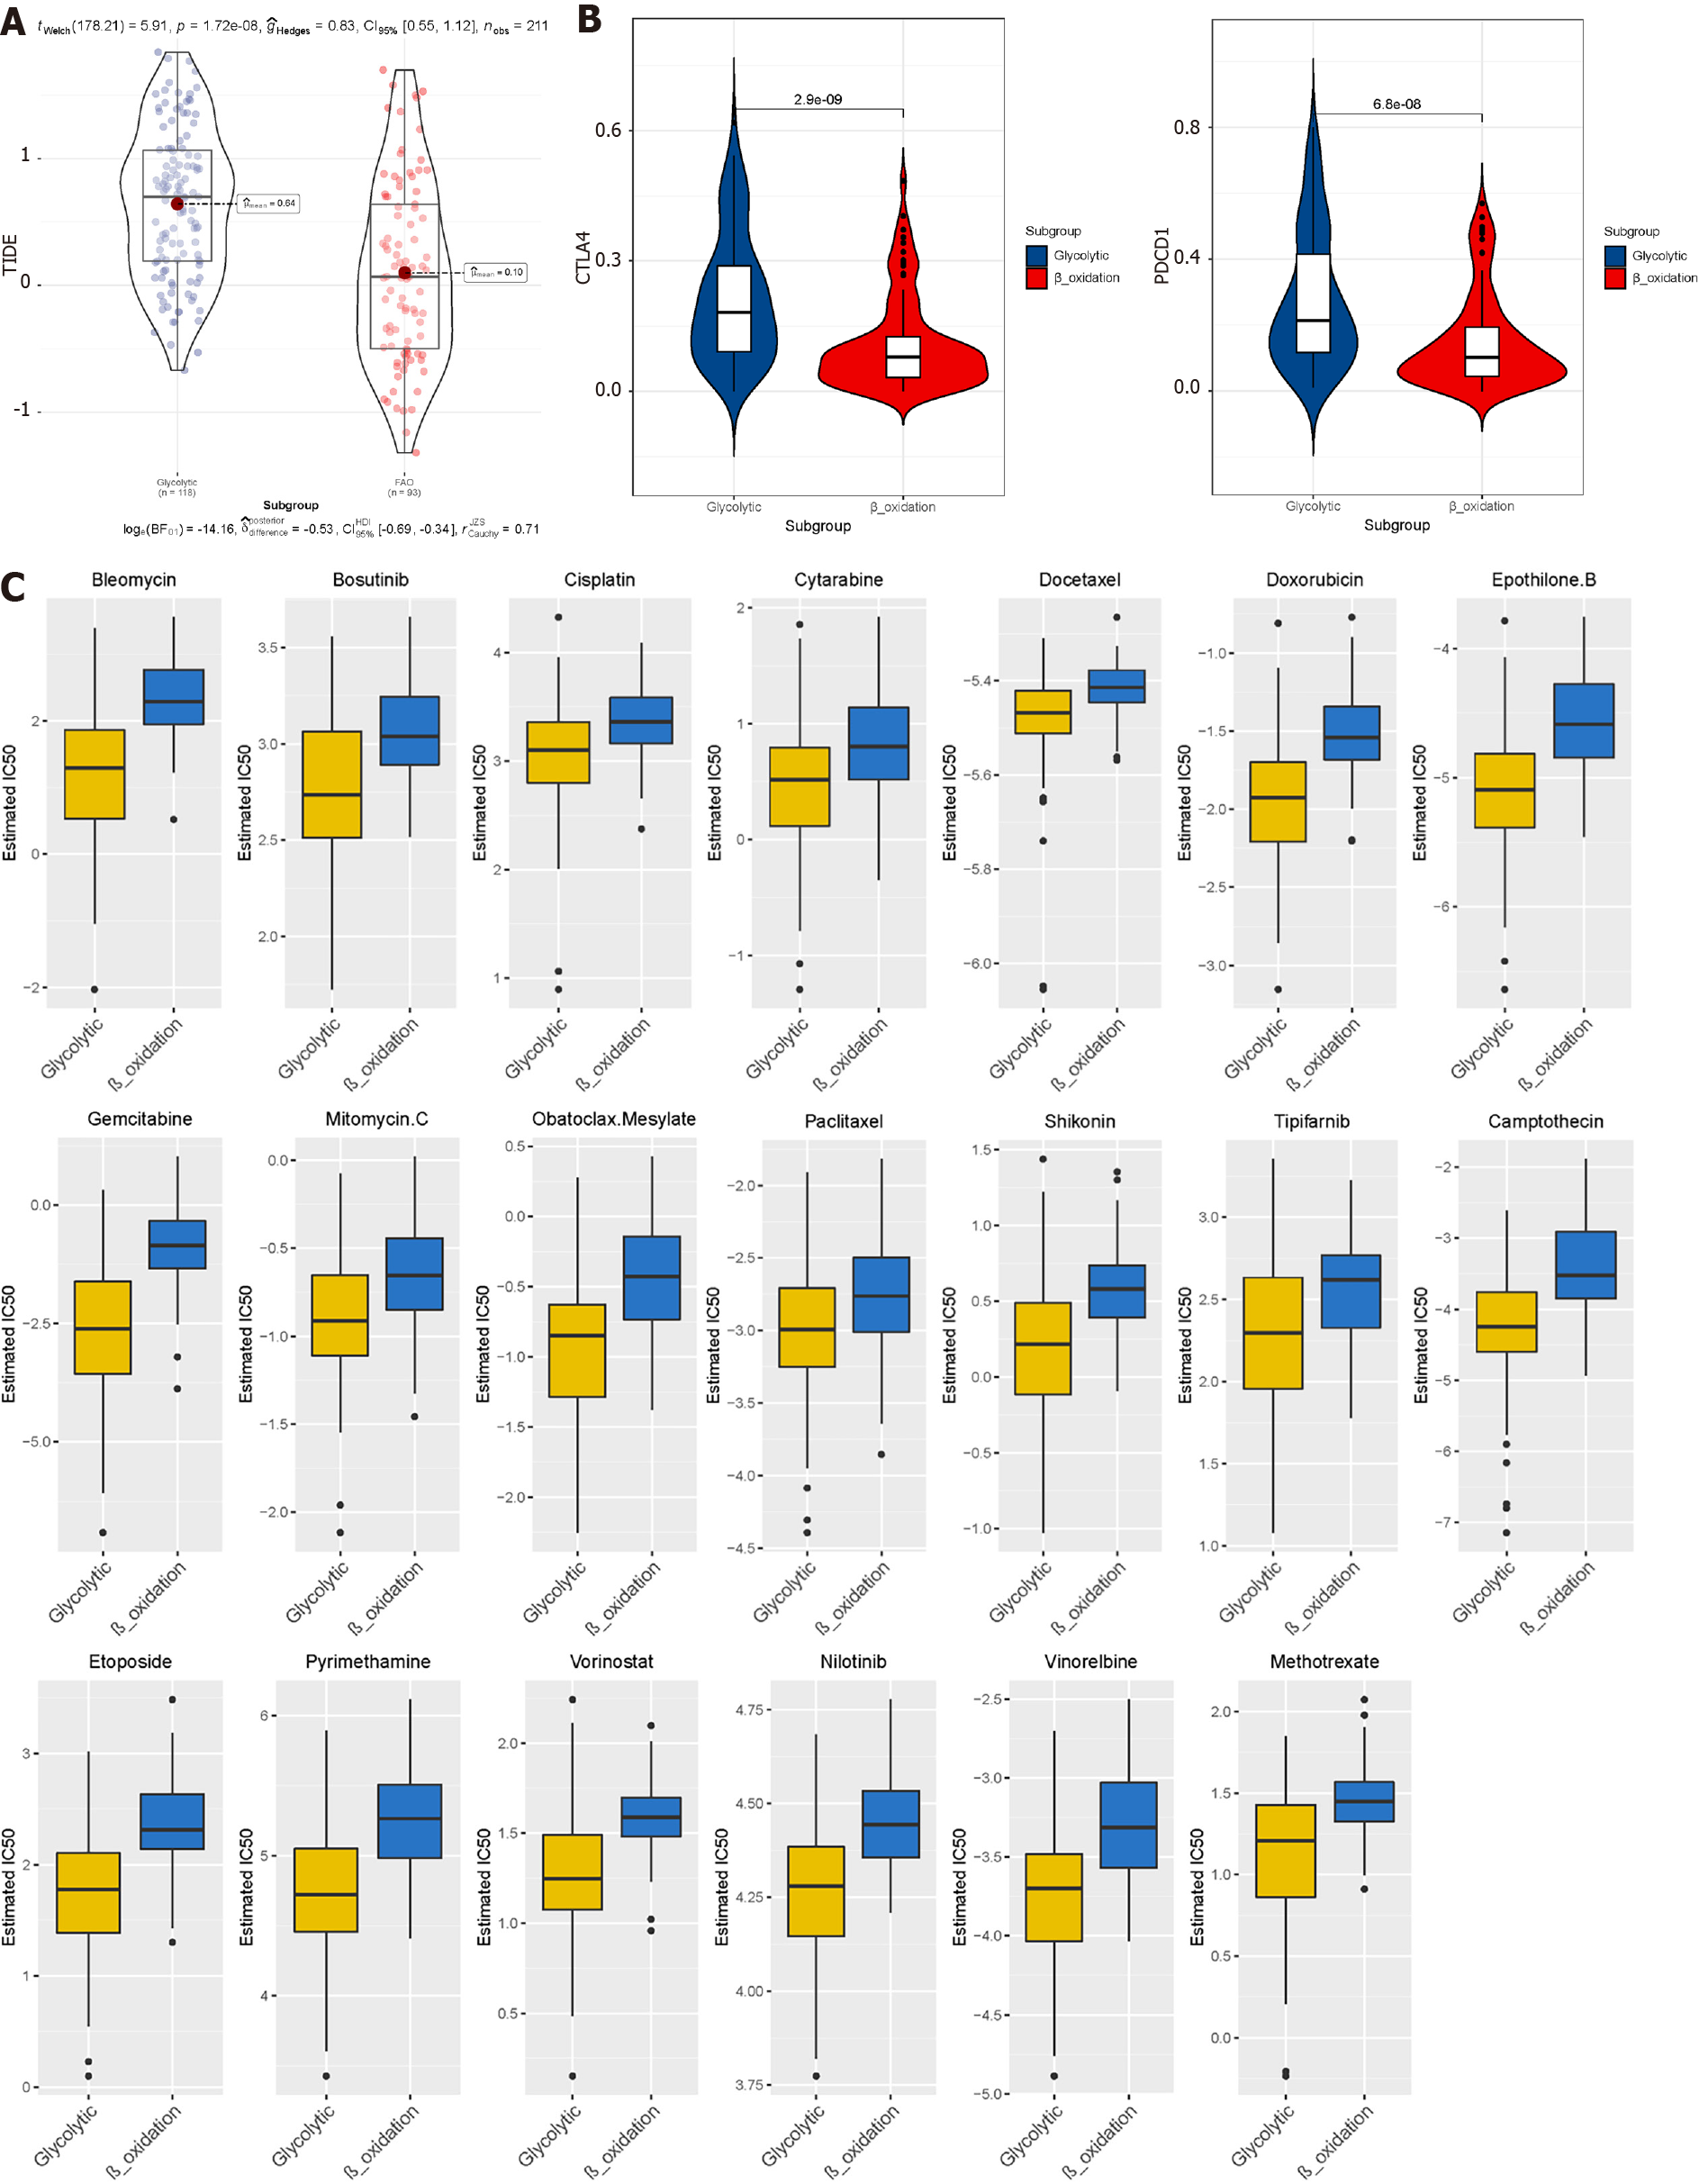
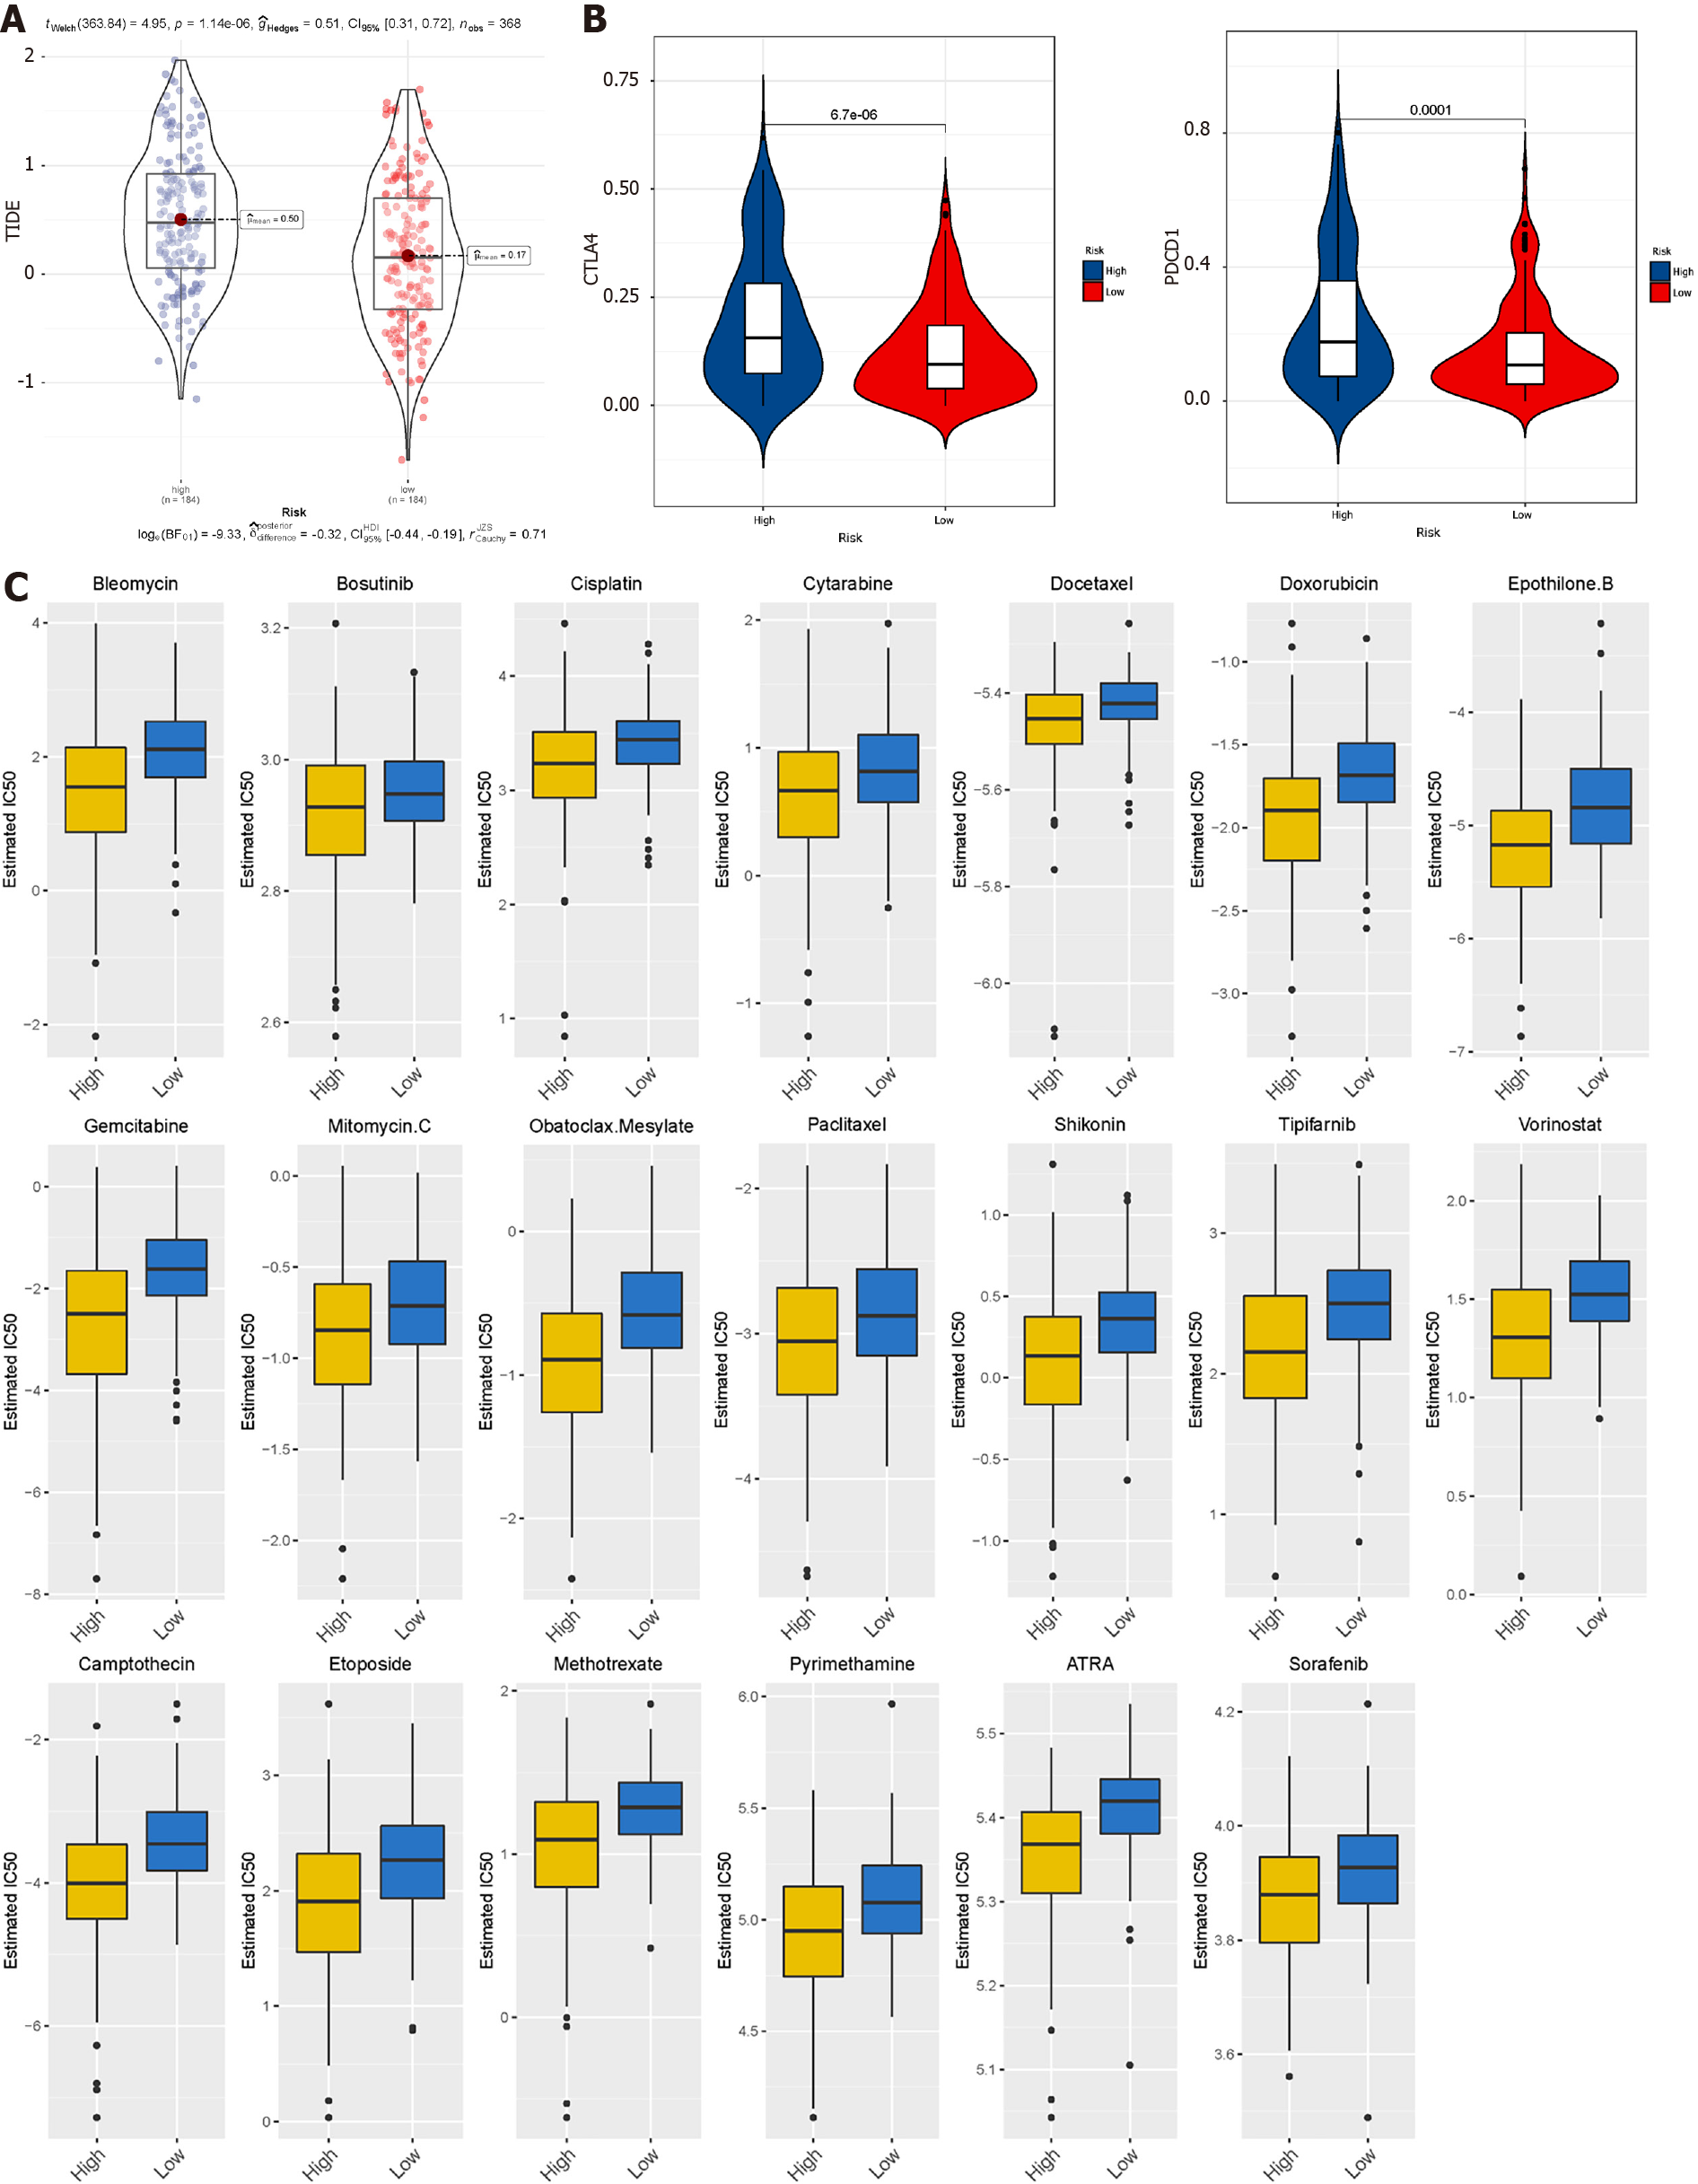
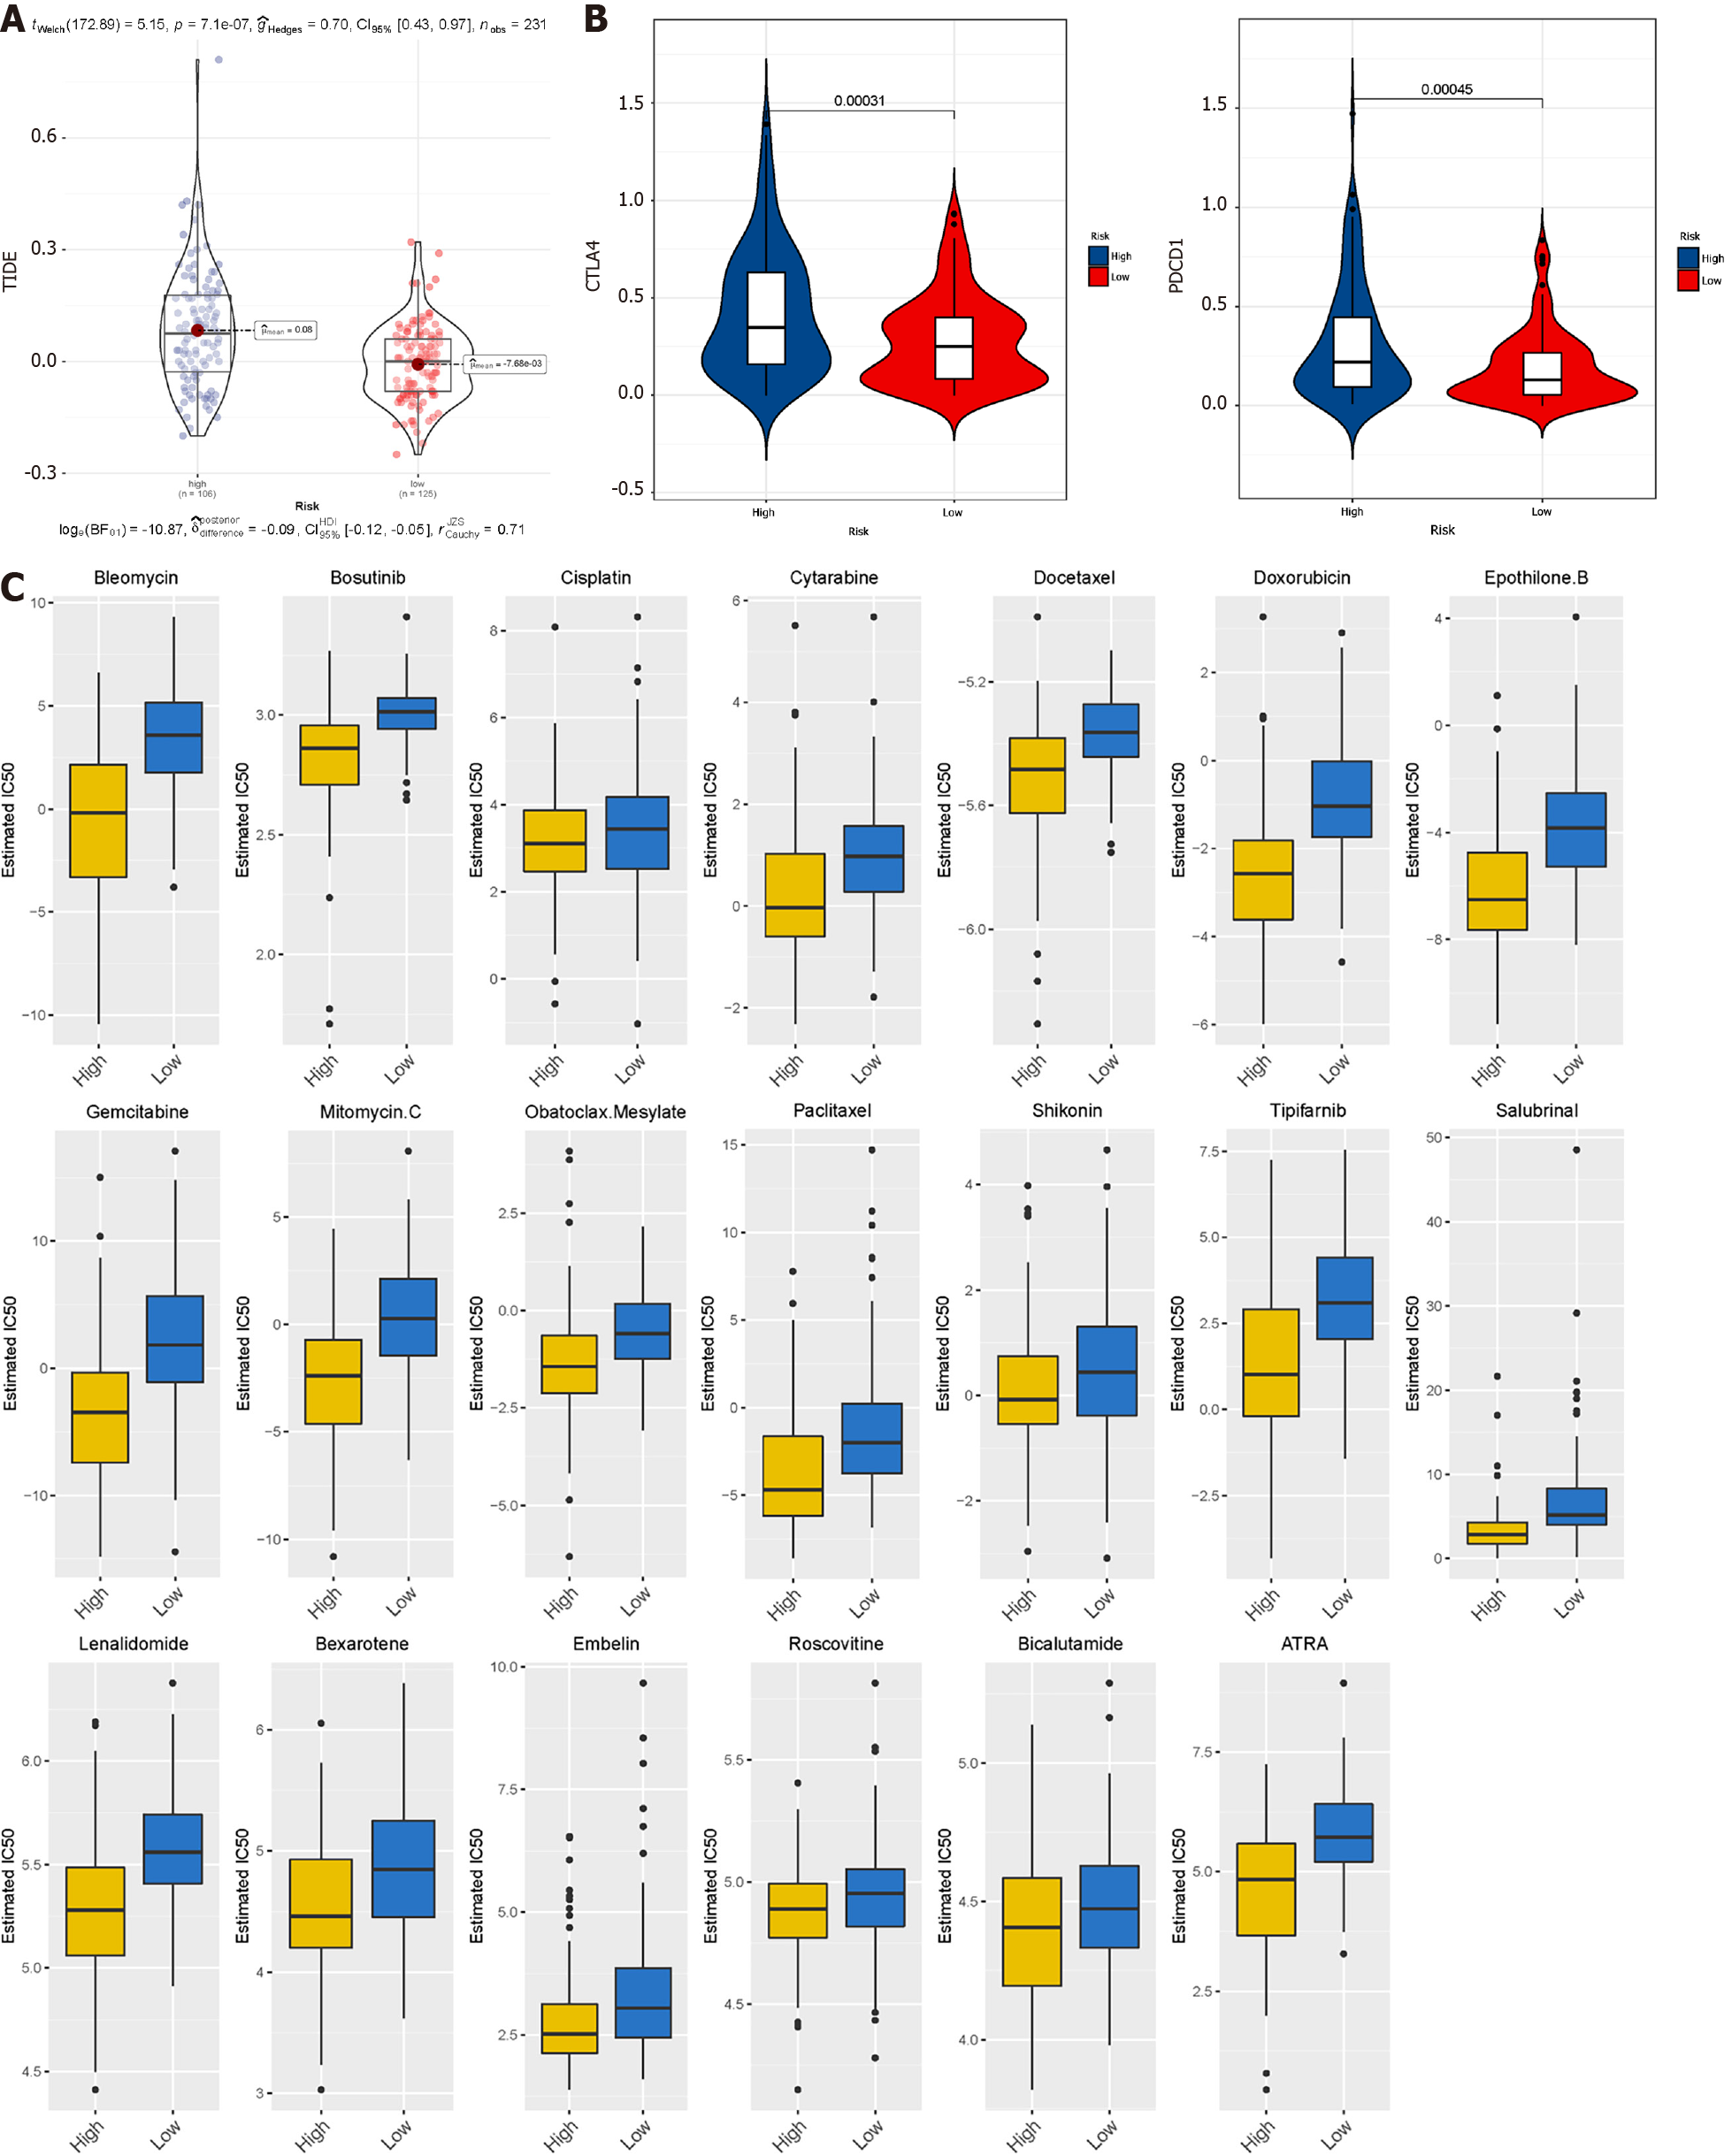
TIDE uses gene expression profiles to predict the effect of ICB therapy in tumours. We evaluated two tumour immune escape mechanisms, comprising tumour-infiltrating cytotoxic T lymphocyte dysfunction and immunosuppressive factor rejection. Patients with high scores have a higher chance of anti-tumour immune escape (Figure 7A), and thus exhibit poor ICB treatment response. The low-risk group and FAO group were more sensitive to ICB treatment (Figures 8A and 9A).
We selected commonly used chemotherapy drugs, including Cisplatin, Paclitaxel, Methotrexate, Pyrimethamine, Doxorubicin, Gemcitabine, Sorafenib, Cytarabine, Mitomycin C, Bleomycin, and Bosutinib to predict the chemotherapy response of different metabolic subgroups. The IC50 of the sample was predicted. The IC50 of the Glycolytic group was significantly lower, while the FAO group was the opposite, indicating that HCC patients with stronger FAO can benefit more from anti-cancer drugs (Figure 7C). We used this method to compare the high- and low-risk groups of the prediction model and found that the low-risk group could benefit, regardless of ICB treatment or common chemotherapy drugs (Figures 8C and 9C).
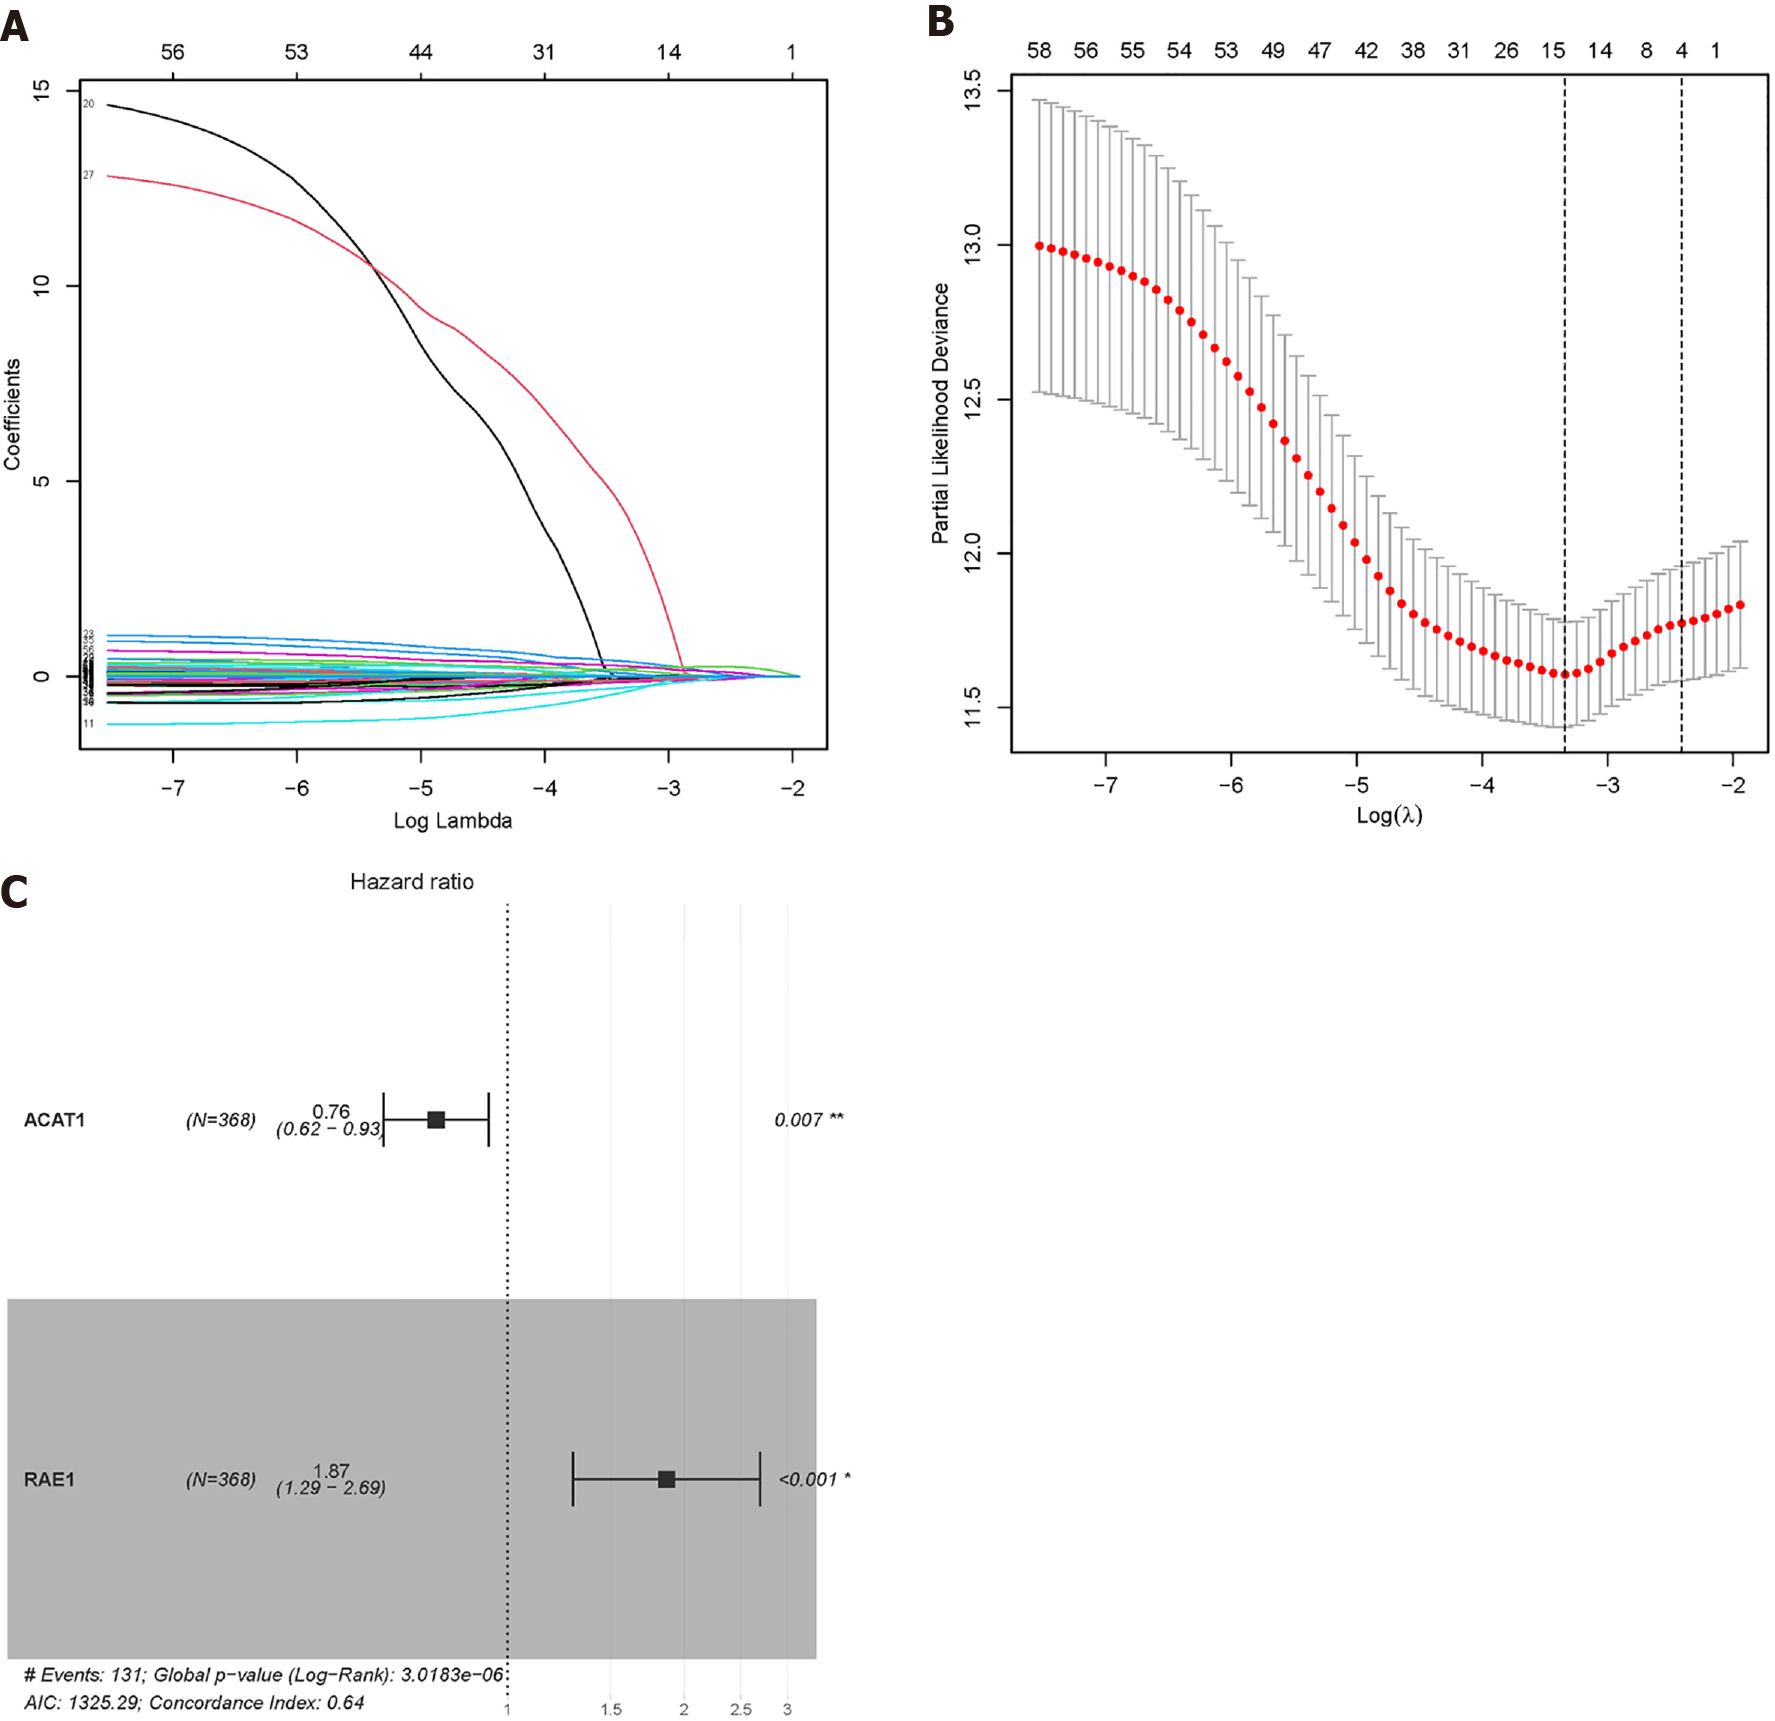
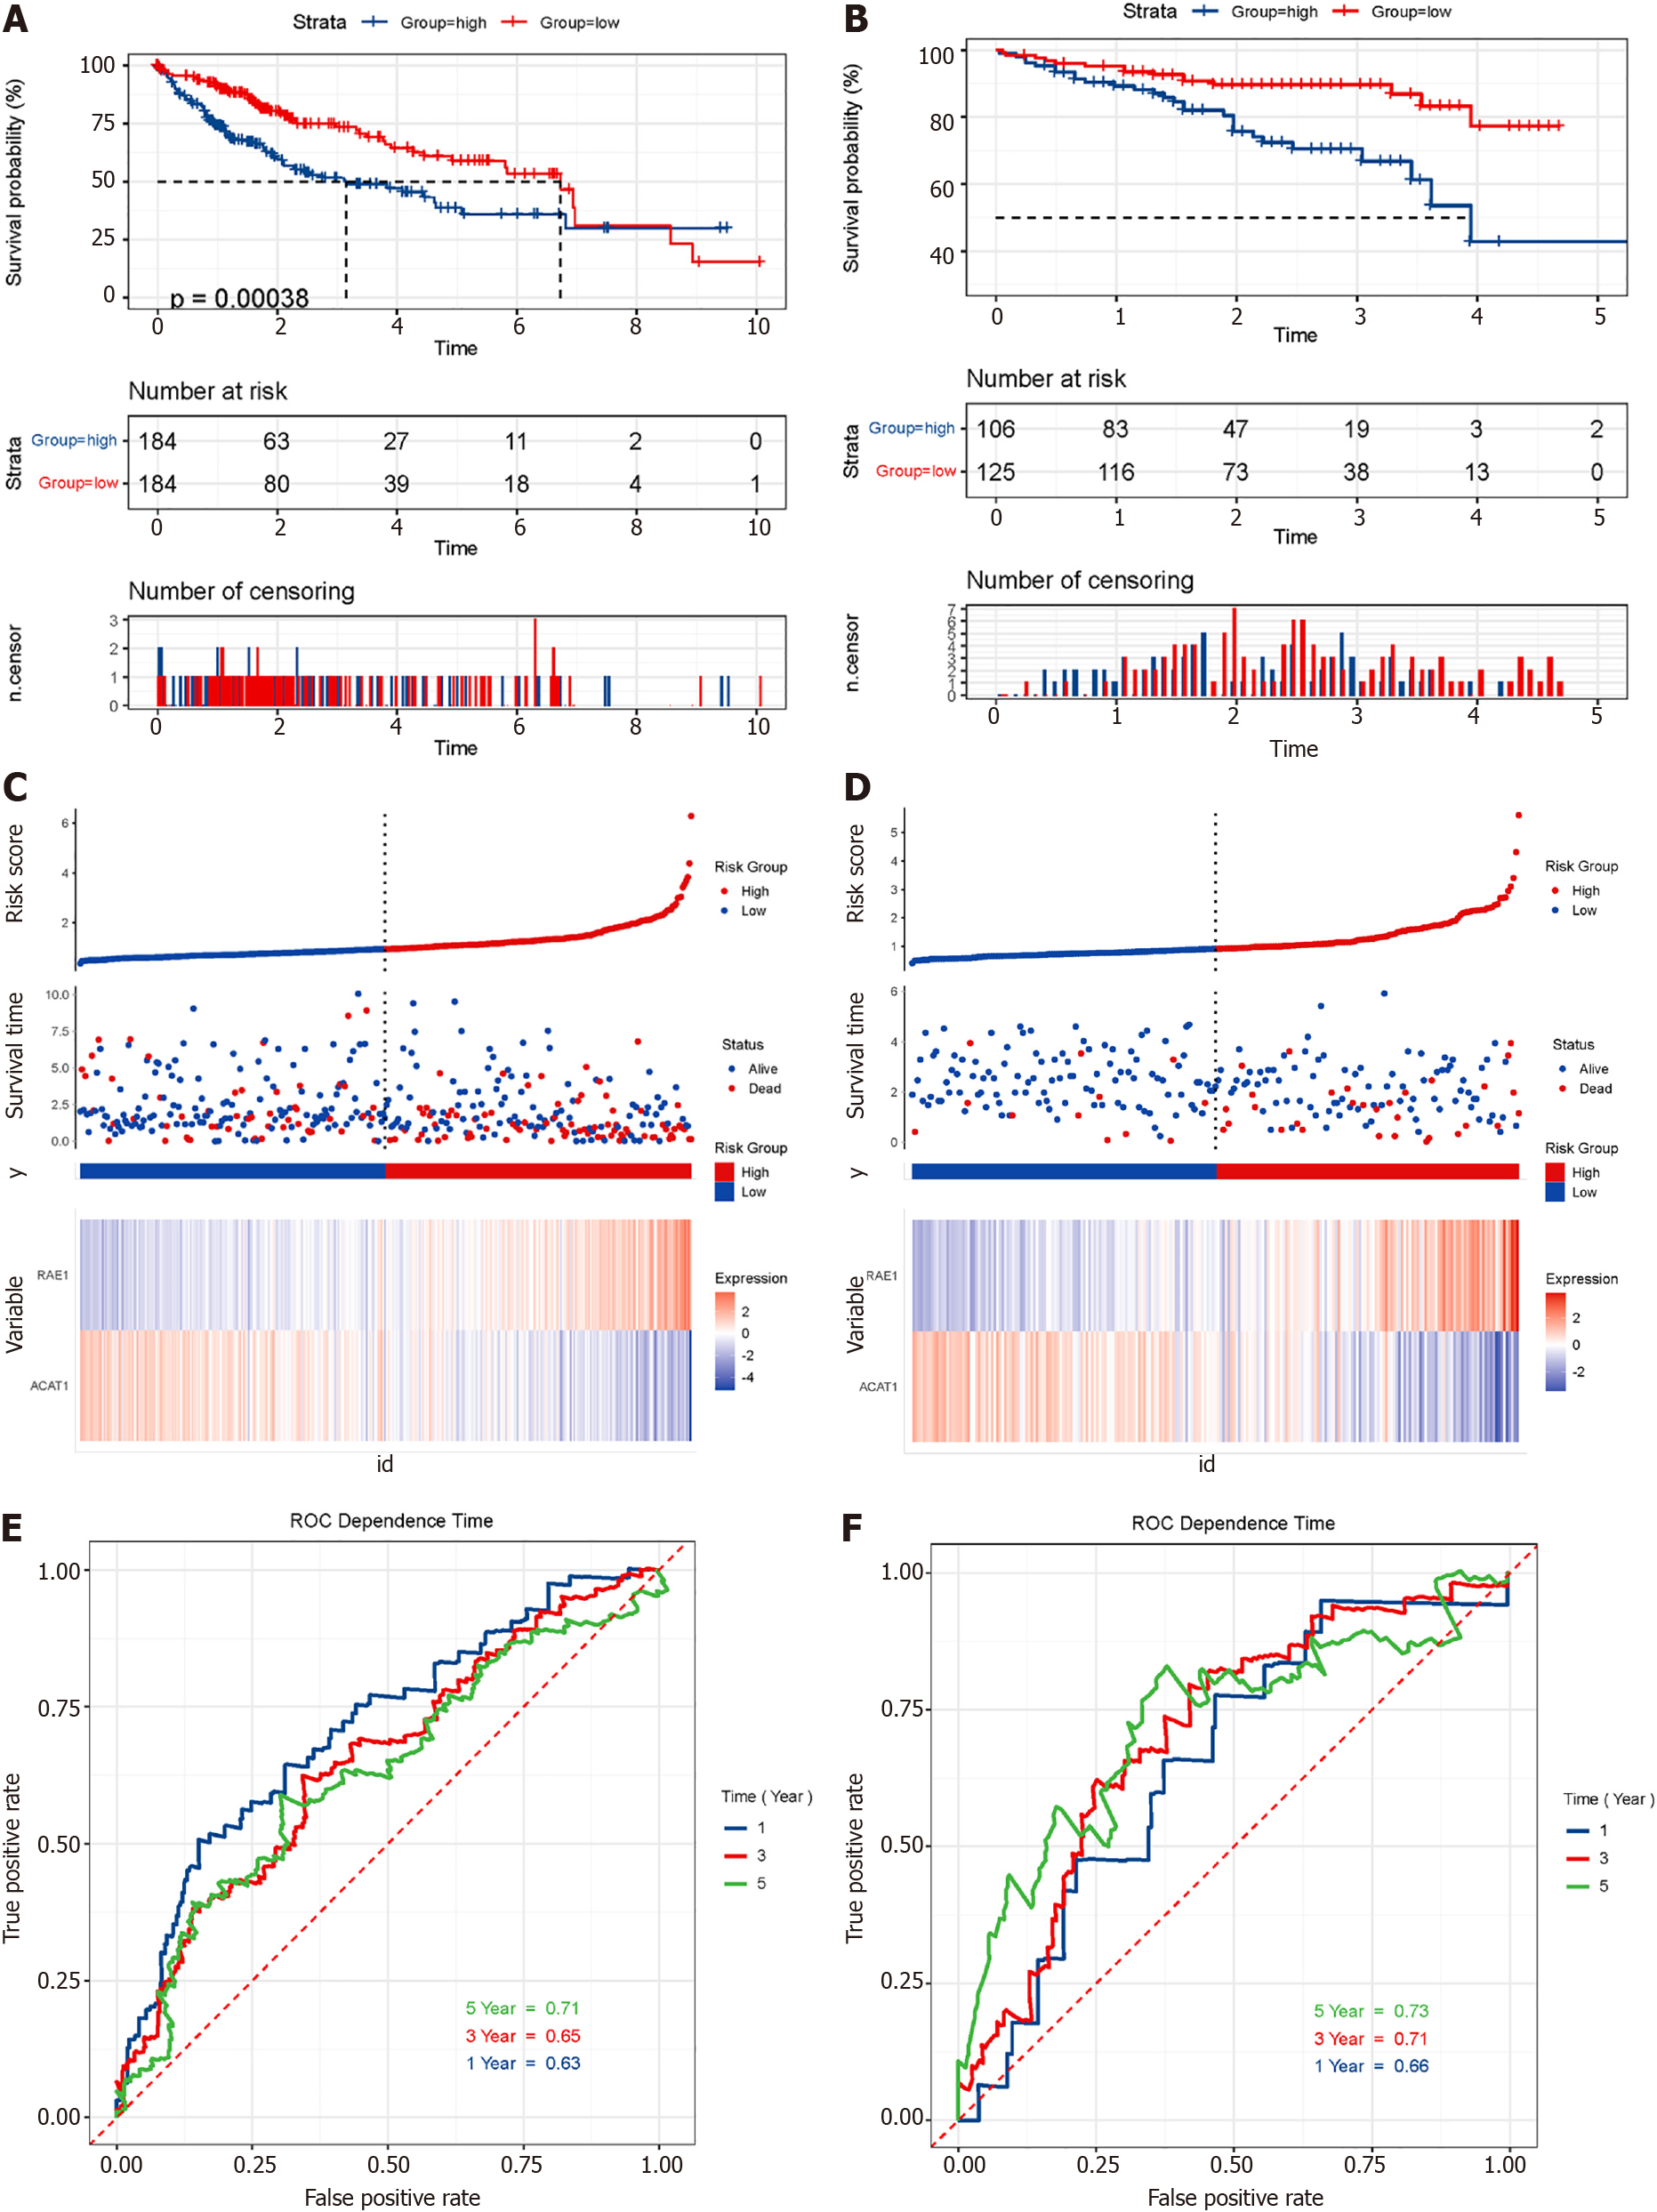
We combined the clinical data of the sample and used univariate Cox regression analysis and Lasso Cox regression to reduce the dimensionality. We learned that when λ = 0.0354467, four modelling genes were obtained (Figure 10A and B). Combined with multivariate Cox regression analysis, two final modelling genes, ACAT1 and RAE1, were obtained (P < 0.05) (Figure 10C). The survival curve and risk curve of the high and low-risk groups were plotted (Figure 11A-F); the ROC curve calculates the area under the curve of the model (Figure 11G-H).
In accordance with all significant independent indicators (staging, gender, age, and risk score), a prognostic nomogram was established through Cox regression model analysis (normal chart of disease survival specificity between 1 year and 3 years) (Figure 12A). Each factor in the nomogram was assigned a weighted point. In the DCA of liver cancer patients, the risk model combined with the clinical model had the highest net benefit in predicting the prognosis of the patient, followed by the risk prediction model, and finally the clinical model (Figure 12B-E).
From this, we infer that the predictive model is associated with the traditional clinical staging model and can be combined with the traditional model to further optimise the prognostic assessment ability.
In recent years, with in-depth research on HCC, many classification methods based on transcriptome expression have been proposed, but no consensus has been reached on classification methods of molecular taxonomy. In order to study the influence and reasons for metabolism on the prognosis of HCC, this study used public databases to screen glycolytic and FAO metabolic genes and identified four subgroups (Glycolysis group, FAO group, Quiescent group, and Mixed group). We then explored the differences between subgroups in survival, clinical characteristics, immune infiltration, SNP, transcriptome characteristics, and drug sensitivity.
Tumours have a specific microenvironment in which not only immune cells, but also metabolic pathways are affected. These changes promote the progression of cancer. In some tumours, the enhancement of glycolysis properties corresponds to a higher degree of malignancy[12]. In the case of normal oxygen content, due to the 'Warburg effect', tumour cells will still metabolise glucose into lactic acid in large amounts[13]. This biological behaviour in preferential use of glycolysis makes malignant tumour cells more adaptable in hypoxic and acidic environments[14,15]. It is still unknown what role mitochondrial fatty acid β-oxidation plays in cancer as one vital source of ATP[13].
In addition to ATP, FAO participates in the production of cytoplasmic nicotinamide adenine dinucleotide phosphate[16], which improves the reduction ability to support biosynthesis and counteract oxidative stress. This alleviates the necrosis caused by hypoxia in the environment to a certain extent and alleviates immunosuppression in the microenvironment of HCC. Enhanced FAO metabolism has been shown to increase the effects of Dexamethasone[17], L-asparagine, Imatinib, Rapamycin[18,19], Cytarabine[20], and Tamoxifen[21].
Although the glycolytic group has more tumour-killing cells, including NK cells, CD4T cells, etc, it does not lead to better clinical outcomes. On the one hand, it could be because regulatory T cells that promote immune escape are also more abundant, while on the other, it may be due to reactive oxygen species (ROS). ROS interferes with the DNA repair system responsible for removing DNA oxidation bases and other mechanisms, triggering metabolic changes, especially glycolytic adaptation and lipid biosynthesis enhancement. The latter advances steatosis, which in turn promotes the occurrence of liver cancer[22,23]. ROS has multiple roles in the activation and regulation of T cells in the microenvironment. High levels of ROS in tumour microenvironment can inhibit T cell proliferation and anti-tumour function or even lead to low T cell reactivity in cancer patients[24].
CTNNB1 dominates the FAO mutations, indicating that it can also benefit from targeted inhibitors of the Wnt signalling pathway. About 11%-41% of HCC have an activating mutation of CTNNB1[25], which can activate the WNT pathway. The activation of the Wnt/β-catenin signalling pathway is the best-characterised pathway for the occurrence of HCC[26]. TP53 plays an important role in stabilising the genome. Mutations in this gene may cause chromosomal mutations and abnormal cell proliferation[27]. It also promotes tumourigenesis[28]. In comparison, HCC patients with more TP53 mutations have a worse prognosis, and their immune responses are also quite different[29,30].
The TIDE algorithm shows that patients in the FAO group respond better to anti-PD1 immunotherapy than patients in the glycolytic group. This discovery provides a new idea for guiding the individualised clinical treatment of HCC patients. Non-alcoholic steatohepatitis (NASH) induced HCC predicts a worse response to ICB in patients[31]. Insulin resistance in patients with NASH is an important metabolic feature, which can lead to an elevation of glycogenolysis and an increase in hepatic glycolytic intermediates, resulting in the promotion of glycolysis. At the same time, the expression if FAO-related genes decreases, and triglyceride increases in patients with NASH. This is also consistent with our finding that the benefit of ICB treatment was lower in the glycolytic group. Based on the analysis of the results predicted by Genomics of Drug Sensitivity in Cancer, we speculate that the FAO group is more sensitive to anti-cancer drugs. This shows that the heterogeneity of tumour metabolic characteristics will have different effects on immunotherapy or anti-cancer drugs. Glycolysis promotes tumour progression, immune escape, and drug resistance[32]. In cervical cancer and colon cancer, pyruvate dehydrogenase kinase isoforms and increased aerobic lactic acid production (glycolysis) have been shown to increase tumour resistance[33,34]. Under the synergistic effect of the key enzyme inhibitors of the glycolytic pathway like the targeted enzymes hexokinase 2 and glyceraldehyde-3-phosphate dehydrogenase, the effects of clinical anti-tumour drugs, that include Paclitaxel, Doxorubicin, etc have been significantly enhanced[35,36].
Furthermore, in the prognosis model established based on metabolic genes, the prediction results of the low-risk group for the above-mentioned treatment are also significantly better than the high-risk group. This may be related to the expression of the modelling gene RAE1. RAE1 has been confirmed to be related to distant metastasis of tumours and constitutes an independent poor prognostic factor. RAE1 inhibits apoptosis by stabilising the bipolar spindle in tumour cells and, at the same time, can increase the stability of bipolar spindle cells and improve the resistance to paclitaxel. Promotion of tumour growth and induction of resistance to anti-cancer drugs can occur by inhibiting apoptosis and promoting cell cycle progression[37].
Our model not only has better prognostic ability, but it can guide the clinical treatment plan. Since our research results come from bioinformatics analysis, further clinical studies are needed to confirm these results.
Through grouping, we obtained metabolic groups with obvious biological differences. Among them, the Glycolytic group had a poor prognosis, which was also verified by subsequent tumour microenvironment, SNP, and copy number variation analysis. Through TIDE analysis, we found that the enhancement of glycolytic metabolism leads to tumour resistance to ICB therapy and clinical anti-cancer drugs. By inhibiting key enzymes in the glycolytic pathway, the efficacy of anti-cancer drugs can be enhanced.
Metabolic reprogramming is a feature of tumour cells and is essential to support their rapid proliferation. Lipid metabolism reprogramming enables tumour cells to meet their needs for highly proliferative growth and is an important driving force for the development of hepatocellular carcinoma (HCC).
We explored the influence of different metabolic subtypes of HCC and analysed their significance in guiding prognosis and treatment based on the molecular mechanism of glycolysis and fatty acid oxidation (FAO).
To explore the influence of different metabolic subtypes of HCC and analyse their significance in guiding prognosis and treatment.
We utilised unsupervised consensus clustering to divide the Cancer Genome Atlas-liver hepatocellular carcinoma samples into four metabolic subgroups and compared single nucleotide polymorphism, copy number variation, tumour microenvironment, and Genomics of Drug Sensitivity in Cancer and Tumour Immune Dysfunction and Exclusion between different metabolites. In addition, we established a prognostic model based on glycolysis and FAO genes.
We established a prognostic model and found that the fatty acid oxidation group and the low-risk group had better efficacy and response to immune checkpoint blockade treatment and anti-tumour drugs.
There are obvious differences in genes, chromosomes, and clinical characteristics between metabolic subgroups.
The establishment of a prognostic model could predict patient prognosis and guide clinical treatment.
Provenance and peer review: Unsolicited article; Externally peer reviewed.
Peer-review model: Single blind
Specialty type: Biotechnology and applied microbiology
Country/Territory of origin: China
Peer-review report’s scientific quality classification
Grade A (Excellent): 0
Grade B (Very good): B
Grade C (Good): C, C, C
Grade D (Fair): 0
Grade E (Poor): 0
P-Reviewer: Fekaj E, Kosovo; Samant H, United States; Zhang X, United States S-Editor: Zhang H L-Editor: Filipodia P-Editor: Chen YX
| 1. | Lévy L, Renard CA, Wei Y, Buendia MA. Genetic alterations and oncogenic pathways in hepatocellular carcinoma. Ann N Y Acad Sci. 2002;963:21-36. [RCA] [PubMed] [DOI] [Full Text] [Cited by in Crossref: 44] [Cited by in RCA: 45] [Article Influence: 1.9] [Reference Citation Analysis (0)] |
| 2. | Law CT, Wei L, Tsang FH, Chan CY, Xu IM, Lai RK, Ho DW, Lee JM, Wong CC, Ng IO, Wong CM. HELLS Regulates Chromatin Remodeling and Epigenetic Silencing of Multiple Tumor Suppressor Genes in Human Hepatocellular Carcinoma. Hepatology. 2019;69:2013-2030. [RCA] [PubMed] [DOI] [Full Text] [Cited by in Crossref: 50] [Cited by in RCA: 57] [Article Influence: 8.1] [Reference Citation Analysis (0)] |
| 3. | He Y, Dang Q, Li J, Zhang Q, Yu X, Xue M, Guo W. Prediction of hepatocellular carcinoma prognosis based on expression of an immune-related gene set. Aging (Albany NY). 2020;12:965-977. [RCA] [PubMed] [DOI] [Full Text] [Full Text (PDF)] [Cited by in Crossref: 28] [Cited by in RCA: 30] [Article Influence: 5.0] [Reference Citation Analysis (0)] |
| 4. | Strickland M, Stoll EA. Metabolic Reprogramming in Glioma. Front Cell Dev Biol. 2017;5:43. [RCA] [PubMed] [DOI] [Full Text] [Full Text (PDF)] [Cited by in Crossref: 171] [Cited by in RCA: 254] [Article Influence: 28.2] [Reference Citation Analysis (0)] |
| 5. | Eason K, Sadanandam A. Molecular or Metabolic Reprograming: What Triggers Tumor Subtypes? Cancer Res. 2016;76:5195-5200. [RCA] [PubMed] [DOI] [Full Text] [Cited by in Crossref: 23] [Cited by in RCA: 26] [Article Influence: 2.9] [Reference Citation Analysis (0)] |
| 6. | Sukumar M, Kishton RJ, Restifo NP. Metabolic reprograming of anti-tumor immunity. Curr Opin Immunol. 2017;46:14-22. [RCA] [PubMed] [DOI] [Full Text] [Cited by in Crossref: 76] [Cited by in RCA: 75] [Article Influence: 8.3] [Reference Citation Analysis (0)] |
| 7. | Xu F, Yan JJ, Gan Y, Chang Y, Wang HL, He XX, Zhao Q. miR-885-5p Negatively Regulates Warburg Effect by Silencing Hexokinase 2 in Liver Cancer. Mol Ther Nucleic Acids. 2019;18:308-319. [RCA] [PubMed] [DOI] [Full Text] [Full Text (PDF)] [Cited by in Crossref: 38] [Cited by in RCA: 61] [Article Influence: 8.7] [Reference Citation Analysis (0)] |
| 8. | Schulze A, Harris AL. How cancer metabolism is tuned for proliferation and vulnerable to disruption. Nature. 2012;491:364-373. [RCA] [PubMed] [DOI] [Full Text] [Cited by in Crossref: 651] [Cited by in RCA: 741] [Article Influence: 52.9] [Reference Citation Analysis (0)] |
| 9. | Currie E, Schulze A, Zechner R, Walther TC, Farese RV Jr. Cellular fatty acid metabolism and cancer. Cell Metab. 2013;18:153-161. [RCA] [PubMed] [DOI] [Full Text] [Cited by in Crossref: 1209] [Cited by in RCA: 1659] [Article Influence: 127.6] [Reference Citation Analysis (0)] |
| 10. | Li J, Guo Y, Duan L, Hu X, Zhang X, Hu J, Huang L, He R, Hu Z, Luo W, Tan T, Huang R, Liao D, Zhu YS, Luo DX. AKR1B10 promotes breast cancer cell migration and invasion via activation of ERK signaling. Oncotarget. 2017;8:33694-33703. [RCA] [PubMed] [DOI] [Full Text] [Full Text (PDF)] [Cited by in Crossref: 71] [Cited by in RCA: 79] [Article Influence: 8.8] [Reference Citation Analysis (0)] |
| 11. | DeBerardinis RJ, Thompson CB. Cellular metabolism and disease: what do metabolic outliers teach us? Cell. 2012;148:1132-1144. [RCA] [PubMed] [DOI] [Full Text] [Cited by in Crossref: 616] [Cited by in RCA: 632] [Article Influence: 45.1] [Reference Citation Analysis (0)] |
| 12. | Shibao S, Minami N, Koike N, Fukui N, Yoshida K, Saya H, Sampetrean O. Metabolic heterogeneity and plasticity of glioma stem cells in a mouse glioblastoma model. Neuro Oncol. 2018;20:343-354. [RCA] [PubMed] [DOI] [Full Text] [Cited by in Crossref: 41] [Cited by in RCA: 67] [Article Influence: 9.6] [Reference Citation Analysis (0)] |
| 13. | Vander Heiden MG, Cantley LC, Thompson CB. Understanding the Warburg effect: the metabolic requirements of cell proliferation. Science. 2009;324:1029-1033. [RCA] [PubMed] [DOI] [Full Text] [Full Text (PDF)] [Cited by in Crossref: 12491] [Cited by in RCA: 12249] [Article Influence: 720.5] [Reference Citation Analysis (0)] |
| 14. | Al Tameemi W, Dale TP, Al-Jumaily RMK, Forsyth NR. Hypoxia-Modified Cancer Cell Metabolism. Front Cell Dev Biol. 2019;7:4. [RCA] [PubMed] [DOI] [Full Text] [Full Text (PDF)] [Cited by in Crossref: 319] [Cited by in RCA: 373] [Article Influence: 53.3] [Reference Citation Analysis (0)] |
| 15. | Turdo A, Porcelli G, D'Accardo C, Franco SD, Verona F, Forte S, Giuffrida D, Memeo L, Todaro M, Stassi G. Metabolic Escape Routes of Cancer Stem Cells and Therapeutic Opportunities. Cancers (Basel). 2020;12. [RCA] [PubMed] [DOI] [Full Text] [Full Text (PDF)] [Cited by in Crossref: 13] [Cited by in RCA: 19] [Article Influence: 3.2] [Reference Citation Analysis (0)] |
| 16. | Pike LS, Smift AL, Croteau NJ, Ferrick DA, Wu M. Inhibition of fatty acid oxidation by etomoxir impairs NADPH production and increases reactive oxygen species resulting in ATP depletion and cell death in human glioblastoma cells. Biochim Biophys Acta. 2011;1807:726-734. [RCA] [PubMed] [DOI] [Full Text] [Cited by in Crossref: 296] [Cited by in RCA: 419] [Article Influence: 27.9] [Reference Citation Analysis (0)] |
| 17. | Tung S, Shi Y, Wong K, Zhu F, Gorczynski R, Laister RC, Minden M, Blechert AK, Genzel Y, Reichl U, Spaner DE. PPARα and fatty acid oxidation mediate glucocorticoid resistance in chronic lymphocytic leukemia. Blood. 2013;122:969-980. [RCA] [PubMed] [DOI] [Full Text] [Cited by in Crossref: 71] [Cited by in RCA: 79] [Article Influence: 6.1] [Reference Citation Analysis (0)] |
| 18. | Barger JF, Gallo CA, Tandon P, Liu H, Sullivan A, Grimes HL, Plas DR. S6K1 determines the metabolic requirements for BCR-ABL survival. Oncogene. 2013;32:453-461. [RCA] [PubMed] [DOI] [Full Text] [Full Text (PDF)] [Cited by in Crossref: 26] [Cited by in RCA: 28] [Article Influence: 2.0] [Reference Citation Analysis (0)] |
| 19. | Shinohara H, Kumazaki M, Minami Y, Ito Y, Sugito N, Kuranaga Y, Taniguchi K, Yamada N, Otsuki Y, Naoe T, Akao Y. Perturbation of energy metabolism by fatty-acid derivative AIC-47 and imatinib in BCR-ABL-harboring leukemic cells. Cancer Lett. 2016;371:1-11. [RCA] [PubMed] [DOI] [Full Text] [Cited by in Crossref: 32] [Cited by in RCA: 44] [Article Influence: 4.4] [Reference Citation Analysis (0)] |
| 20. | Farge T, Saland E, de Toni F, Aroua N, Hosseini M, Perry R, Bosc C, Sugita M, Stuani L, Fraisse M, Scotland S, Larrue C, Boutzen H, Féliu V, Nicolau-Travers ML, Cassant-Sourdy S, Broin N, David M, Serhan N, Sarry A, Tavitian S, Kaoma T, Vallar L, Iacovoni J, Linares LK, Montersino C, Castellano R, Griessinger E, Collette Y, Duchamp O, Barreira Y, Hirsch P, Palama T, Gales L, Delhommeau F, Garmy-Susini BH, Portais JC, Vergez F, Selak M, Danet-Desnoyers G, Carroll M, Récher C, Sarry JE. Chemotherapy-Resistant Human Acute Myeloid Leukemia Cells Are Not Enriched for Leukemic Stem Cells but Require Oxidative Metabolism. Cancer Discov. 2017;7:716-735. [RCA] [PubMed] [DOI] [Full Text] [Cited by in Crossref: 506] [Cited by in RCA: 684] [Article Influence: 76.0] [Reference Citation Analysis (0)] |
| 21. | Kitajima S, Yoshida A, Kohno S, Li F, Suzuki S, Nagatani N, Nishimoto Y, Sasaki N, Muranaka H, Wan Y, Thai TC, Okahashi N, Matsuda F, Shimizu H, Nishiuchi T, Suzuki Y, Tominaga K, Gotoh N, Suzuki M, Ewen ME, Barbie DA, Hirose O, Tanaka T, Takahashi C. The RB-IL-6 axis controls self-renewal and endocrine therapy resistance by fine-tuning mitochondrial activity. Oncogene. 2017;36:5145-5157. [RCA] [PubMed] [DOI] [Full Text] [Cited by in Crossref: 24] [Cited by in RCA: 43] [Article Influence: 4.8] [Reference Citation Analysis (0)] |
| 22. | Ma-On C, Sanpavat A, Whongsiri P, Suwannasin S, Hirankarn N, Tangkijvanich P, Boonla C. Oxidative stress indicated by elevated expression of Nrf2 and 8-OHdG promotes hepatocellular carcinoma progression. Med Oncol. 2017;34:57. [RCA] [PubMed] [DOI] [Full Text] [Cited by in Crossref: 44] [Cited by in RCA: 60] [Article Influence: 6.7] [Reference Citation Analysis (0)] |
| 23. | Ivanov AV, Valuev-Elliston VT, Tyurina DA, Ivanova ON, Kochetkov SN, Bartosch B, Isaguliants MG. Oxidative stress, a trigger of hepatitis C and B virus-induced liver carcinogenesis. Oncotarget. 2017;8:3895-3932. [RCA] [PubMed] [DOI] [Full Text] [Full Text (PDF)] [Cited by in Crossref: 136] [Cited by in RCA: 132] [Article Influence: 14.7] [Reference Citation Analysis (0)] |
| 24. | Cemerski S, Cantagrel A, Van Meerwijk JP, Romagnoli P. Reactive oxygen species differentially affect T cell receptor-signaling pathways. J Biol Chem. 2002;277:19585-19593. [RCA] [PubMed] [DOI] [Full Text] [Cited by in Crossref: 96] [Cited by in RCA: 110] [Article Influence: 4.6] [Reference Citation Analysis (0)] |
| 25. | Guichard C, Amaddeo G, Imbeaud S, Ladeiro Y, Pelletier L, Maad IB, Calderaro J, Bioulac-Sage P, Letexier M, Degos F, Clément B, Balabaud C, Chevet E, Laurent A, Couchy G, Letouzé E, Calvo F, Zucman-Rossi J. Integrated analysis of somatic mutations and focal copy-number changes identifies key genes and pathways in hepatocellular carcinoma. Nat Genet. 2012;44:694-698. [RCA] [PubMed] [DOI] [Full Text] [Cited by in Crossref: 962] [Cited by in RCA: 1170] [Article Influence: 83.6] [Reference Citation Analysis (0)] |
| 26. | Hoshida Y, Nijman SM, Kobayashi M, Chan JA, Brunet JP, Chiang DY, Villanueva A, Newell P, Ikeda K, Hashimoto M, Watanabe G, Gabriel S, Friedman SL, Kumada H, Llovet JM, Golub TR. Integrative transcriptome analysis reveals common molecular subclasses of human hepatocellular carcinoma. Cancer Res. 2009;69:7385-7392. [RCA] [PubMed] [DOI] [Full Text] [Full Text (PDF)] [Cited by in Crossref: 956] [Cited by in RCA: 988] [Article Influence: 58.1] [Reference Citation Analysis (0)] |
| 27. | Rao CV, Asch AS, Yamada HY. Frequently mutated genes/pathways and genomic instability as prevention targets in liver cancer. Carcinogenesis. 2017;38:2-11. [RCA] [PubMed] [DOI] [Full Text] [Cited by in Crossref: 76] [Cited by in RCA: 97] [Article Influence: 9.7] [Reference Citation Analysis (0)] |
| 28. | Brosh R, Rotter V. When mutants gain new powers: news from the mutant p53 field. Nat Rev Cancer. 2009;9:701-713. [RCA] [PubMed] [DOI] [Full Text] [Cited by in Crossref: 811] [Cited by in RCA: 883] [Article Influence: 51.9] [Reference Citation Analysis (0)] |
| 29. | Liu J, Ma Q, Zhang M, Wang X, Zhang D, Li W, Wang F, Wu E. Alterations of TP53 are associated with a poor outcome for patients with hepatocellular carcinoma: evidence from a systematic review and meta-analysis. Eur J Cancer. 2012;48:2328-2338. [RCA] [PubMed] [DOI] [Full Text] [Full Text (PDF)] [Cited by in Crossref: 104] [Cited by in RCA: 108] [Article Influence: 7.7] [Reference Citation Analysis (0)] |
| 30. | Dong ZY, Zhong WZ, Zhang XC, Su J, Xie Z, Liu SY, Tu HY, Chen HJ, Sun YL, Zhou Q, Yang JJ, Yang XN, Lin JX, Yan HH, Zhai HR, Yan LX, Liao RQ, Wu SP, Wu YL. Potential Predictive Value of TP53 and KRAS Mutation Status for Response to PD-1 Blockade Immunotherapy in Lung Adenocarcinoma. Clin Cancer Res. 2017;23:3012-3024. [RCA] [PubMed] [DOI] [Full Text] [Cited by in Crossref: 444] [Cited by in RCA: 762] [Article Influence: 76.2] [Reference Citation Analysis (7)] |
| 31. | Feng Y, Zhang Y, Cai Y, Liu R, Lu M, Li T, Fu Y, Guo M, Huang H, Ou Y, Chen Y. A20 targets PFKL and glycolysis to inhibit the progression of hepatocellular carcinoma. Cell Death Dis. 2020;11:89. [RCA] [PubMed] [DOI] [Full Text] [Full Text (PDF)] [Cited by in Crossref: 33] [Cited by in RCA: 77] [Article Influence: 12.8] [Reference Citation Analysis (0)] |
| 32. | Lu CW, Lin SC, Chen KF, Lai YY, Tsai SJ. Induction of pyruvate dehydrogenase kinase-3 by hypoxia-inducible factor-1 promotes metabolic switch and drug resistance. J Biol Chem. 2008;283:28106-28114. [RCA] [PubMed] [DOI] [Full Text] [Cited by in Crossref: 215] [Cited by in RCA: 268] [Article Influence: 14.9] [Reference Citation Analysis (0)] |
| 33. | Fanciulli M, Bruno T, Giovannelli A, Gentile FP, Di Padova M, Rubiu O, Floridi A. Energy metabolism of human LoVo colon carcinoma cells: correlation to drug resistance and influence of lonidamine. Clin Cancer Res. 2000;6:1590-1597. [PubMed] |
| 34. | Maschek G, Savaraj N, Priebe W, Braunschweiger P, Hamilton K, Tidmarsh GF, De Young LR, Lampidis TJ. 2-deoxy-D-glucose increases the efficacy of adriamycin and paclitaxel in human osteosarcoma and non-small cell lung cancers in vivo. Cancer Res. 2004;64:31-34. [RCA] [PubMed] [DOI] [Full Text] [Cited by in Crossref: 335] [Cited by in RCA: 362] [Article Influence: 16.5] [Reference Citation Analysis (0)] |
| 35. | Dwarakanath B, Jain V. Targeting glucose metabolism with 2-deoxy-D-glucose for improving cancer therapy. Future Oncol. 2009;5:581-585. [RCA] [PubMed] [DOI] [Full Text] [Cited by in Crossref: 94] [Cited by in RCA: 102] [Article Influence: 6.0] [Reference Citation Analysis (0)] |
| 36. | Kobayashi Y, Masuda T, Fujii A, Shimizu D, Sato K, Kitagawa A, Tobo T, Ozato Y, Saito H, Kuramitsu S, Noda M, Otsu H, Mizushima T, Doki Y, Eguchi H, Mori M, Mimori K. Mitotic checkpoint regulator RAE1 promotes tumor growth in colorectal cancer. Cancer Sci. 2021;112:3173-3189. [RCA] [PubMed] [DOI] [Full Text] [Full Text (PDF)] [Cited by in Crossref: 3] [Cited by in RCA: 23] [Article Influence: 4.6] [Reference Citation Analysis (0)] |


