Copyright
©The Author(s) 2021.
World J Clin Cases. Dec 26, 2021; 9(36): 11300-11310
Published online Dec 26, 2021. doi: 10.12998/wjcc.v9.i36.11300
Published online Dec 26, 2021. doi: 10.12998/wjcc.v9.i36.11300
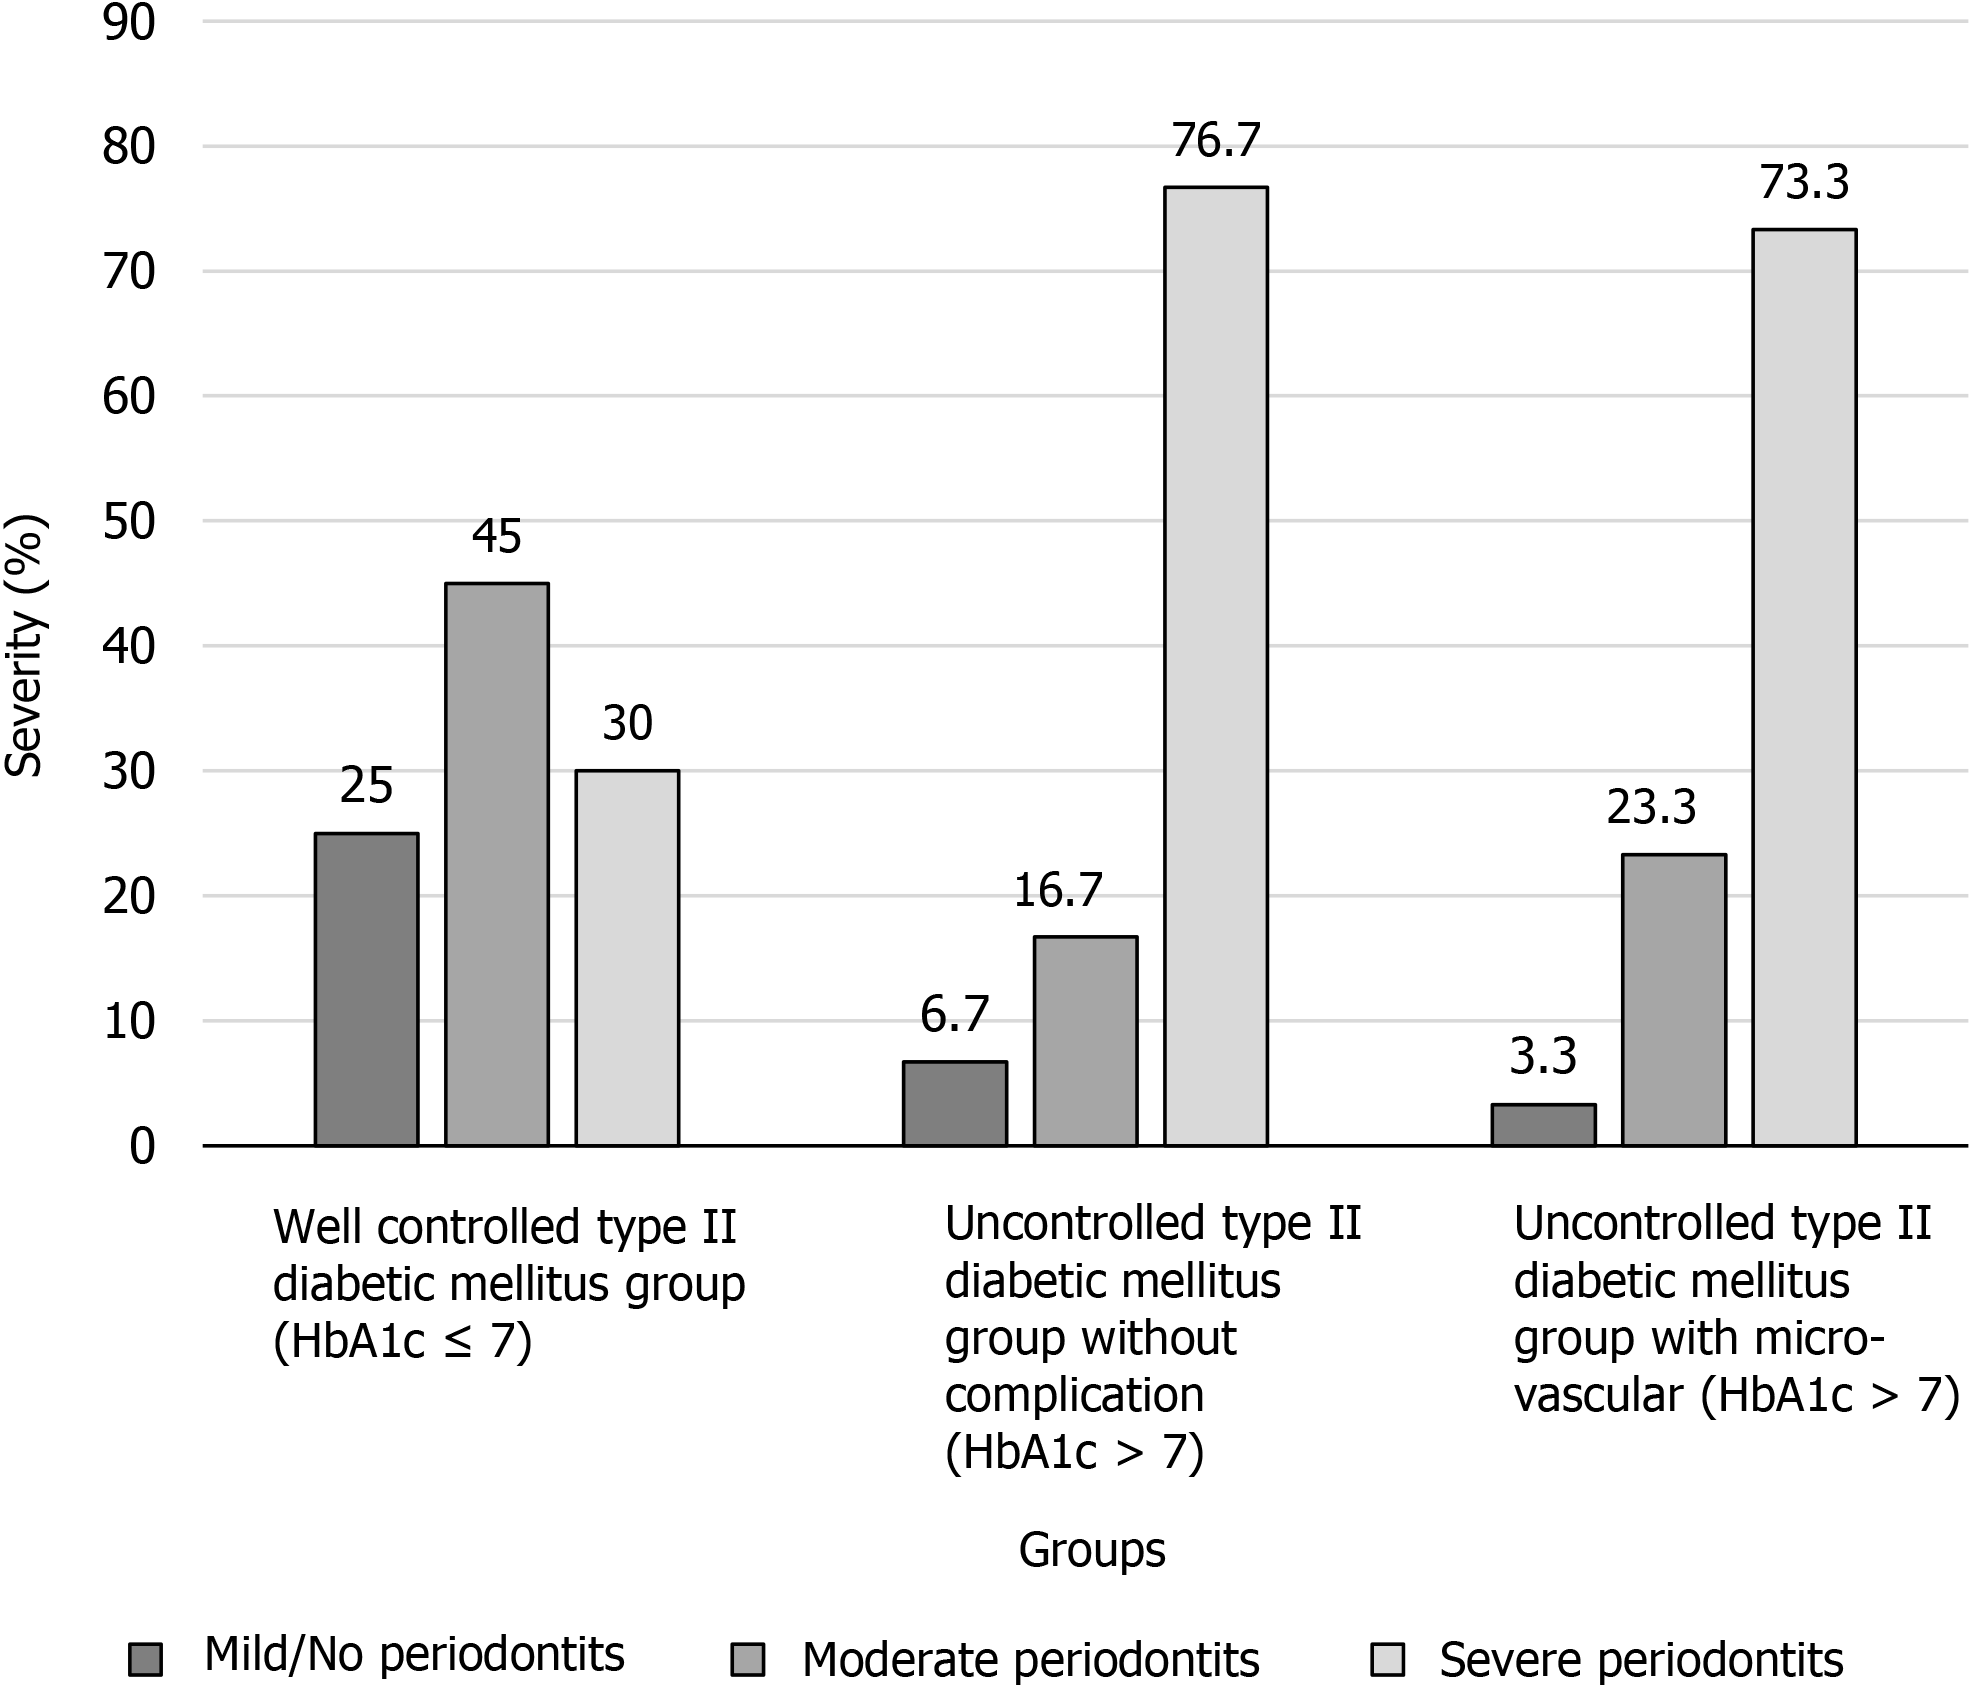
Figure 1 Proportion of periodontal disease severity among groups.
HbA1c: Hemoglobin A1c.
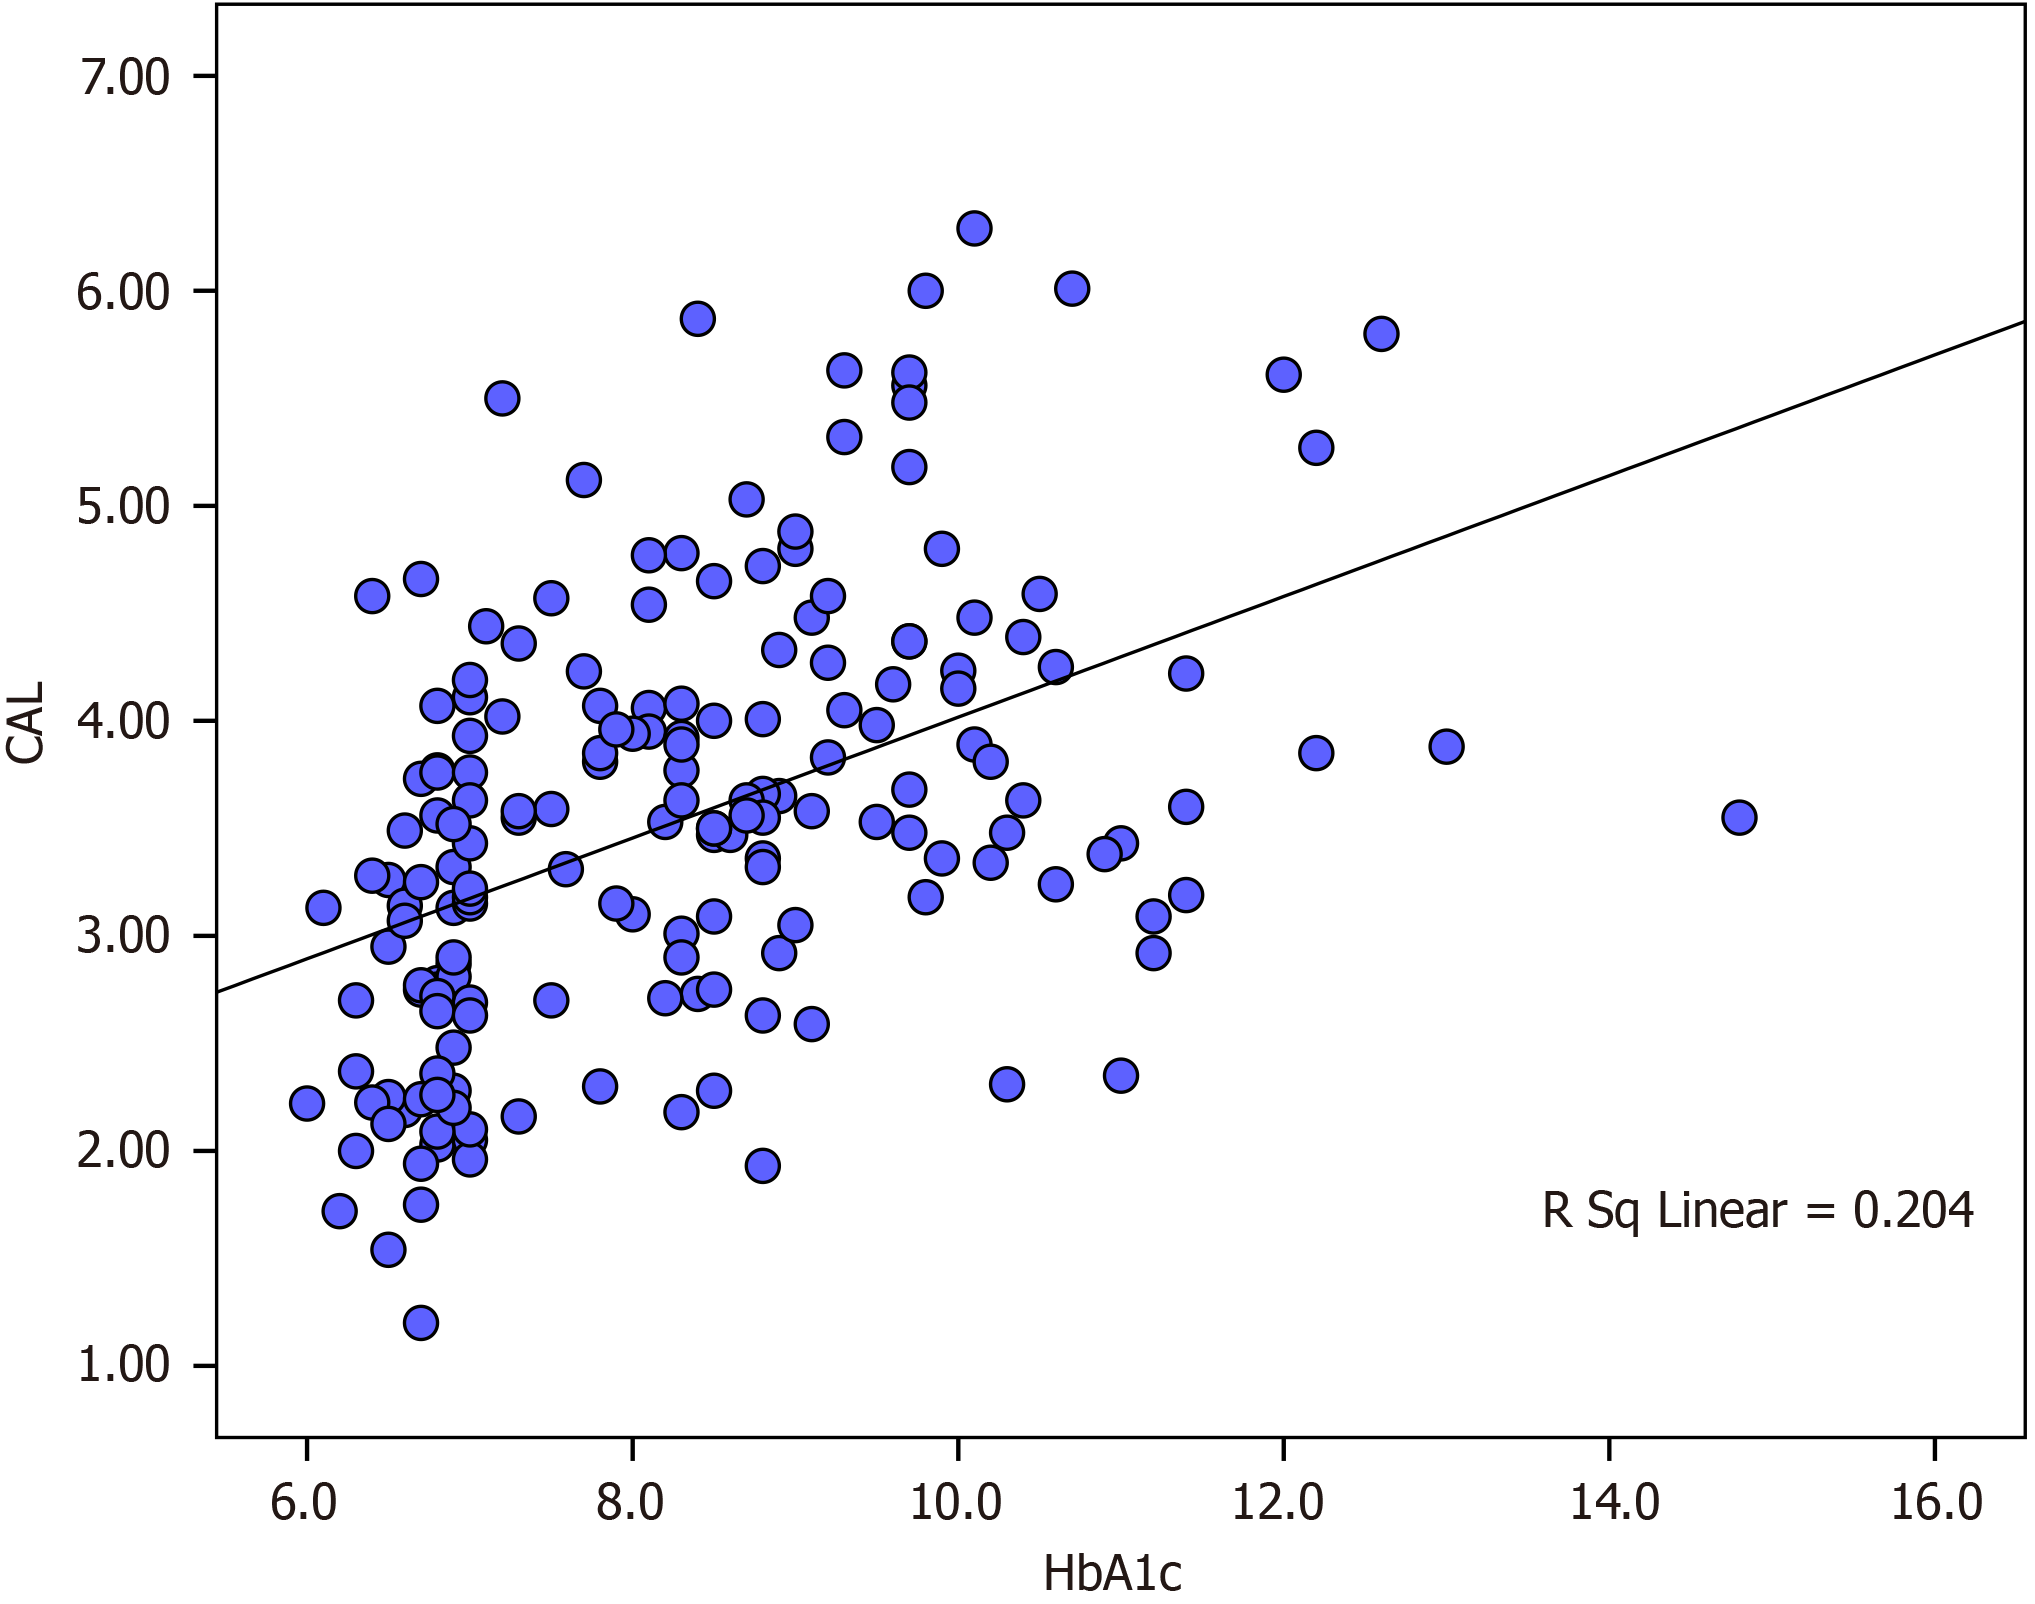
Figure 2 Correlation between clinical attachment loss and glycated HbA1c in well-controlled type 2 diabetes mellitus group, uncontrolled type 2 diabetes mellitus group without microvascular complications and uncontrolled type 2 diabetes mellitus group with microvascular complications.
A significant positive correlation existed between the mean clinical attachment loss and HbA1c (Pearson correlation coefficient: 0.451, P < 0.001). CAL: Clinical attachment loss; HbA1c: Hemoglobin A1c.
Figure 3 Correlation of periodontal inflamed surface area and HbA1c in well-controlled type 2 diabetes mellitus group, uncontrolled type 2 diabetes mellitus group without microvascular complications and uncontrolled type 2 diabetes mellitus group with microvascular complications.
A significant positive correlation existed between the periodontal inflamed surface area and HbA1c (Pearson correlation coefficient: 0.393, P < 0.001). PISA: Periodontal inflamed surface area; HbA1c: Hemoglobin A1c.
- Citation: Anil K, Vadakkekuttical RJ, Radhakrishnan C, Parambath FC. Correlation of periodontal inflamed surface area with glycemic status in controlled and uncontrolled type 2 diabetes mellitus. World J Clin Cases 2021; 9(36): 11300-11310
- URL: https://www.wjgnet.com/2307-8960/full/v9/i36/11300.htm
- DOI: https://dx.doi.org/10.12998/wjcc.v9.i36.11300


