Copyright
©The Author(s) 2021.
World J Clin Cases. Dec 26, 2021; 9(36): 11255-11264
Published online Dec 26, 2021. doi: 10.12998/wjcc.v9.i36.11255
Published online Dec 26, 2021. doi: 10.12998/wjcc.v9.i36.11255
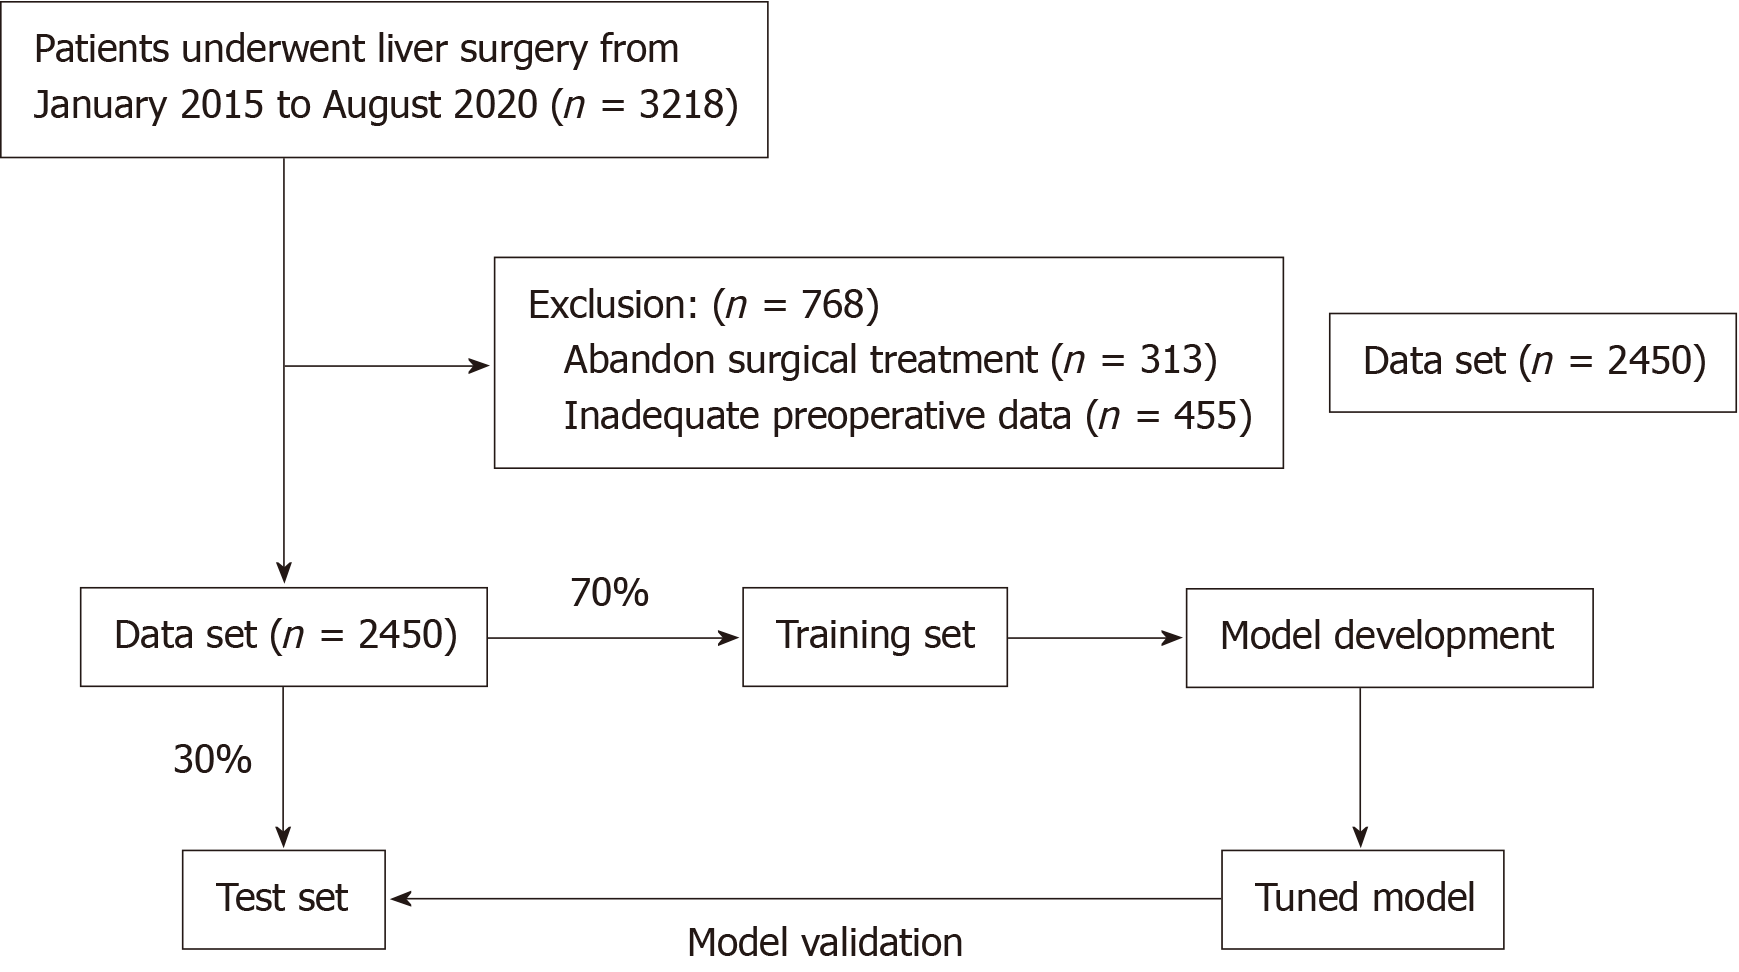
Figure 1 Patient selection and analysis.
The 3218 patients who underwent liver cancer resection were initially included. 768 patients were excluded based on exclusion criteria, and a total of 2450 patients were included in the study (data set). The data set was divided into a training set and test set. First, the model was applied to the training set for the modeling process and the parameters were debugged. Then, the model was validated in the test set.
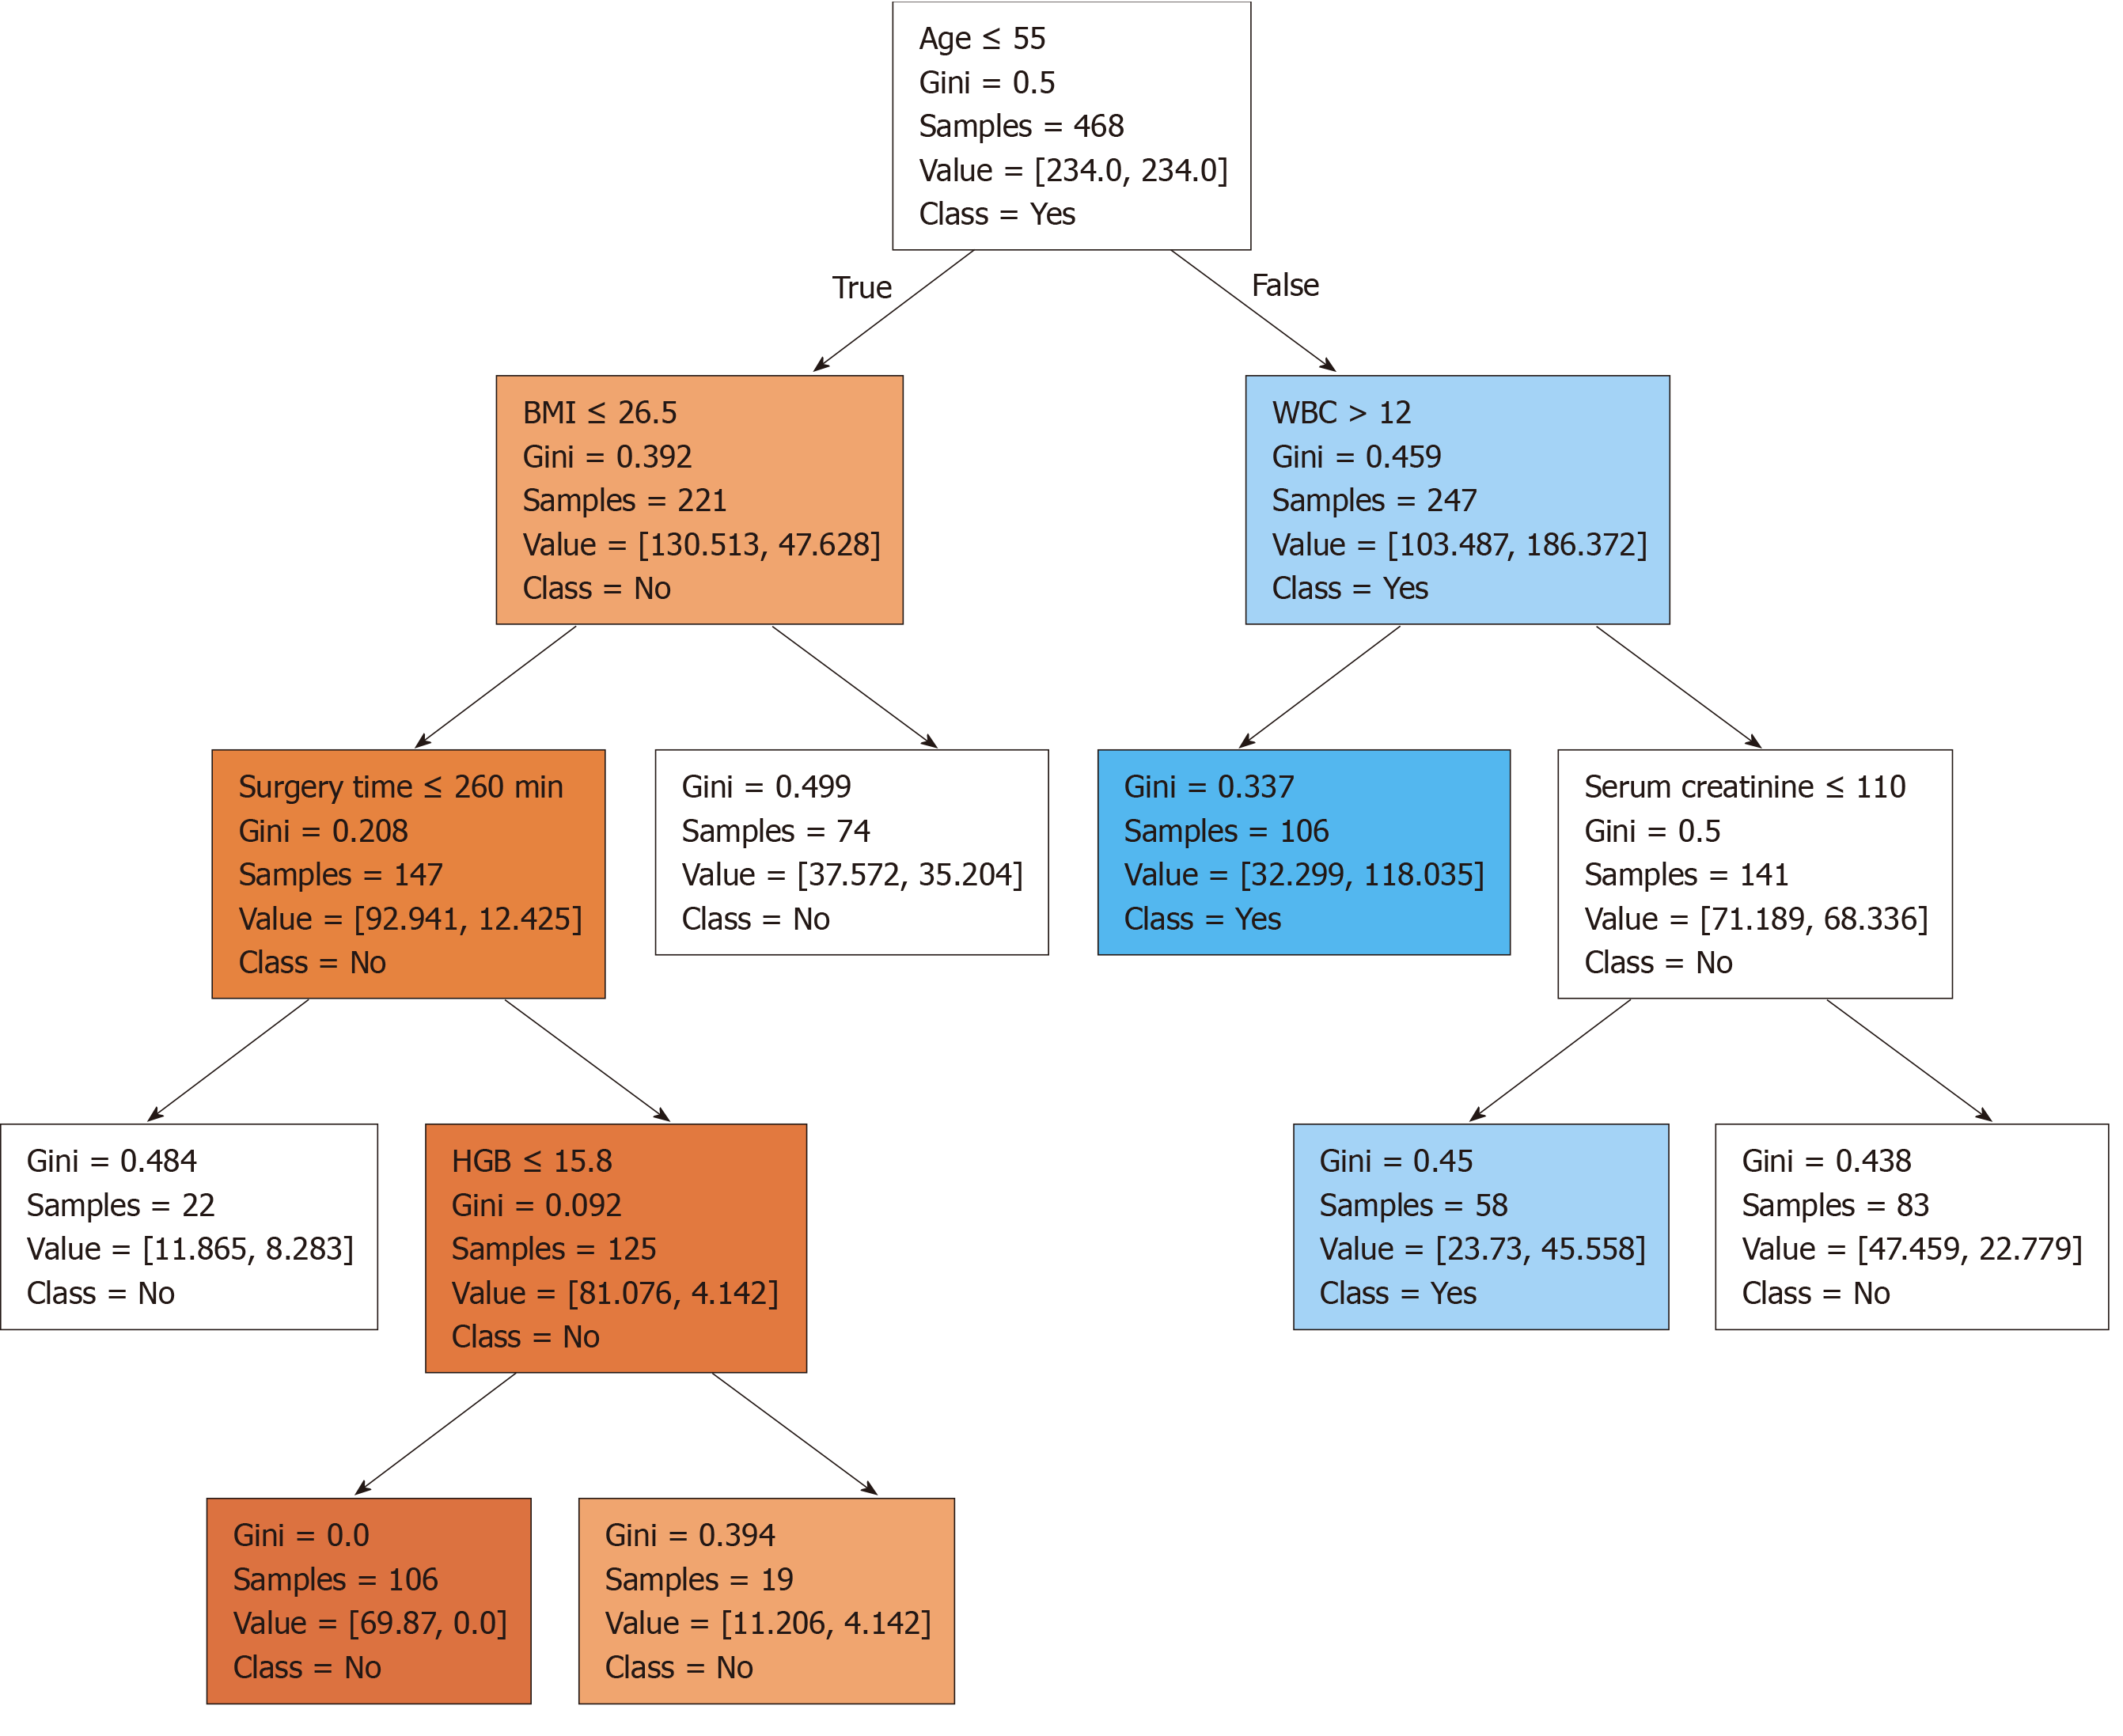
Figure 2 Tree-like algorithm.
Tree-like modelling can help analysis to reach the best prediction decision. Classification results for acute kidney injury (AKI) and non-AKI are shown in blue and orange, respectively. The smaller the Gini index, the darker the color. BMI: Body mass index; WBC: White blood cell; HGB: Hemoglobin.
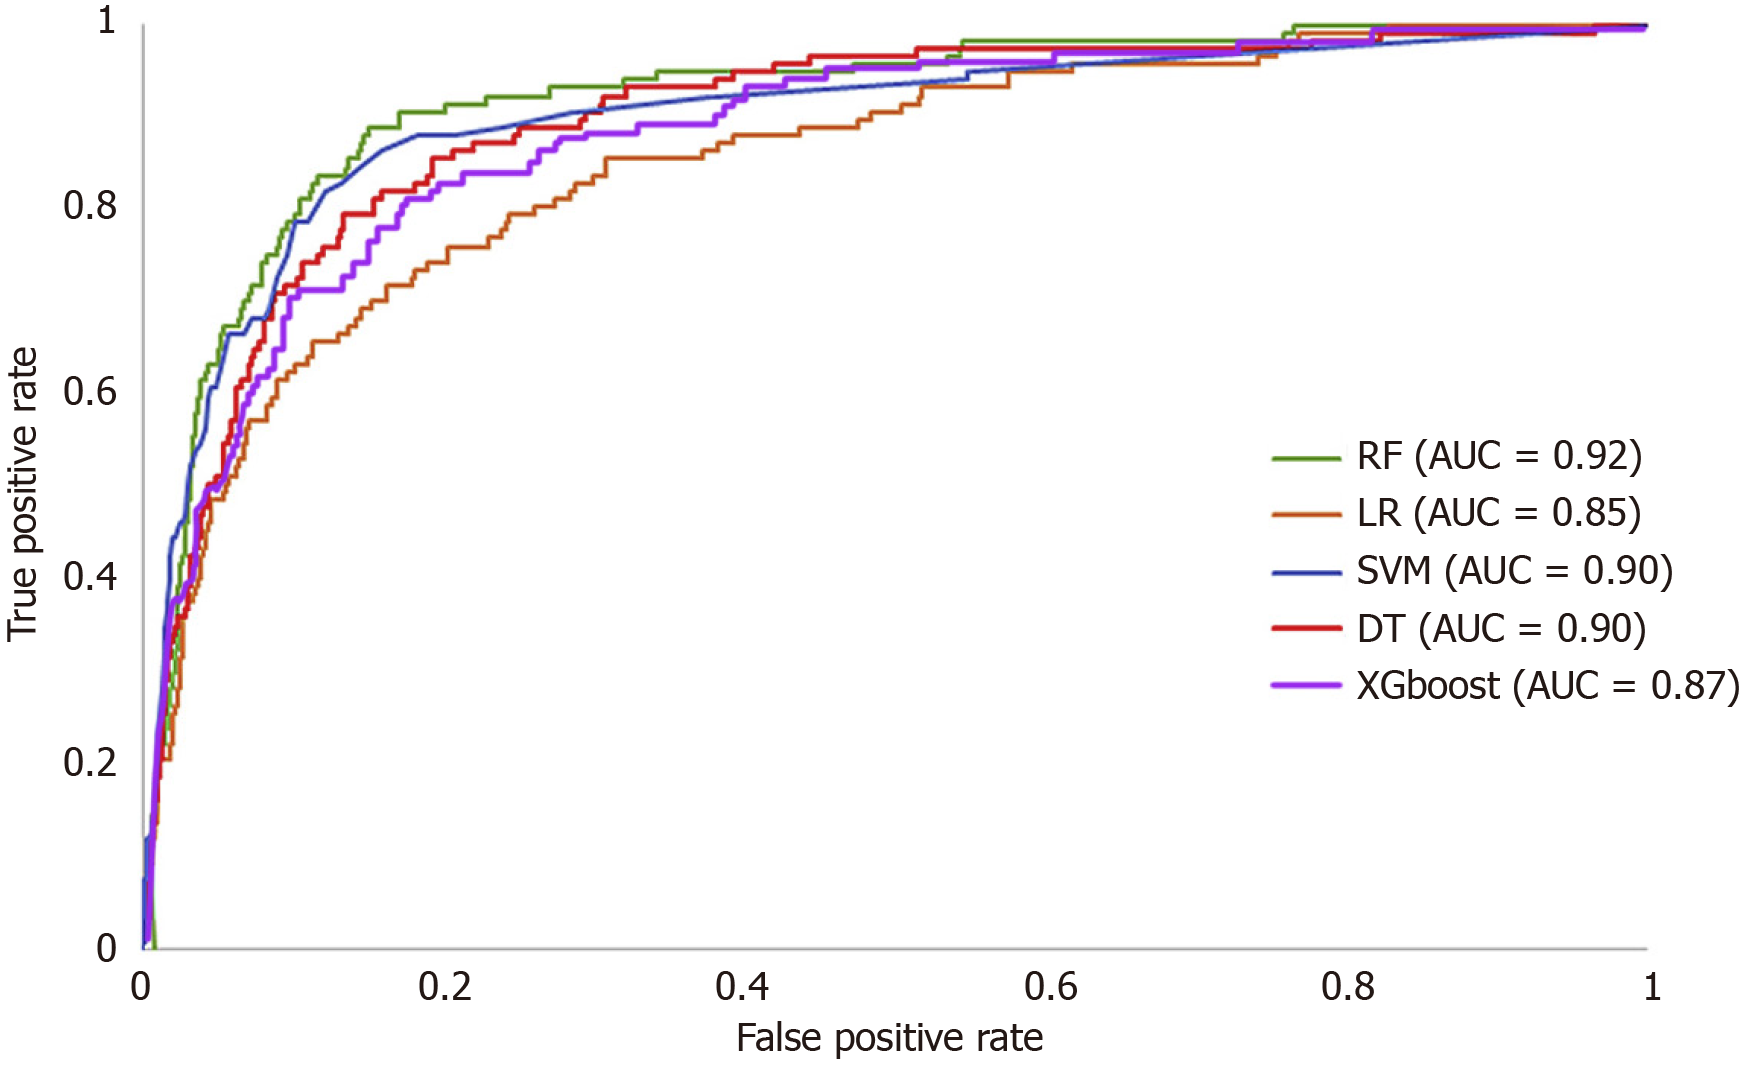
Figure 3 Areas under the receiver operating characteristic curve.
LR: Logistic regression; SVM: Support vector machine; RF: Random forest; XGboost: Extreme gradient boosting; DT: Decision tree; AUC: Area under the curve.
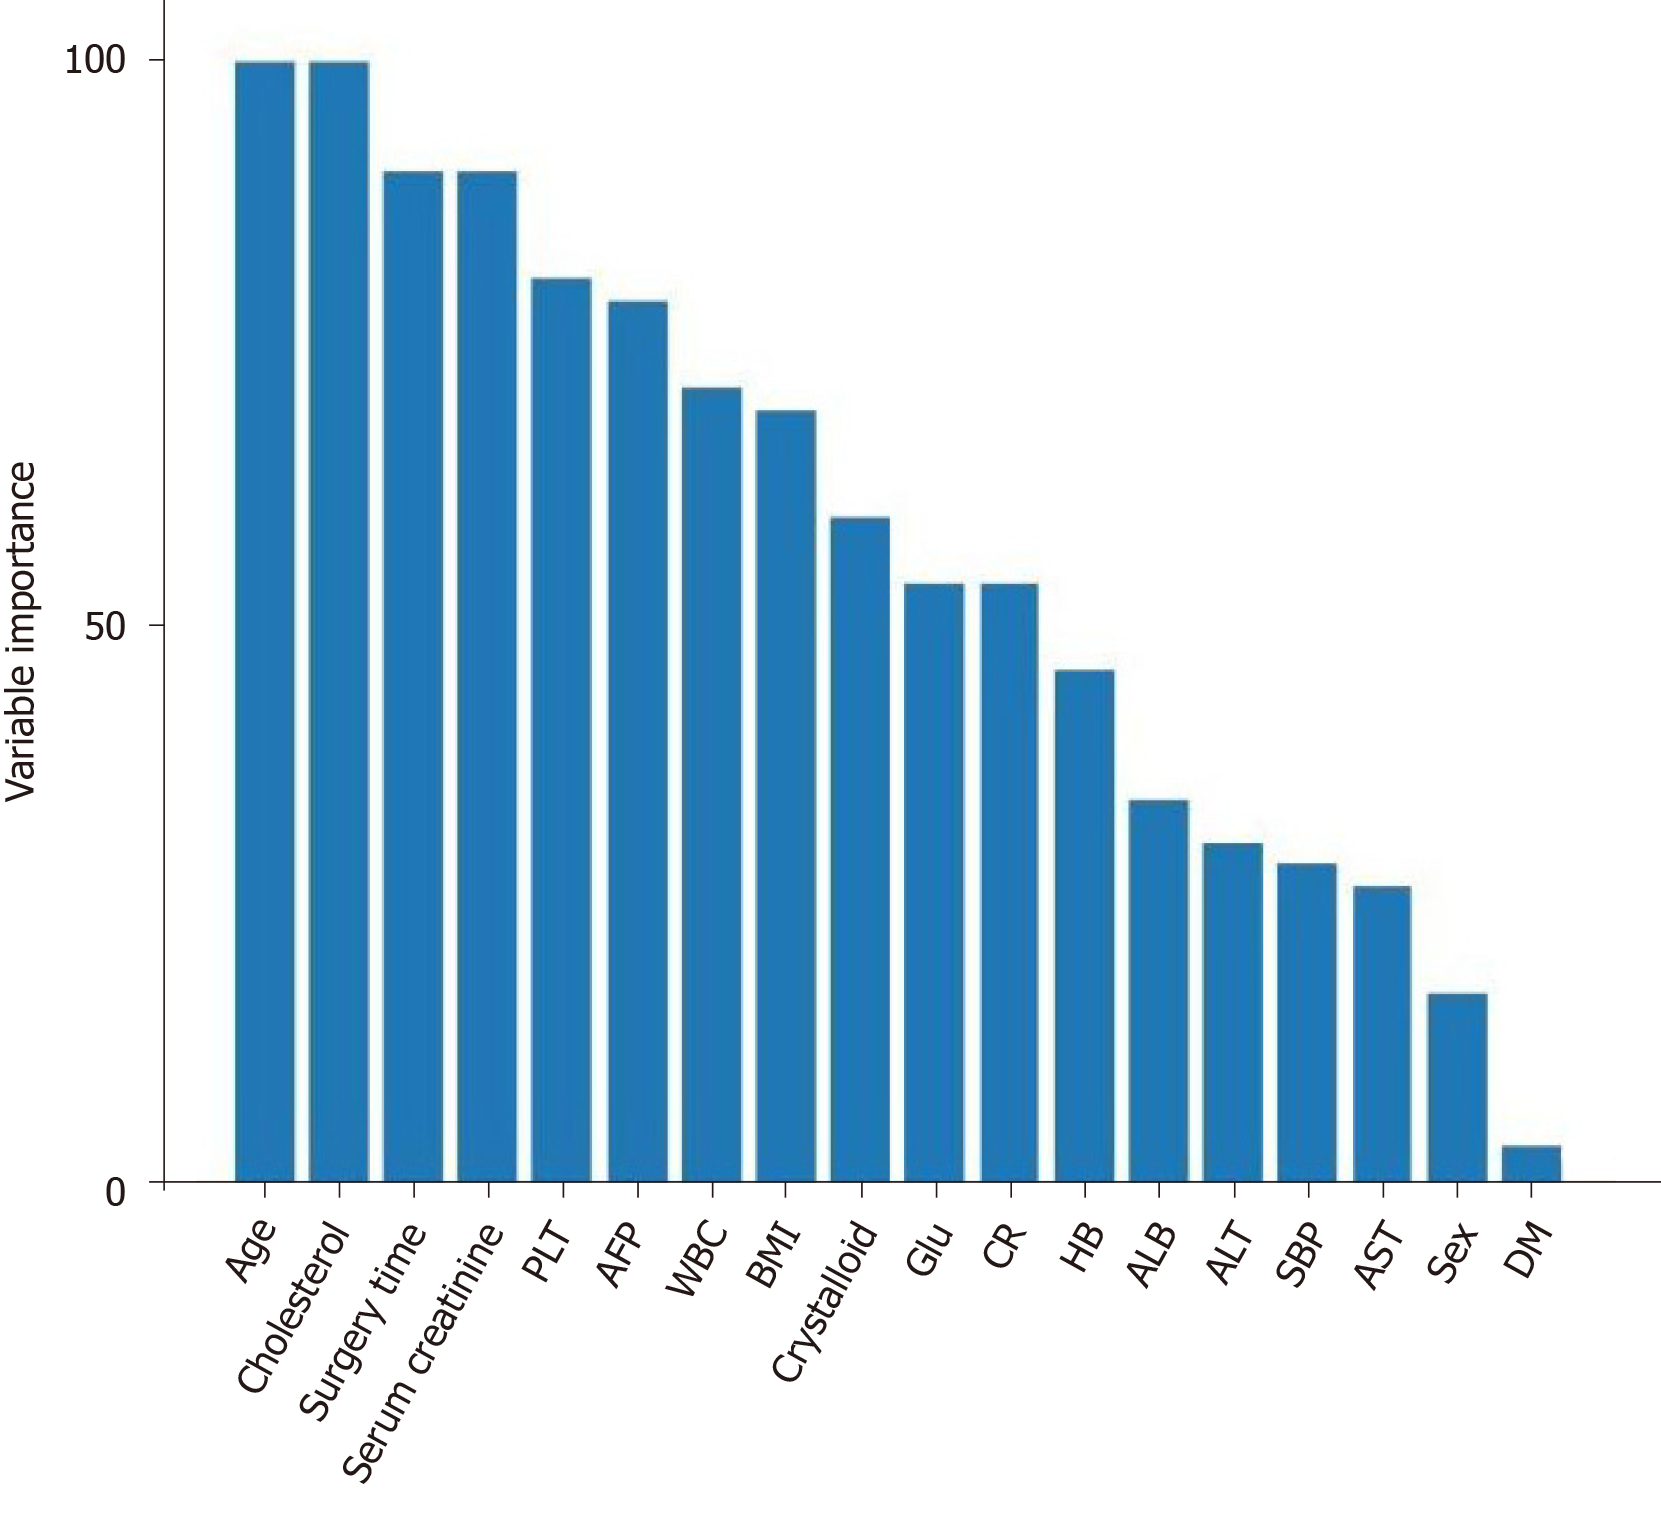
Figure 4 Ranked variable values of the random forest algorithm.
PLT: Platelet; AFP: Alpha-fetoprotein; WBC: White blood cell; BMI: Body mass index; CR: Creatinine clearance; HB: Hemoglobin; ALB: Albumin; ALT: Alanine aminotransferase; AST: Aspartate aminotransferase; SBP: Systolic blood pressure; DM: Diabetes mellitus.
- Citation: Dong JF, Xue Q, Chen T, Zhao YY, Fu H, Guo WY, Ji JS. Machine learning approach to predict acute kidney injury after liver surgery. World J Clin Cases 2021; 9(36): 11255-11264
- URL: https://www.wjgnet.com/2307-8960/full/v9/i36/11255.htm
- DOI: https://dx.doi.org/10.12998/wjcc.v9.i36.11255


