Copyright
©The Author(s) 2021.
World J Clin Cases. Nov 16, 2021; 9(32): 9731-9740
Published online Nov 16, 2021. doi: 10.12998/wjcc.v9.i32.9731
Published online Nov 16, 2021. doi: 10.12998/wjcc.v9.i32.9731
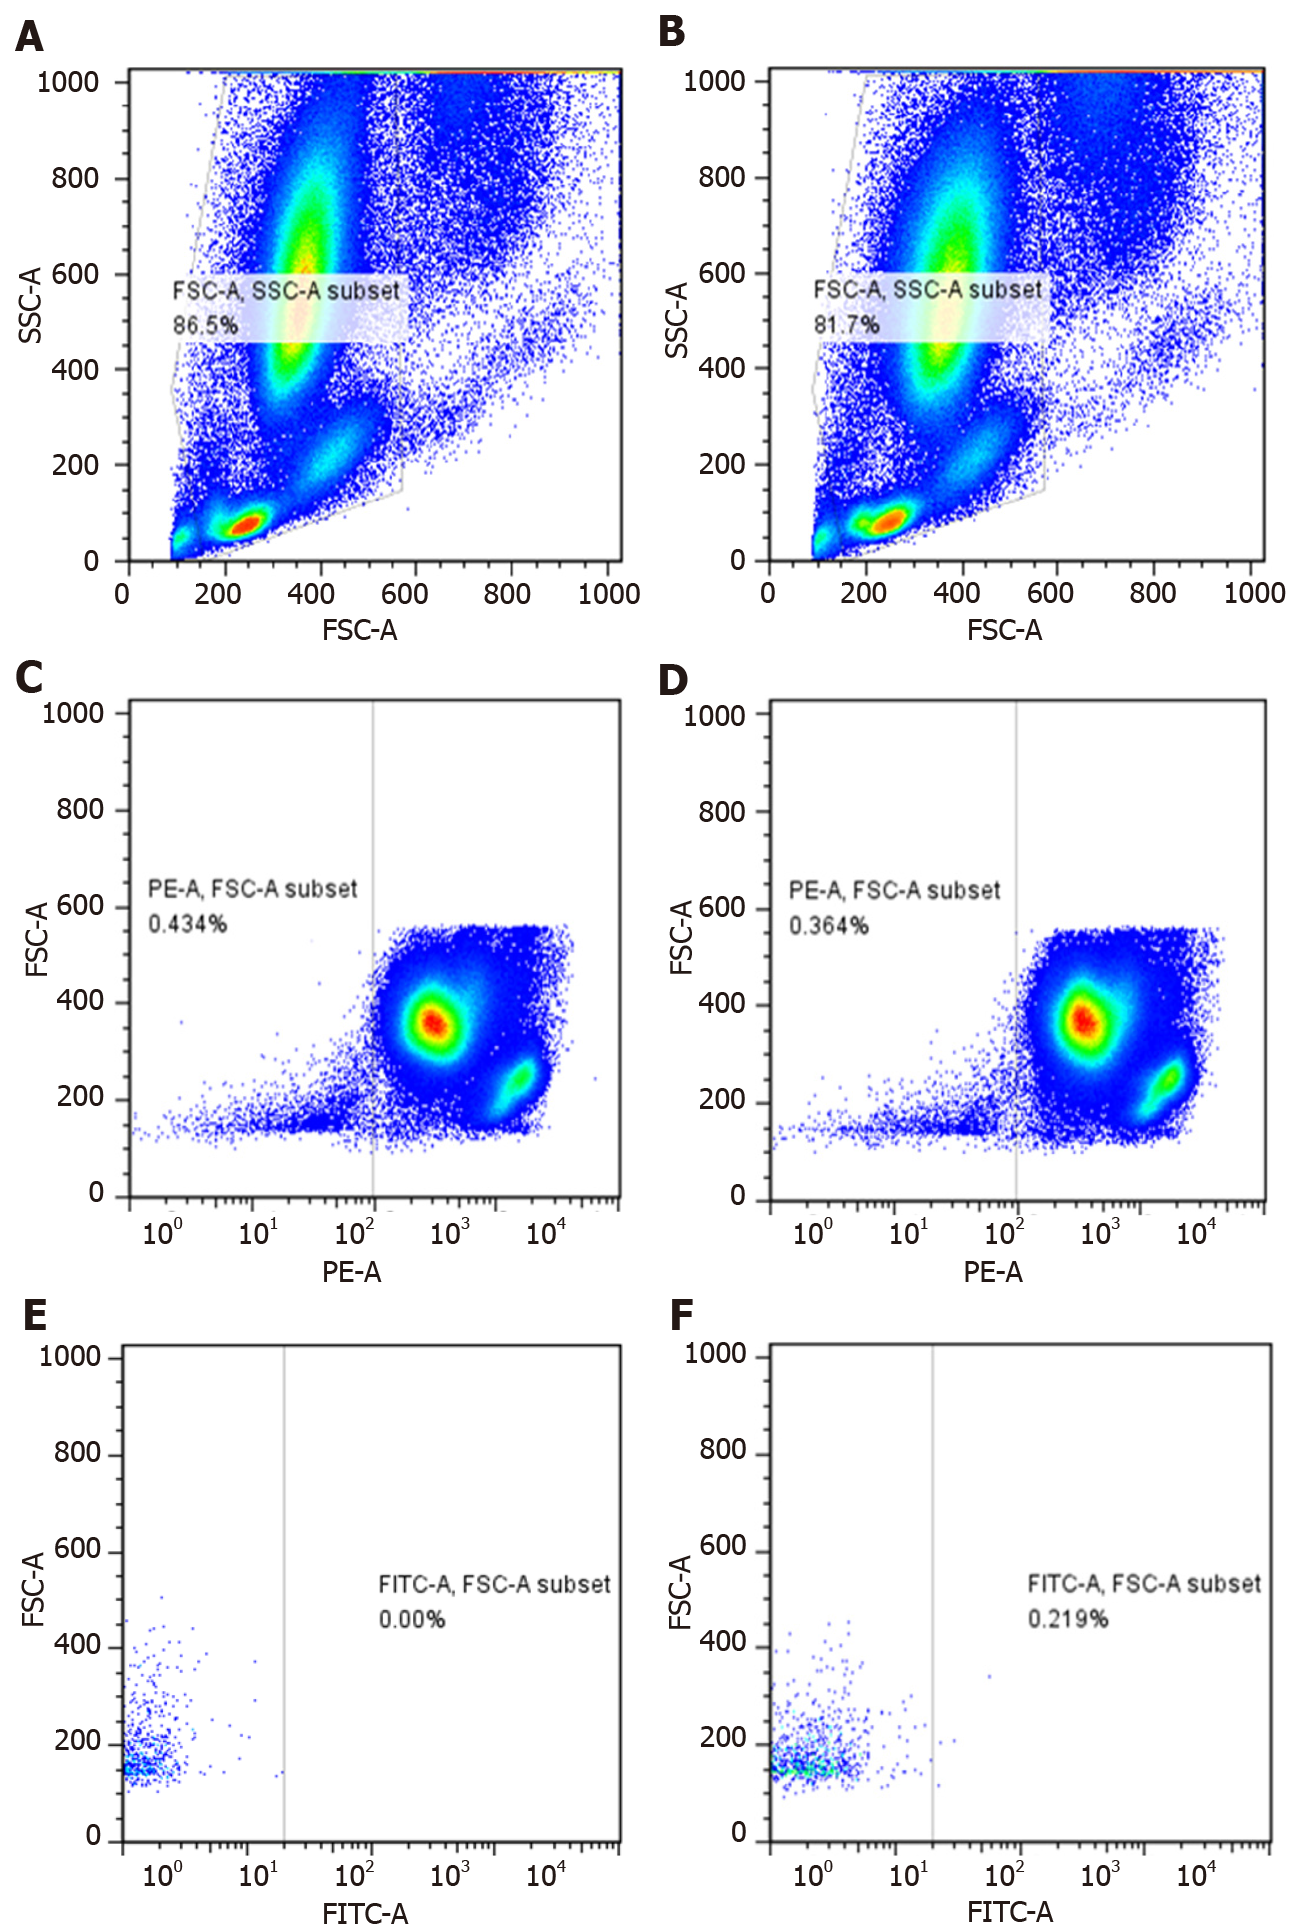
Figure 1 Circulating endothelial cells were measured by flow cytometry.
A, C, E: Isotype control group; B, D, F: Experimental groups.
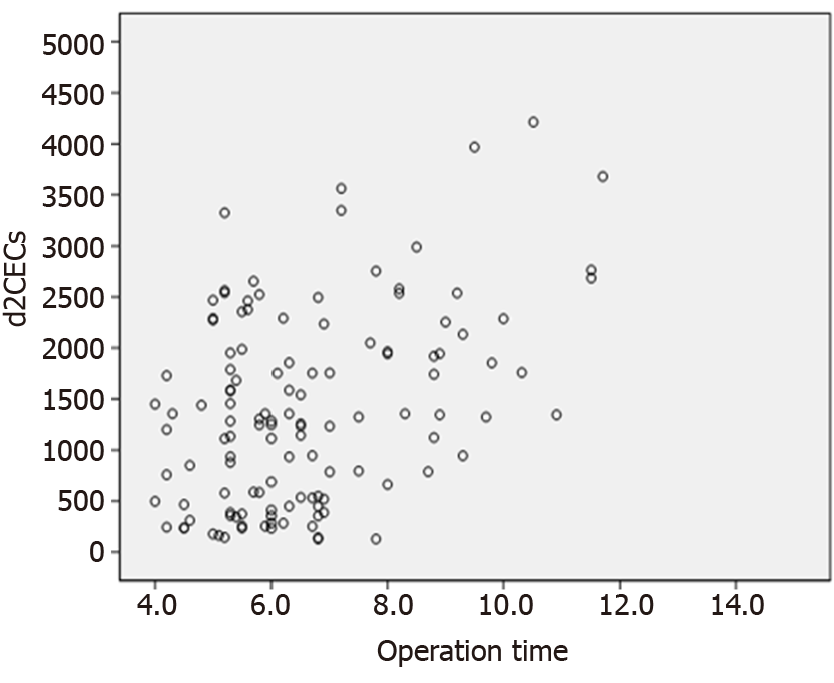
Figure 2 Spearman's correlation analysis was utilized, and there was significantly positively correlated between two groups.
d2 CECs: Day 2 circulating endothelial cells.
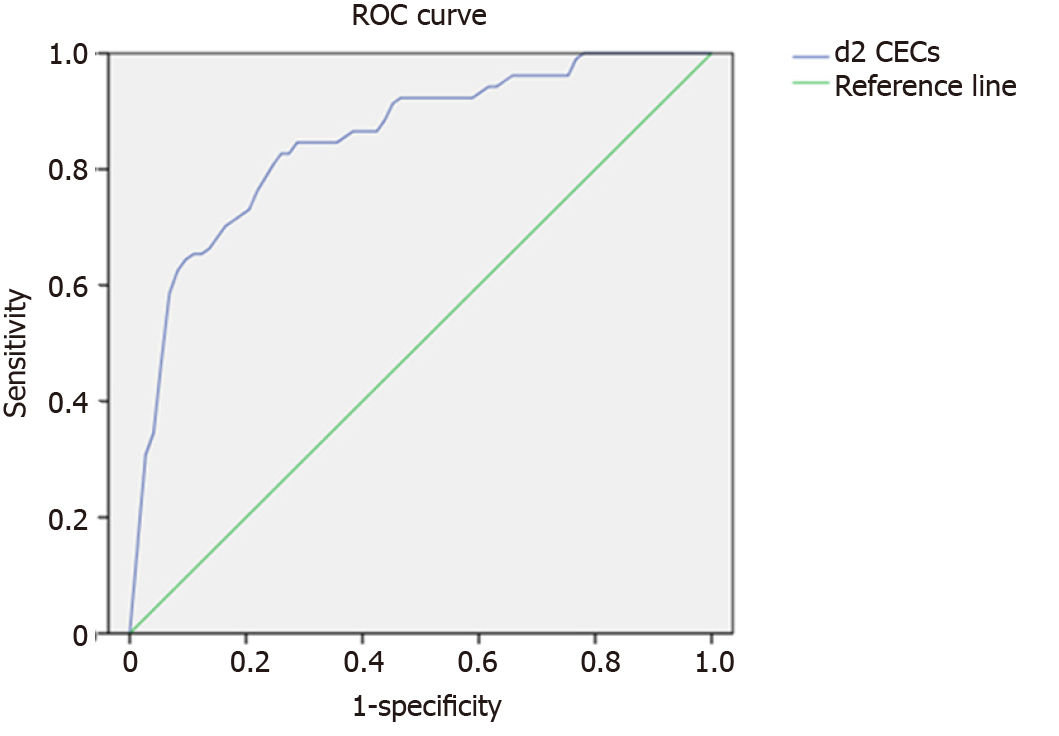
Figure 3 Youden index in receiver operating characteristic curve.
ROC: Receiver operating characteristic; d2 CECs: Day 2 circulating endothelial cells.
- Citation: Peng M, Yan QH, Gao Y, Zhang Z, Zhang Y, Wang YF, Wu HN. Correlation between circulating endothelial cell level and acute respiratory distress syndrome in postoperative patients. World J Clin Cases 2021; 9(32): 9731-9740
- URL: https://www.wjgnet.com/2307-8960/full/v9/i32/9731.htm
- DOI: https://dx.doi.org/10.12998/wjcc.v9.i32.9731


