
















©The Author(s) 2021.
World J Clin Cases. Jan 26, 2021; 9(3): 677-684
Published online Jan 26, 2021. doi: 10.12998/wjcc.v9.i3.677
Published online Jan 26, 2021. doi: 10.12998/wjcc.v9.i3.677
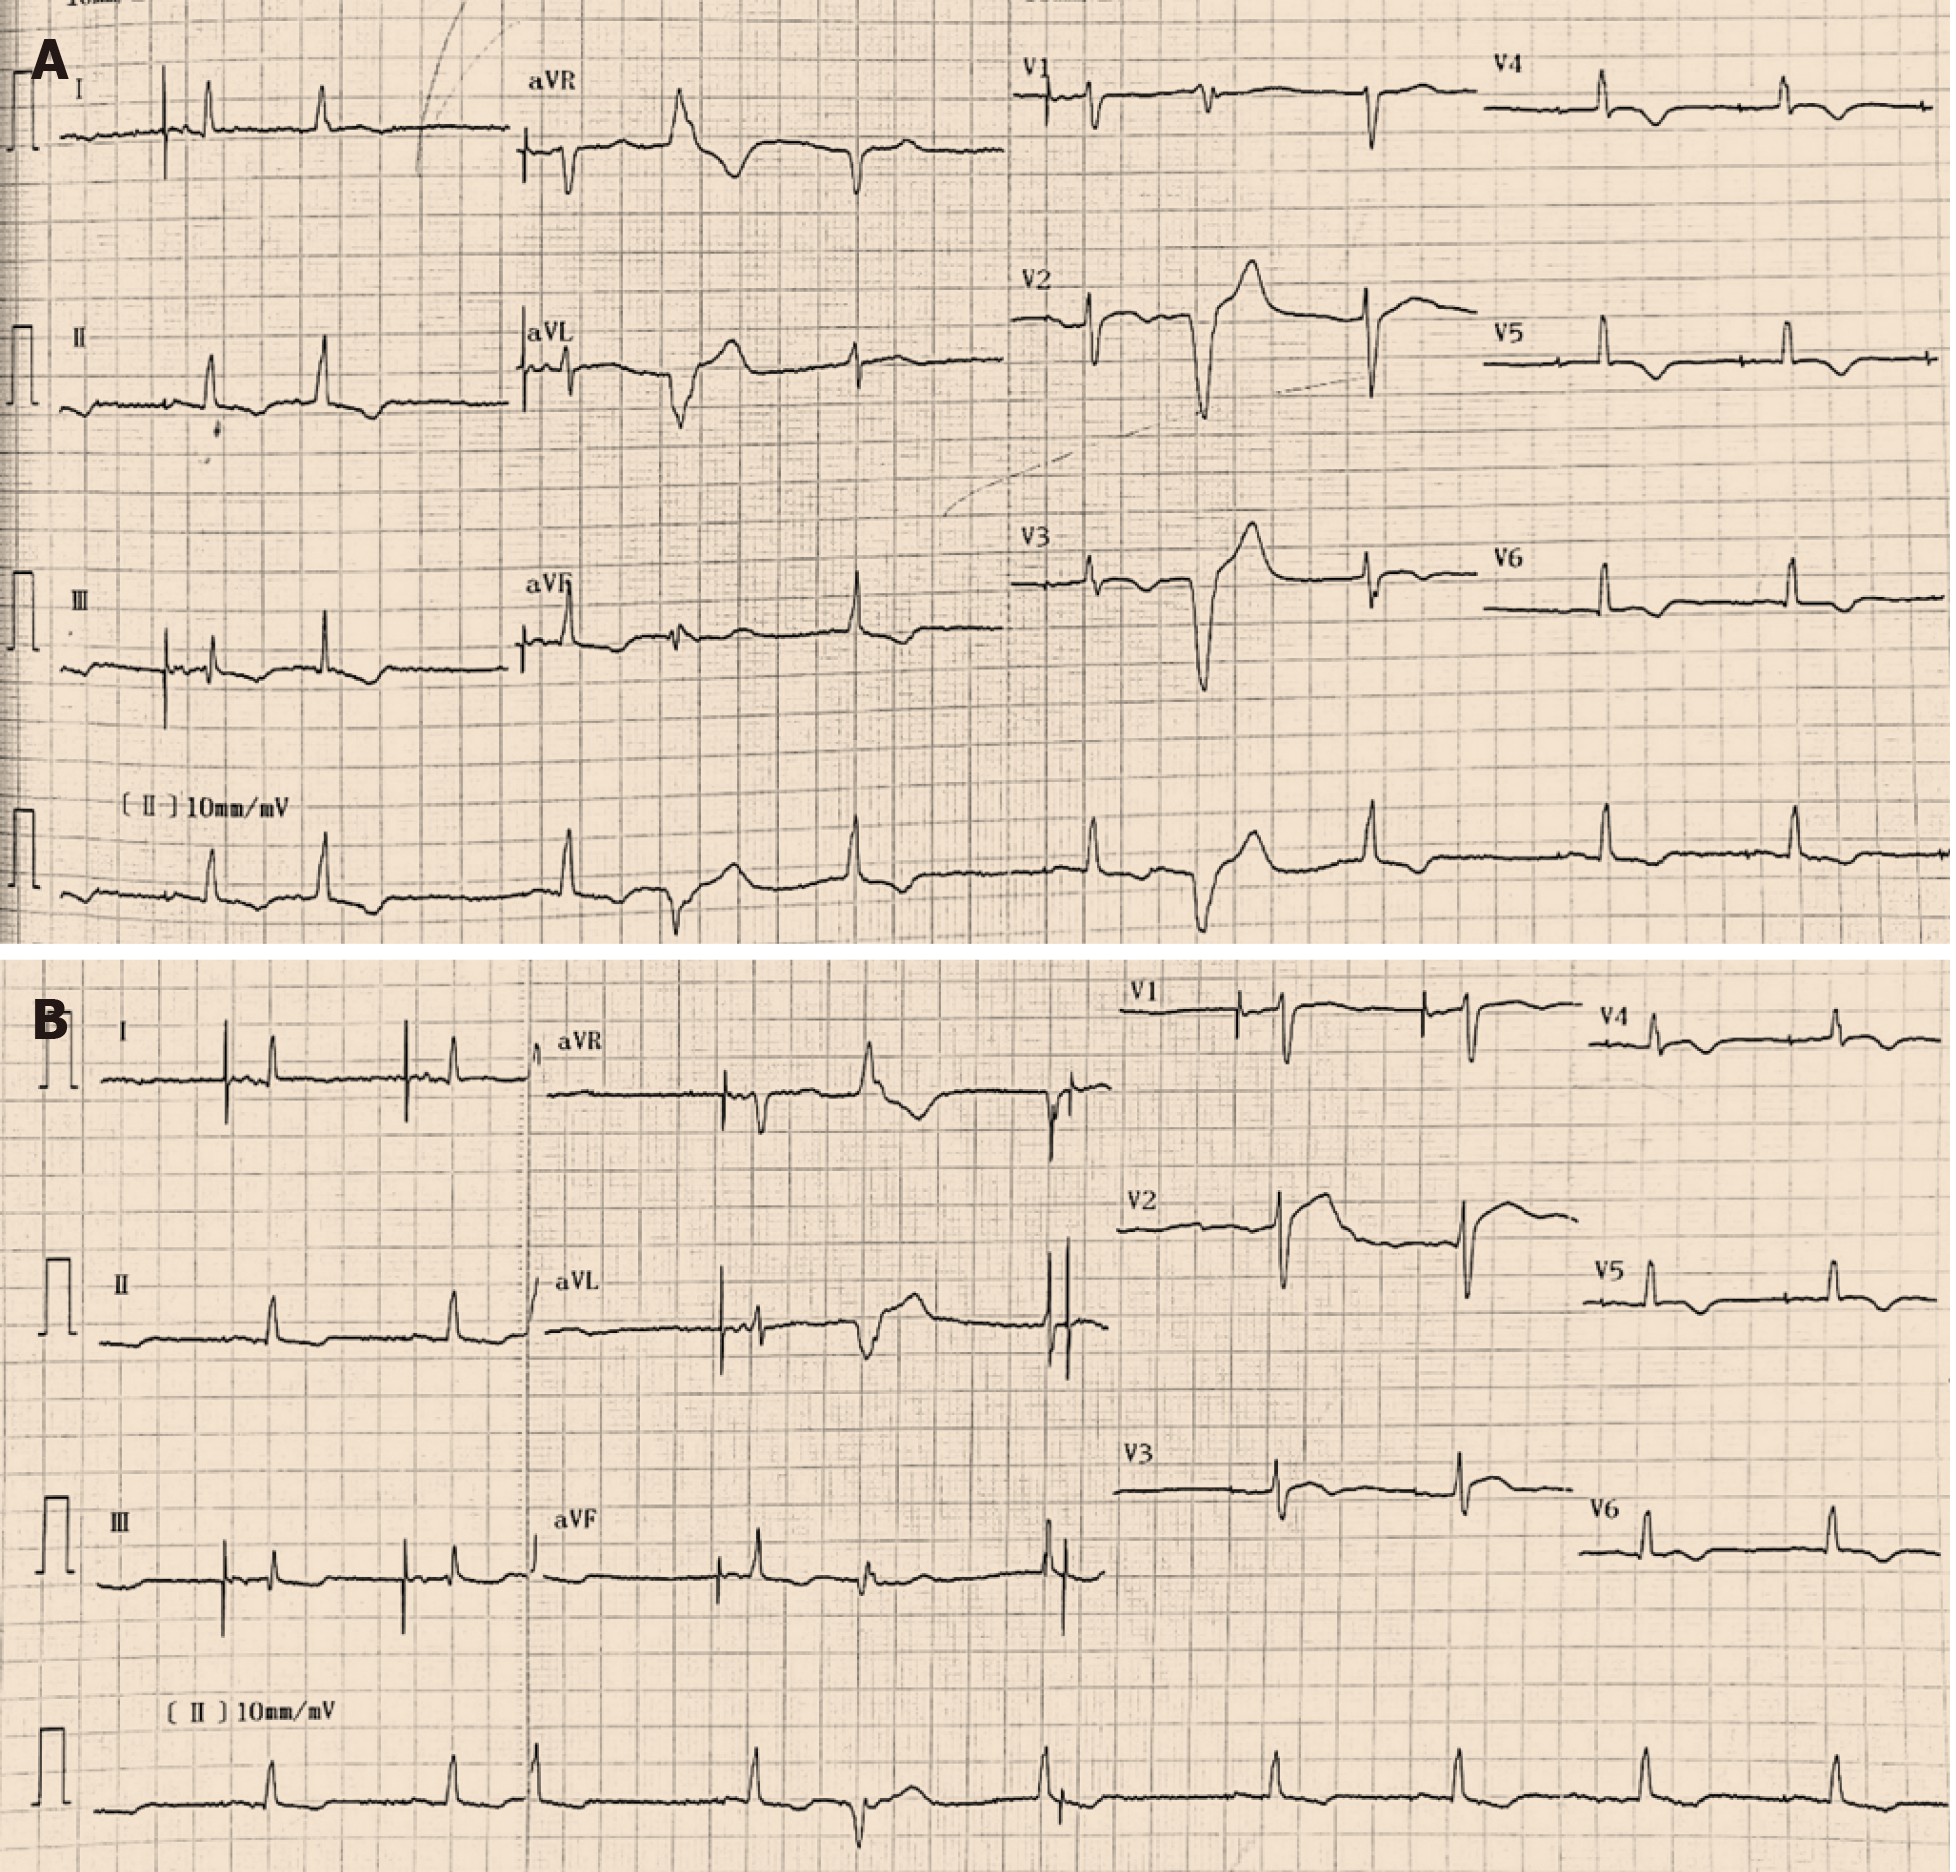
Figure 1 Twelve-lead electrocardiograms indicated ST-segment and T-wave changes in the inferior and anterior leads.
A: Electrocardiogram at admission; B: Electrocardiogram 2 d after admission.
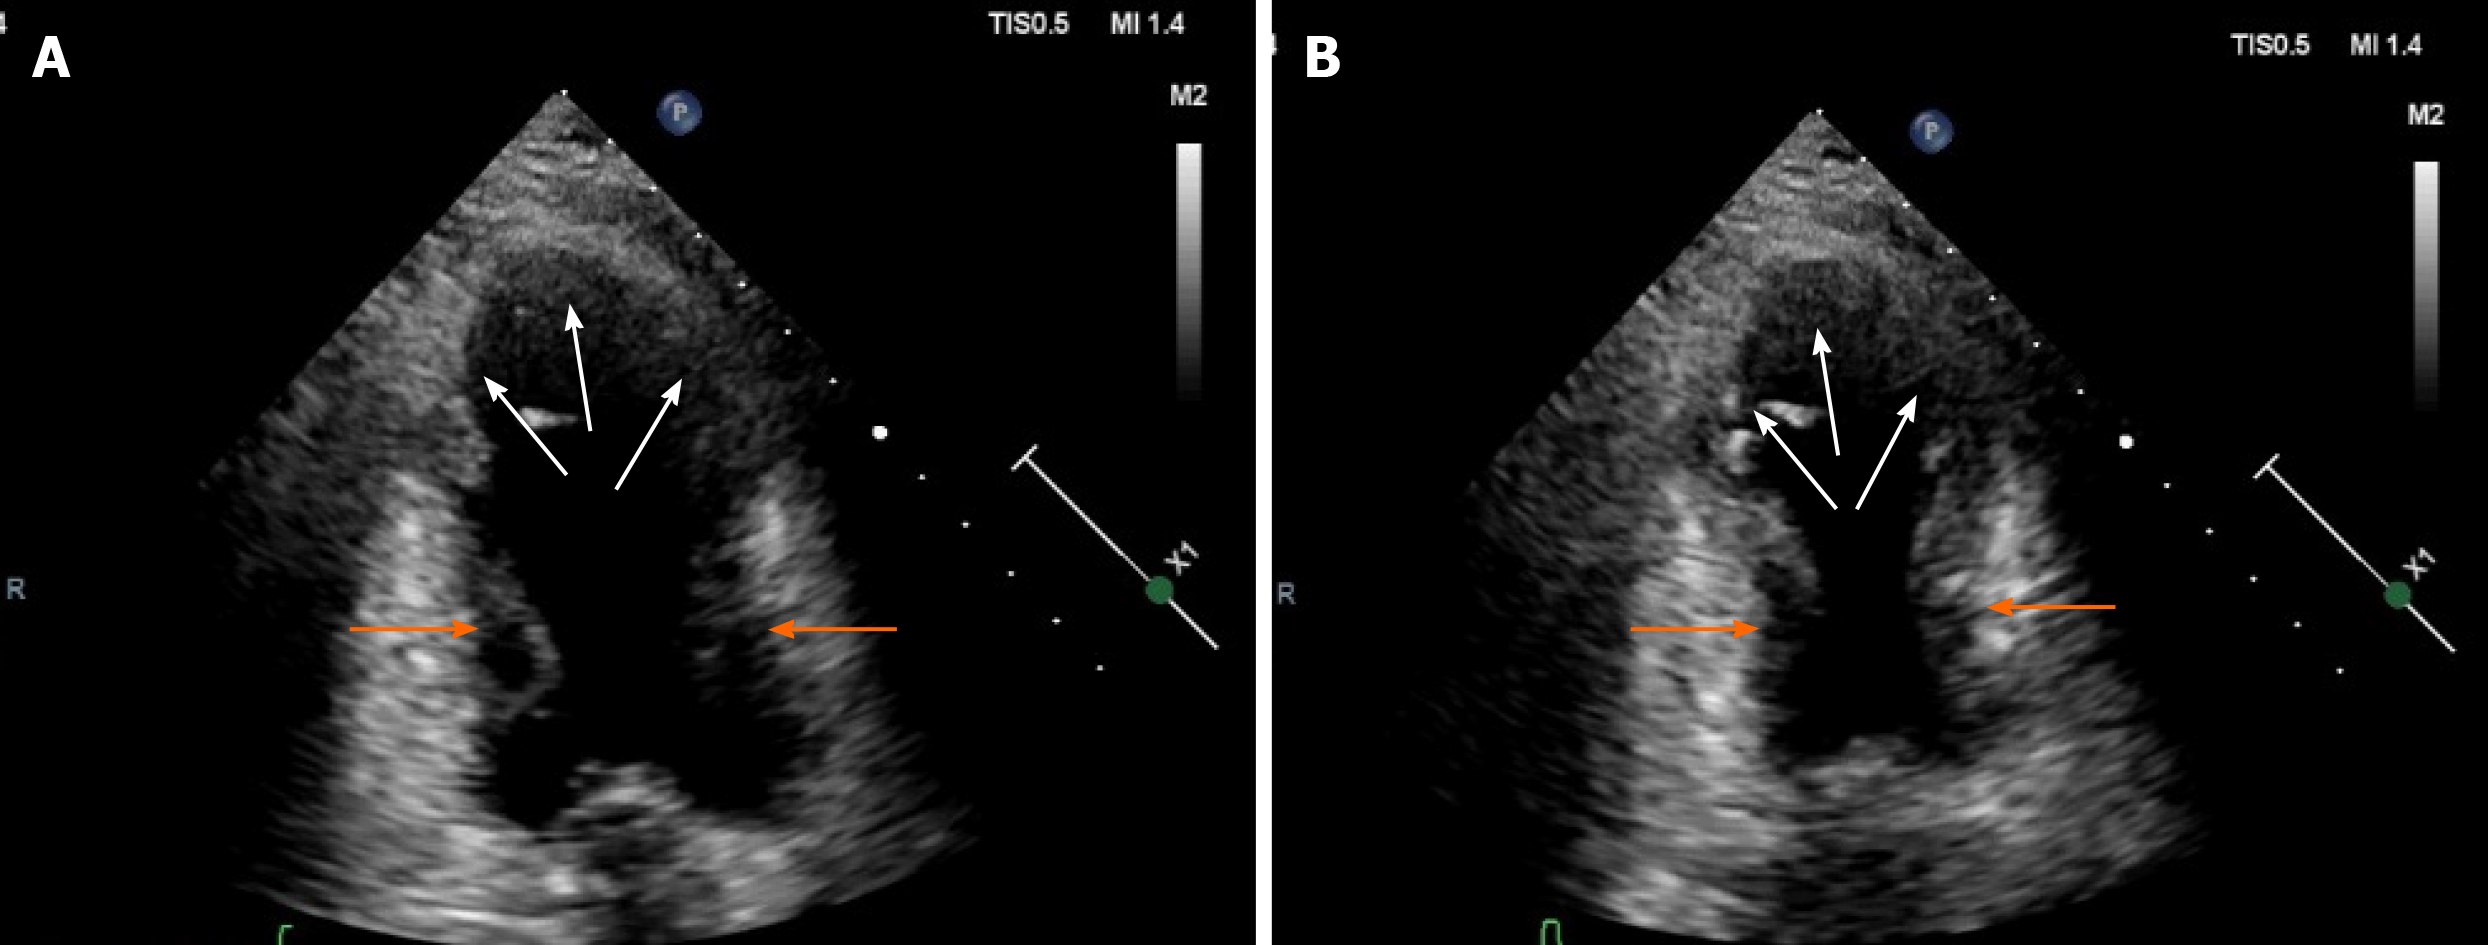
Figure 2 Transthoracic echocardiogram showed hypokinetic apical and mid-distal segments with apical ballooning (white arrow) and a hypercontractile basal segment of the left ventricle (orange arrow).
A: View of end diastole; B: View of end systole.
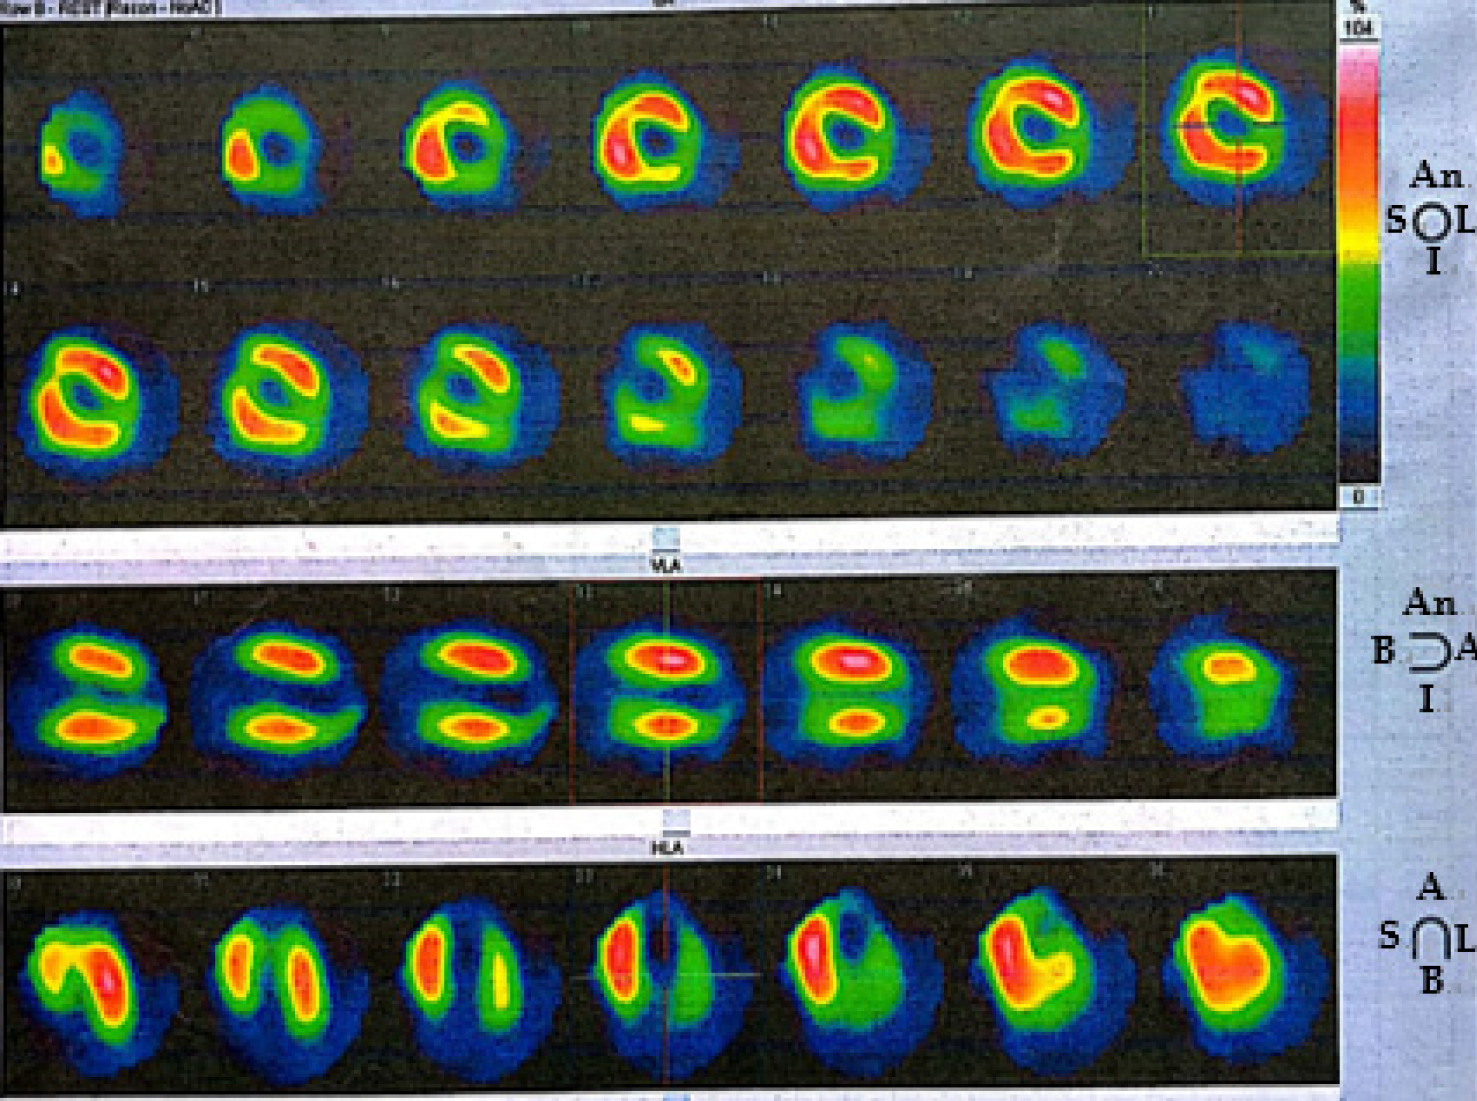
Figure 3 Myocardial perfusion single photon emission computed tomography imaging (resting state) demonstrated decreased uptake in the left ventricular apical, anterior, inferior and lateral walls of the myocardium.
A: Apex; An: Anterior; B: Base; I: Inferior; L: Lateral; S: Septal.
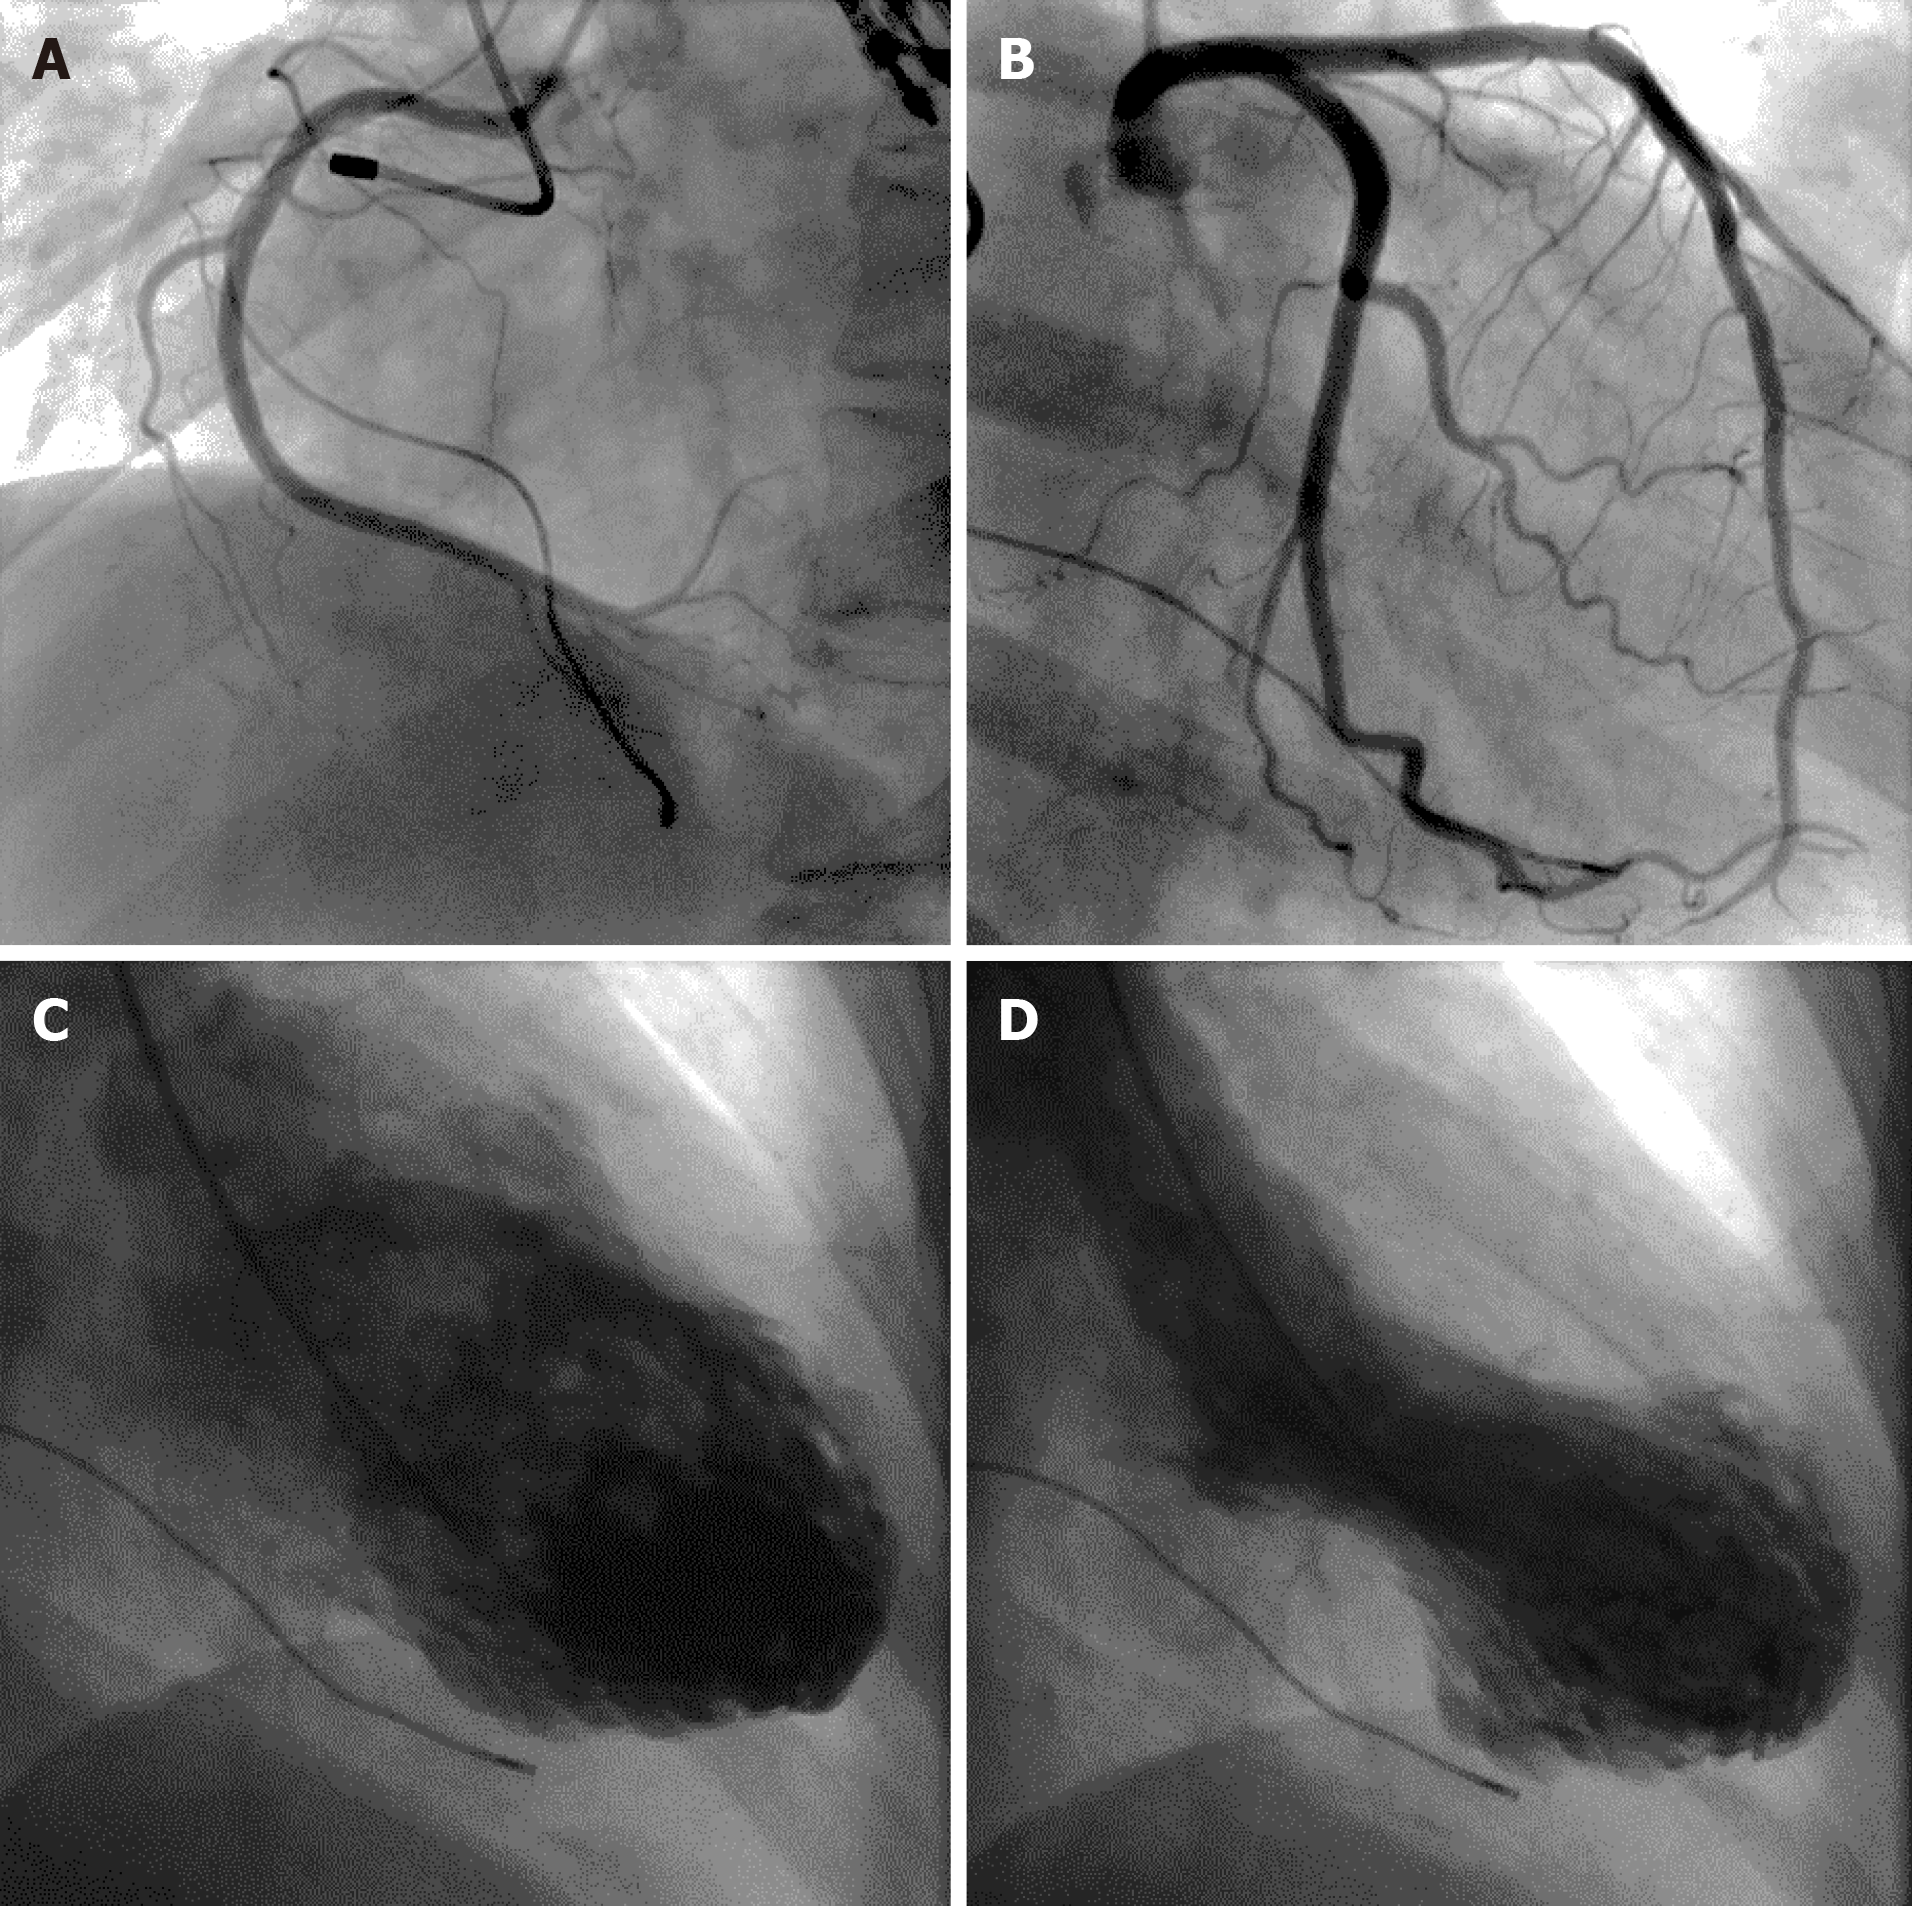
Figure 4 Coronary angiogram revealed no evidence of coronary artery disease (A and B) and left ventriculogram revealed left ventricular apical ballooning with end diastole (C) and end systole (D).
- Citation: Wu HY, Cheng G, Liang L, Cao YW. Recurrent Takotsubo cardiomyopathy triggered by emotionally stressful events: A case report. World J Clin Cases 2021; 9(3): 677-684
- URL: https://www.wjgnet.com/2307-8960/full/v9/i3/677.htm
- DOI: https://dx.doi.org/10.12998/wjcc.v9.i3.677