Copyright
©The Author(s) 2021.
World J Clin Cases. Oct 16, 2021; 9(29): 8729-8739
Published online Oct 16, 2021. doi: 10.12998/wjcc.v9.i29.8729
Published online Oct 16, 2021. doi: 10.12998/wjcc.v9.i29.8729
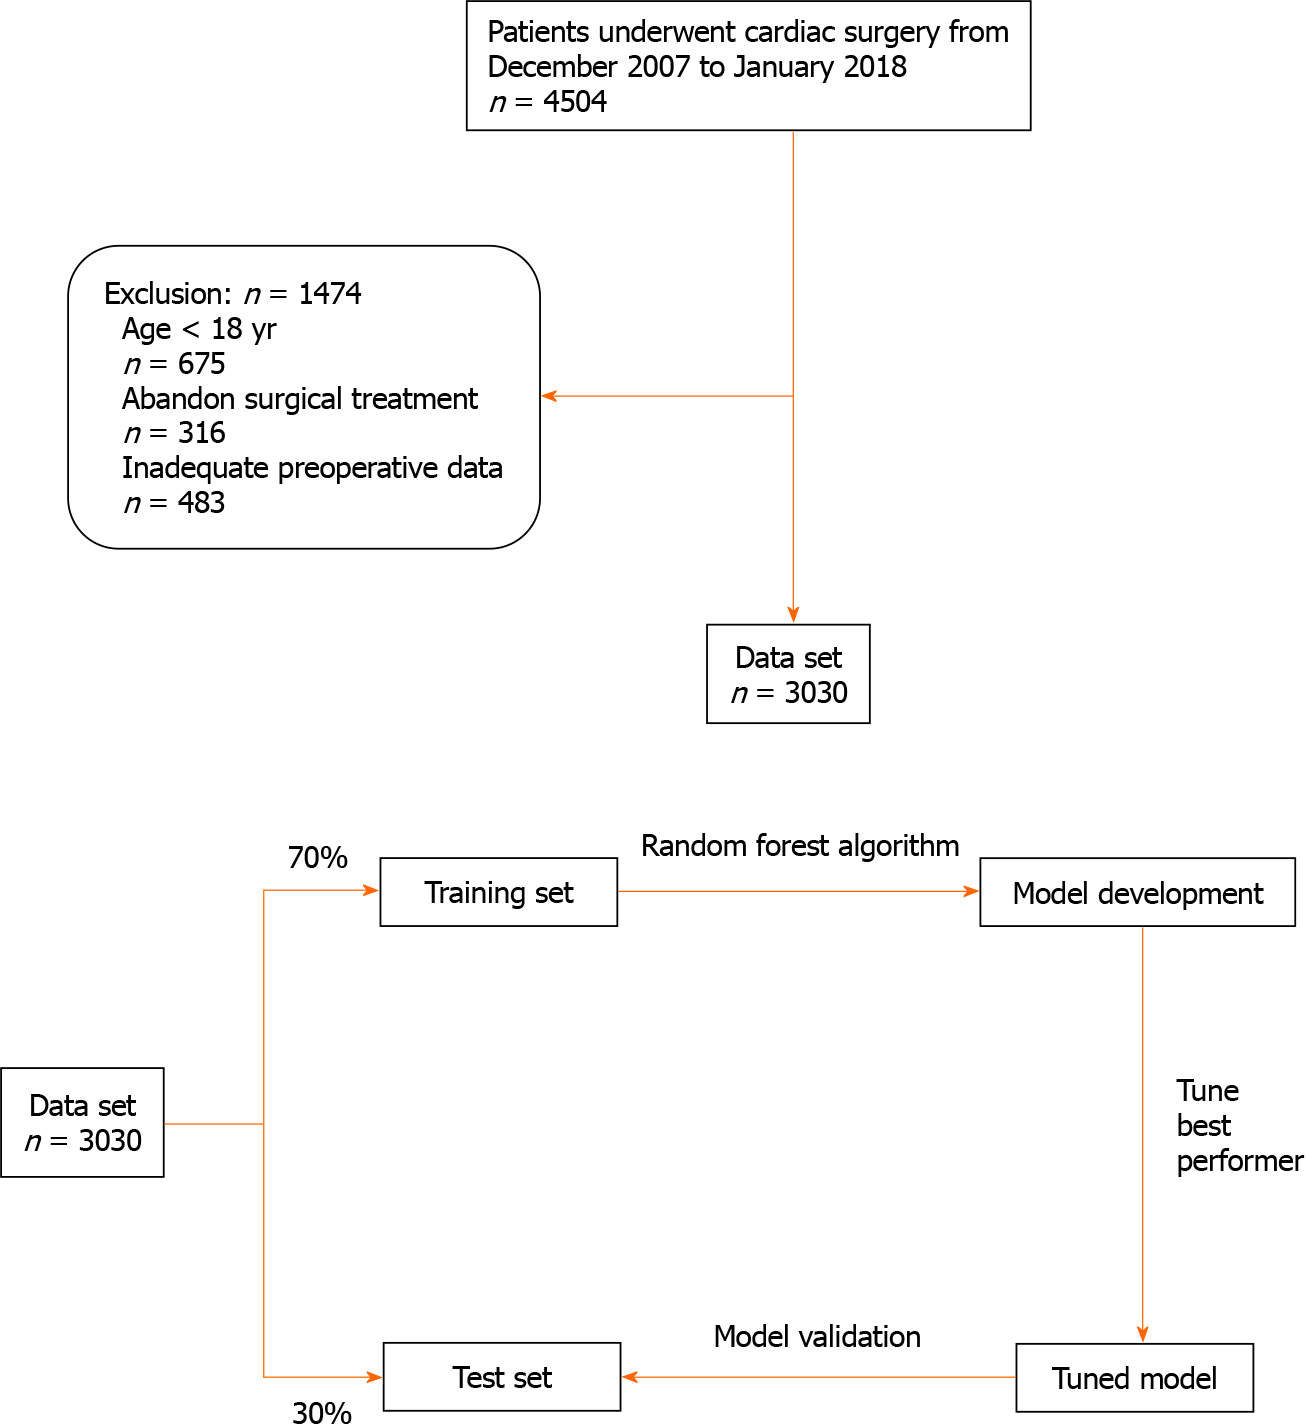
Figure 1 Research protocol flow chart.
A total of 4504 patients who underwent cardiac surgery were screened for inclusion; 1474 were excluded. The 3030 who were eligible and included in the study were divided into a training set and a testing set. The random forest algorithm was applied to the training set for the modeling process and the parameters were debugged. The model was then validated in the test set.
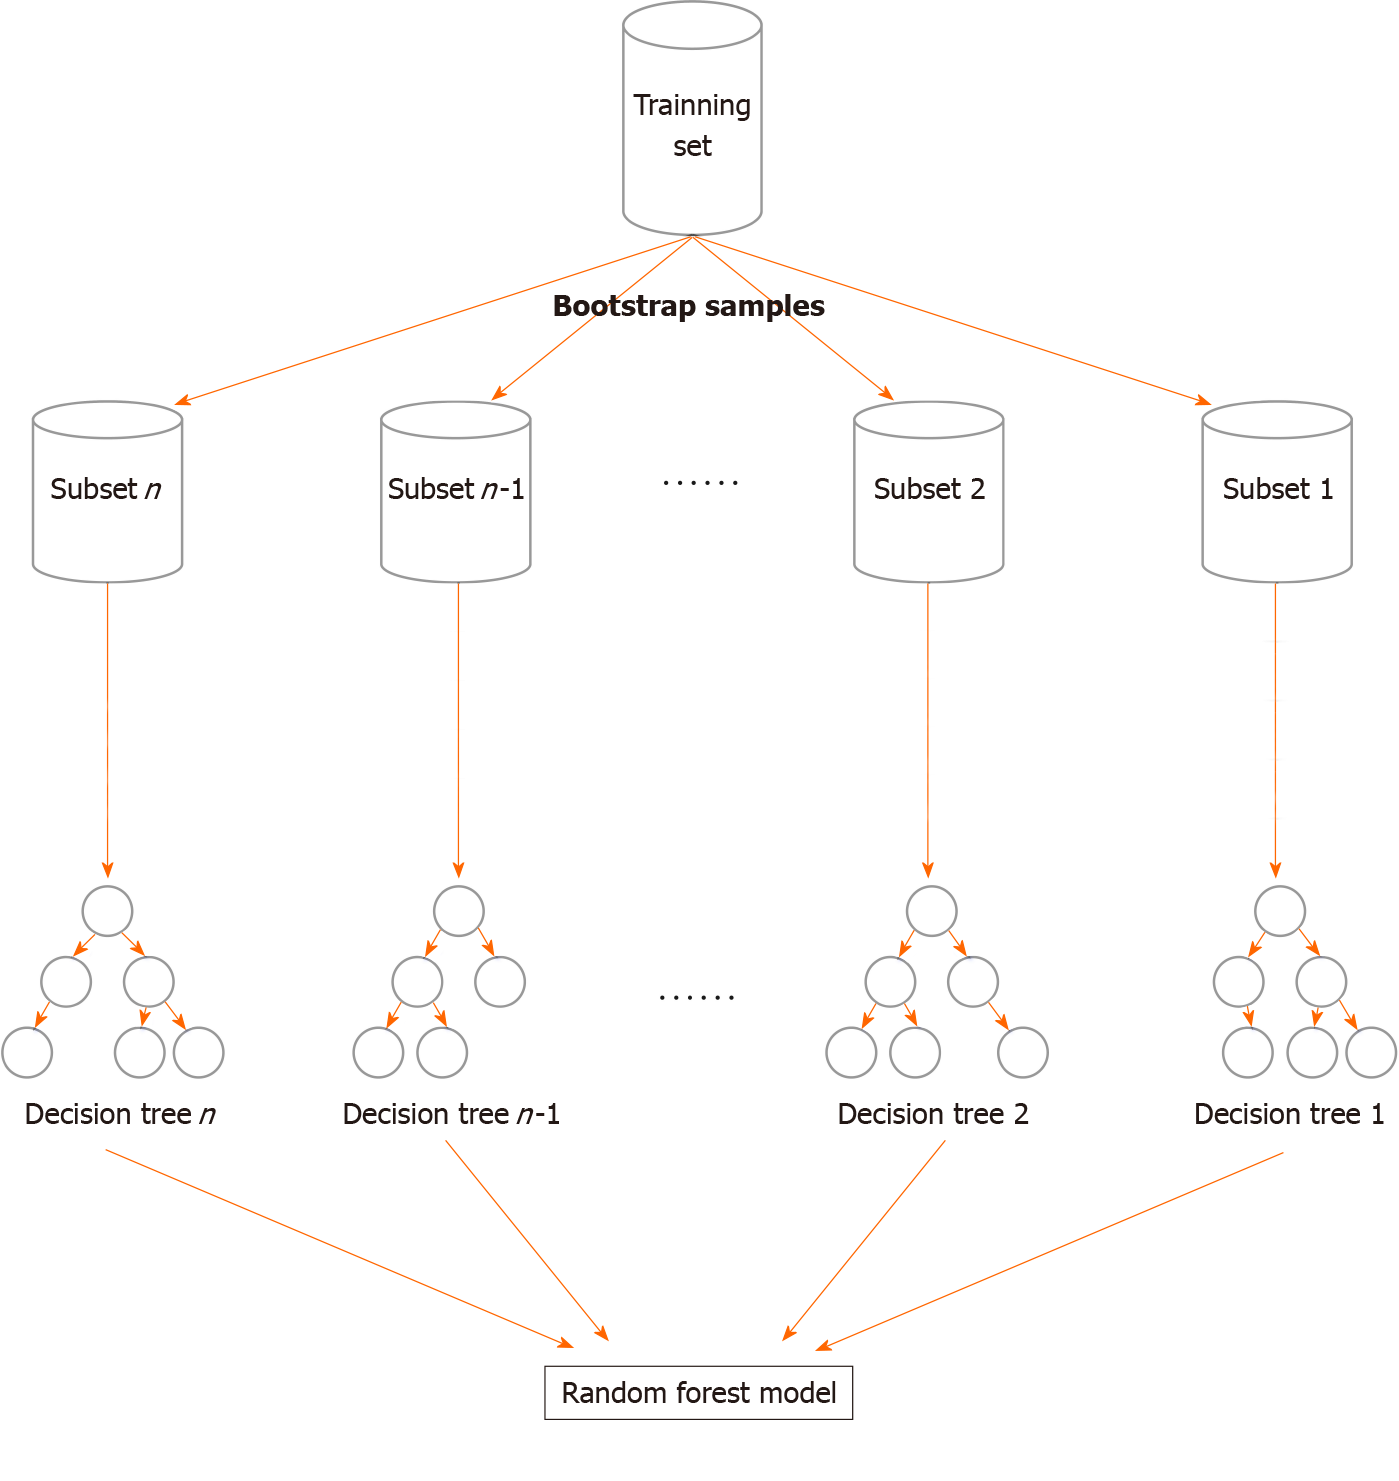
Figure 2 Illustration of the random forest built from a collection of trees.
The random forest adapted the bootstrap sampling method. All participants were randomly selected from the dataset to form the N subset. By forcing each split to consider only a subset of predictors, all predictors were allowed a chance to reveal their importance.
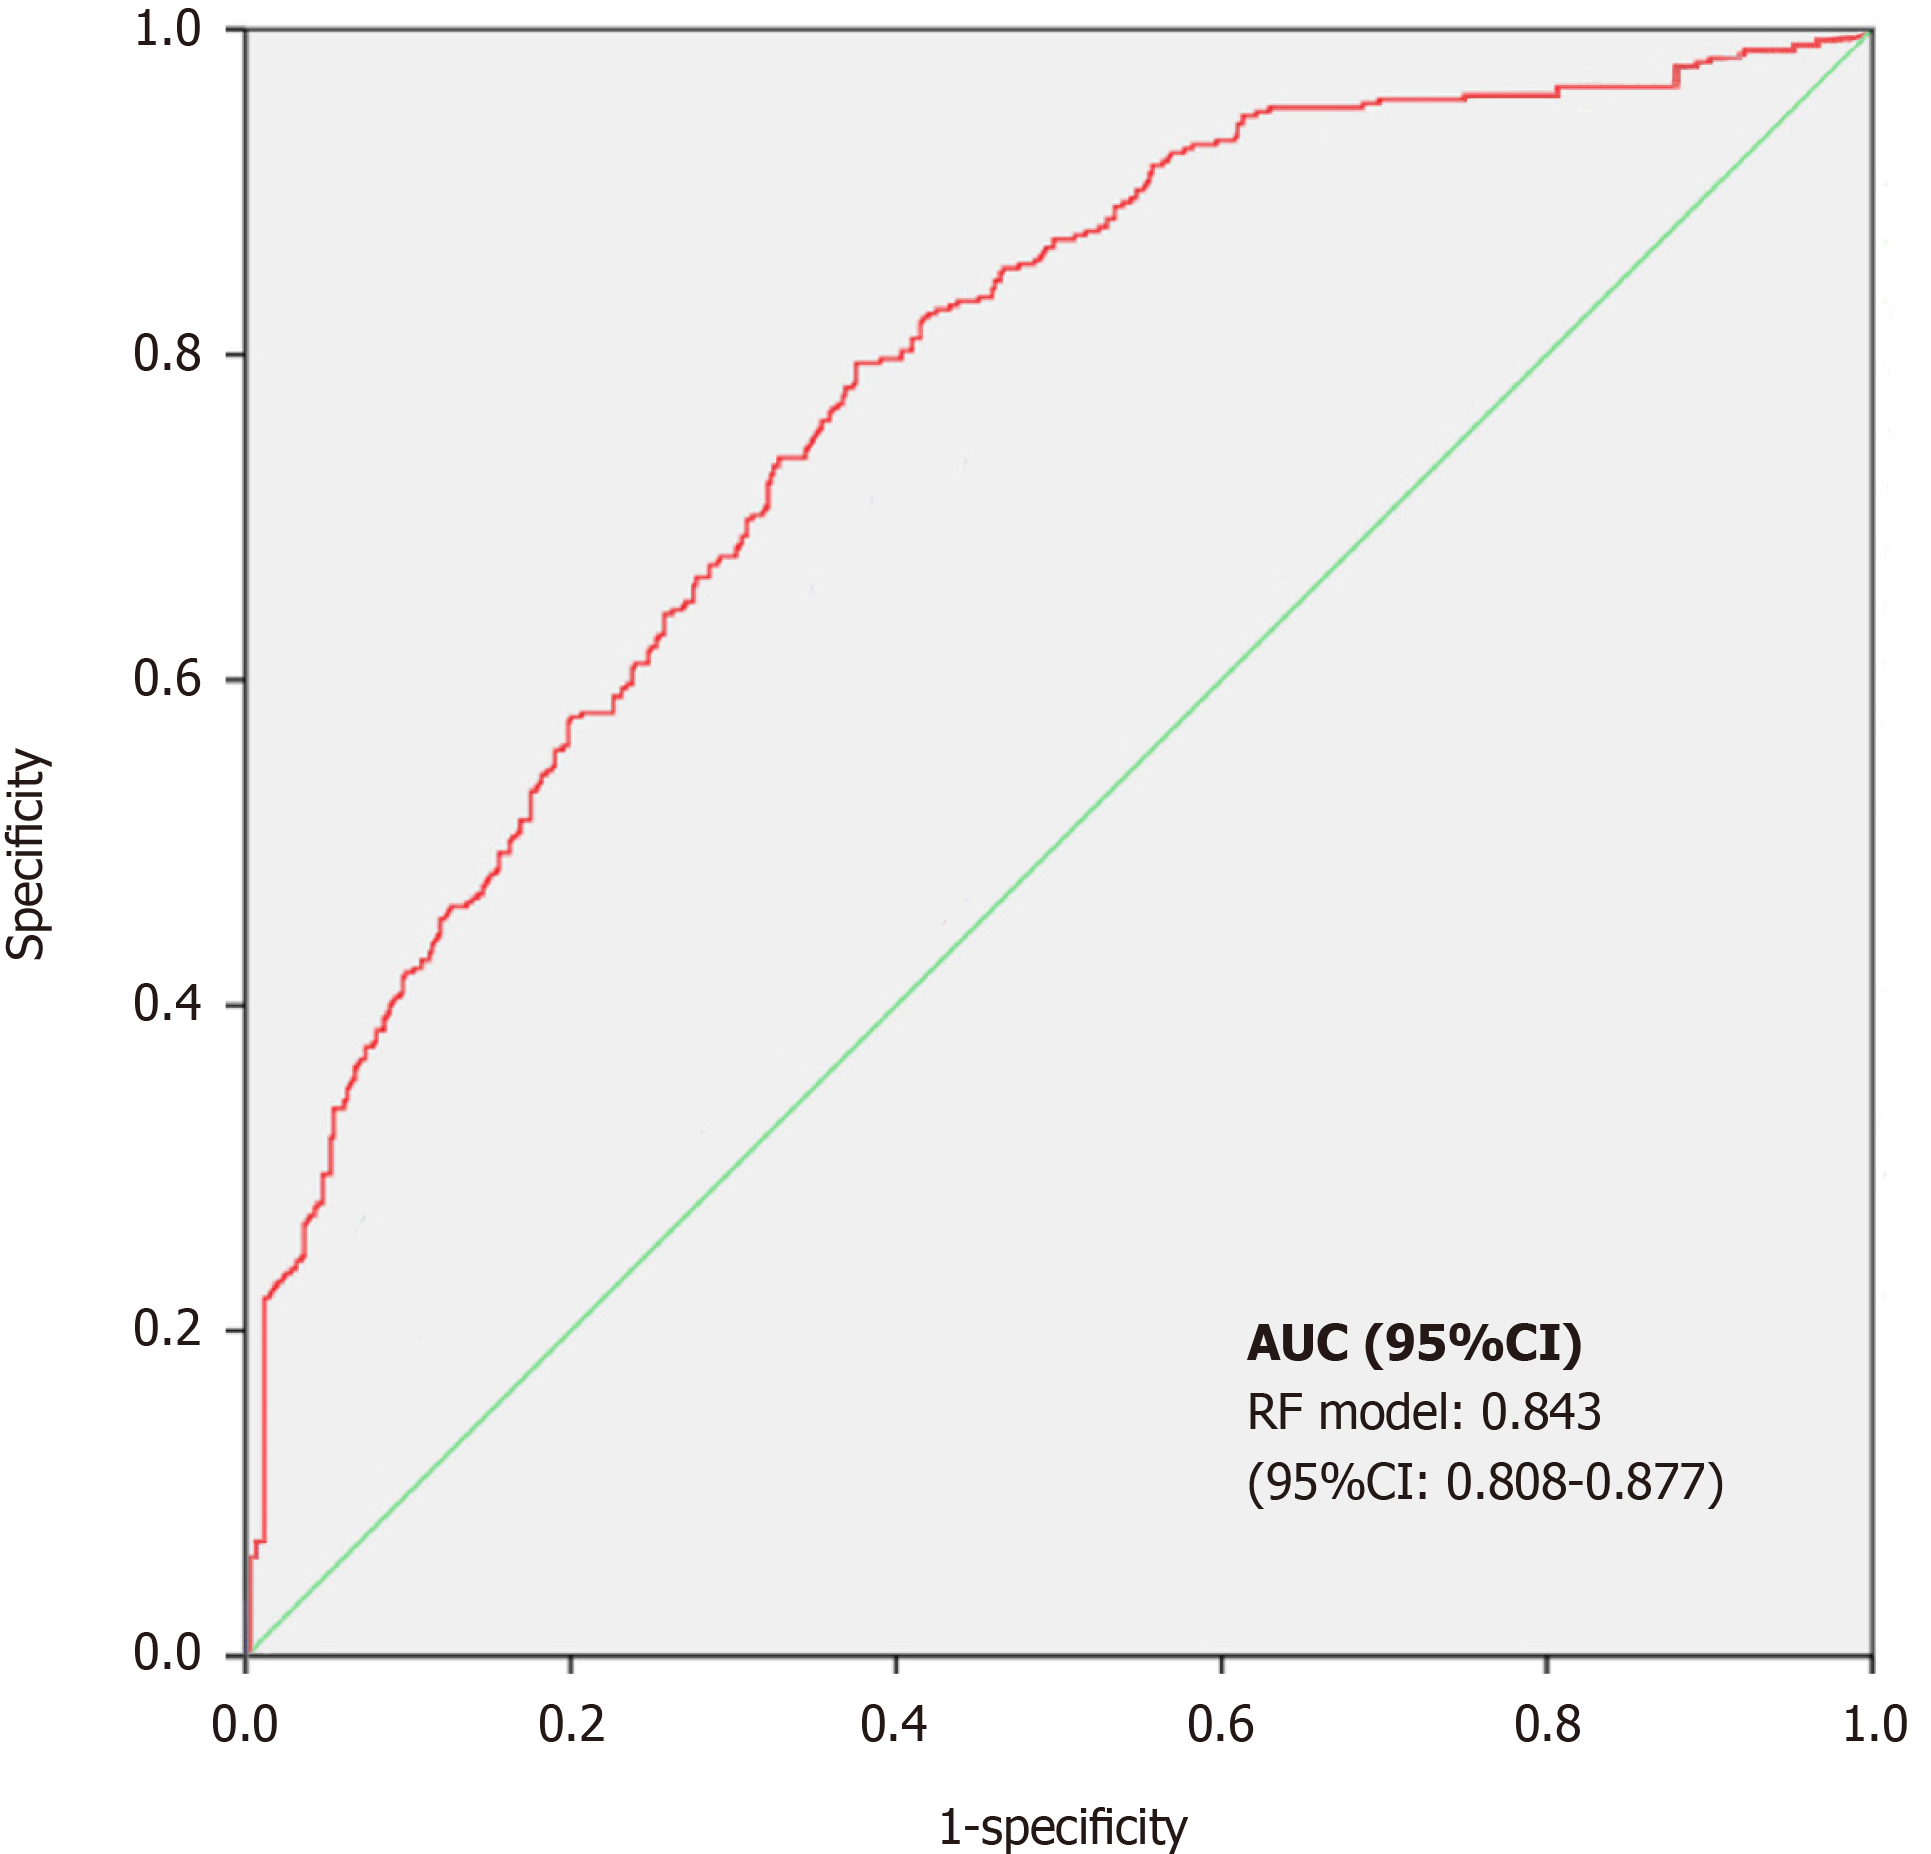
Figure 3 The receiver operating characteristic curve of the random forest model.
AUC: Area under the curve.
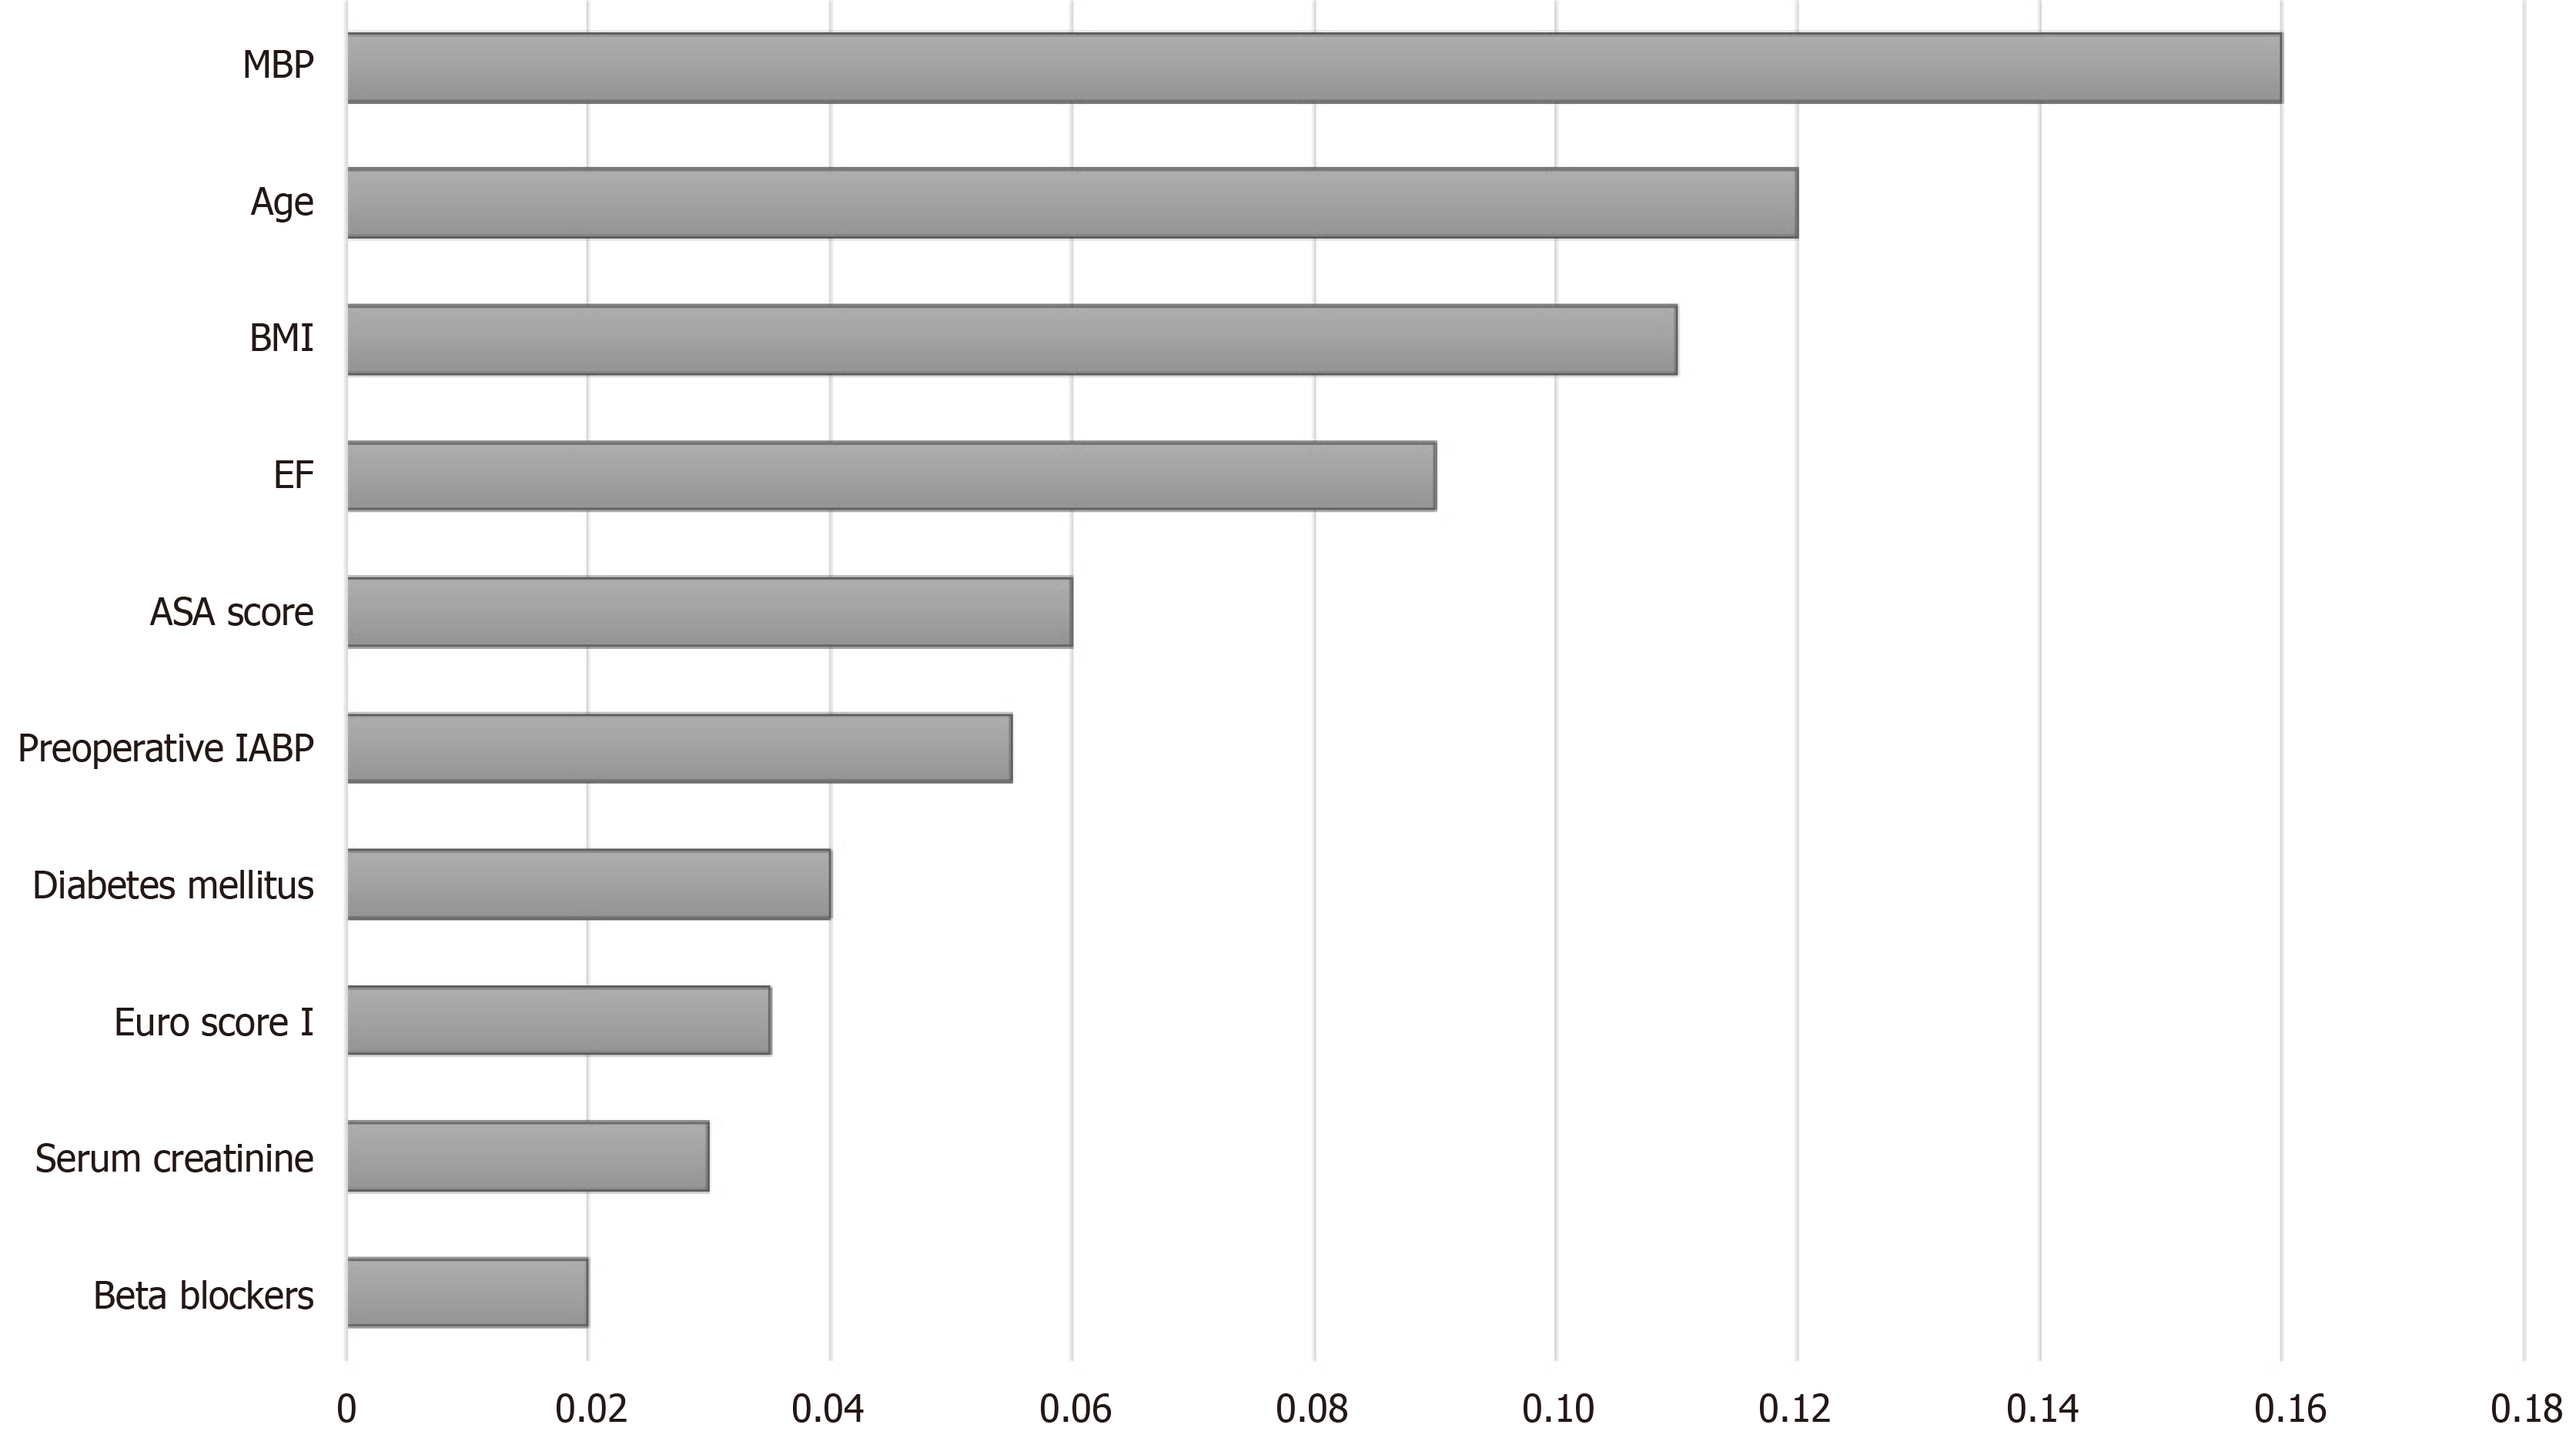
Figure 4 Ranked importance of the random forest model.
The importance of each variable was ranked by the mean decrease in the Gini index. ASA: American Society of Anesthesiologists; BMI: Body mass index; EF: Ejection fraction; IABP: Intra-aortic balloon pump; MBP: Mean blood pressure.
- Citation: Li XF, Huang YZ, Tang JY, Li RC, Wang XQ. Development of a random forest model for hypotension prediction after anesthesia induction for cardiac surgery. World J Clin Cases 2021; 9(29): 8729-8739
- URL: https://www.wjgnet.com/2307-8960/full/v9/i29/8729.htm
- DOI: https://dx.doi.org/10.12998/wjcc.v9.i29.8729


