Copyright
©The Author(s) 2021.
World J Clin Cases. Oct 6, 2021; 9(28): 8388-8403
Published online Oct 6, 2021. doi: 10.12998/wjcc.v9.i28.8388
Published online Oct 6, 2021. doi: 10.12998/wjcc.v9.i28.8388
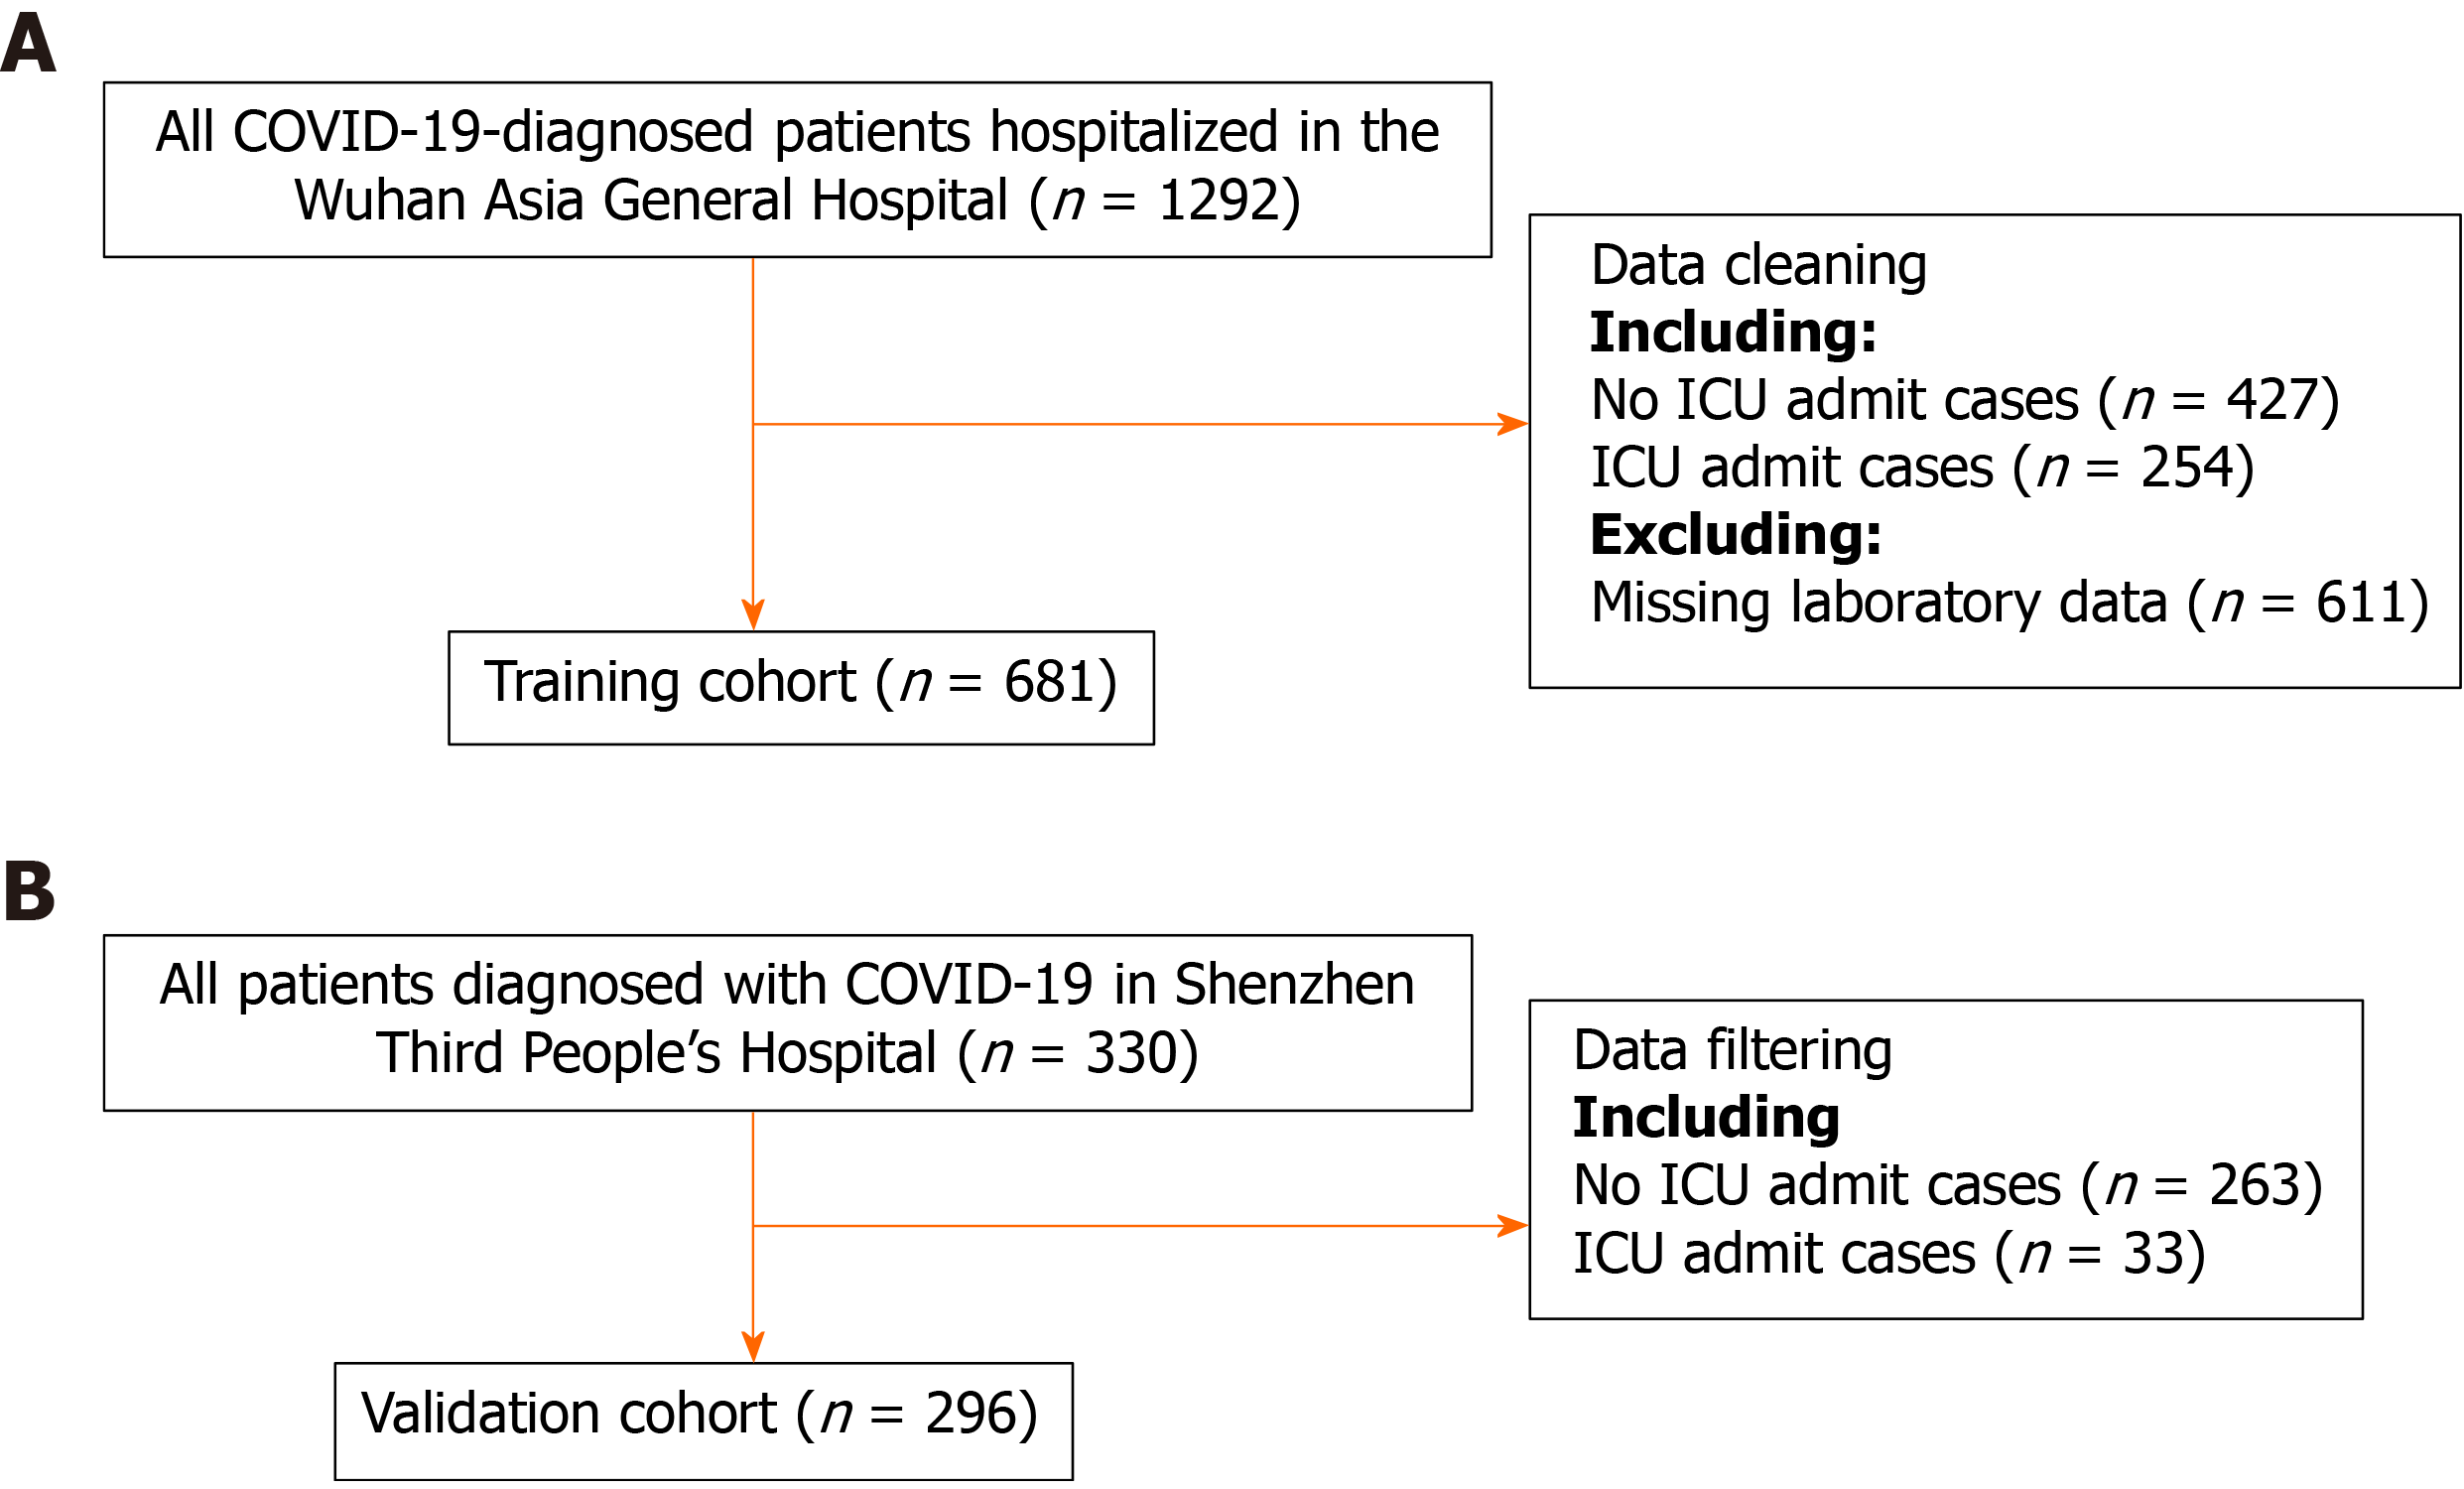
Figure 1 The flowchart illustrating the patients in the training and validation cohorts.
The data for each cohort was obtained and analyzed retrospectively. A: Patients in the training cohort; B: Patients in the validation cohort. COVID-19: Coronavirus disease 2019; ICU: Intensive care unit.
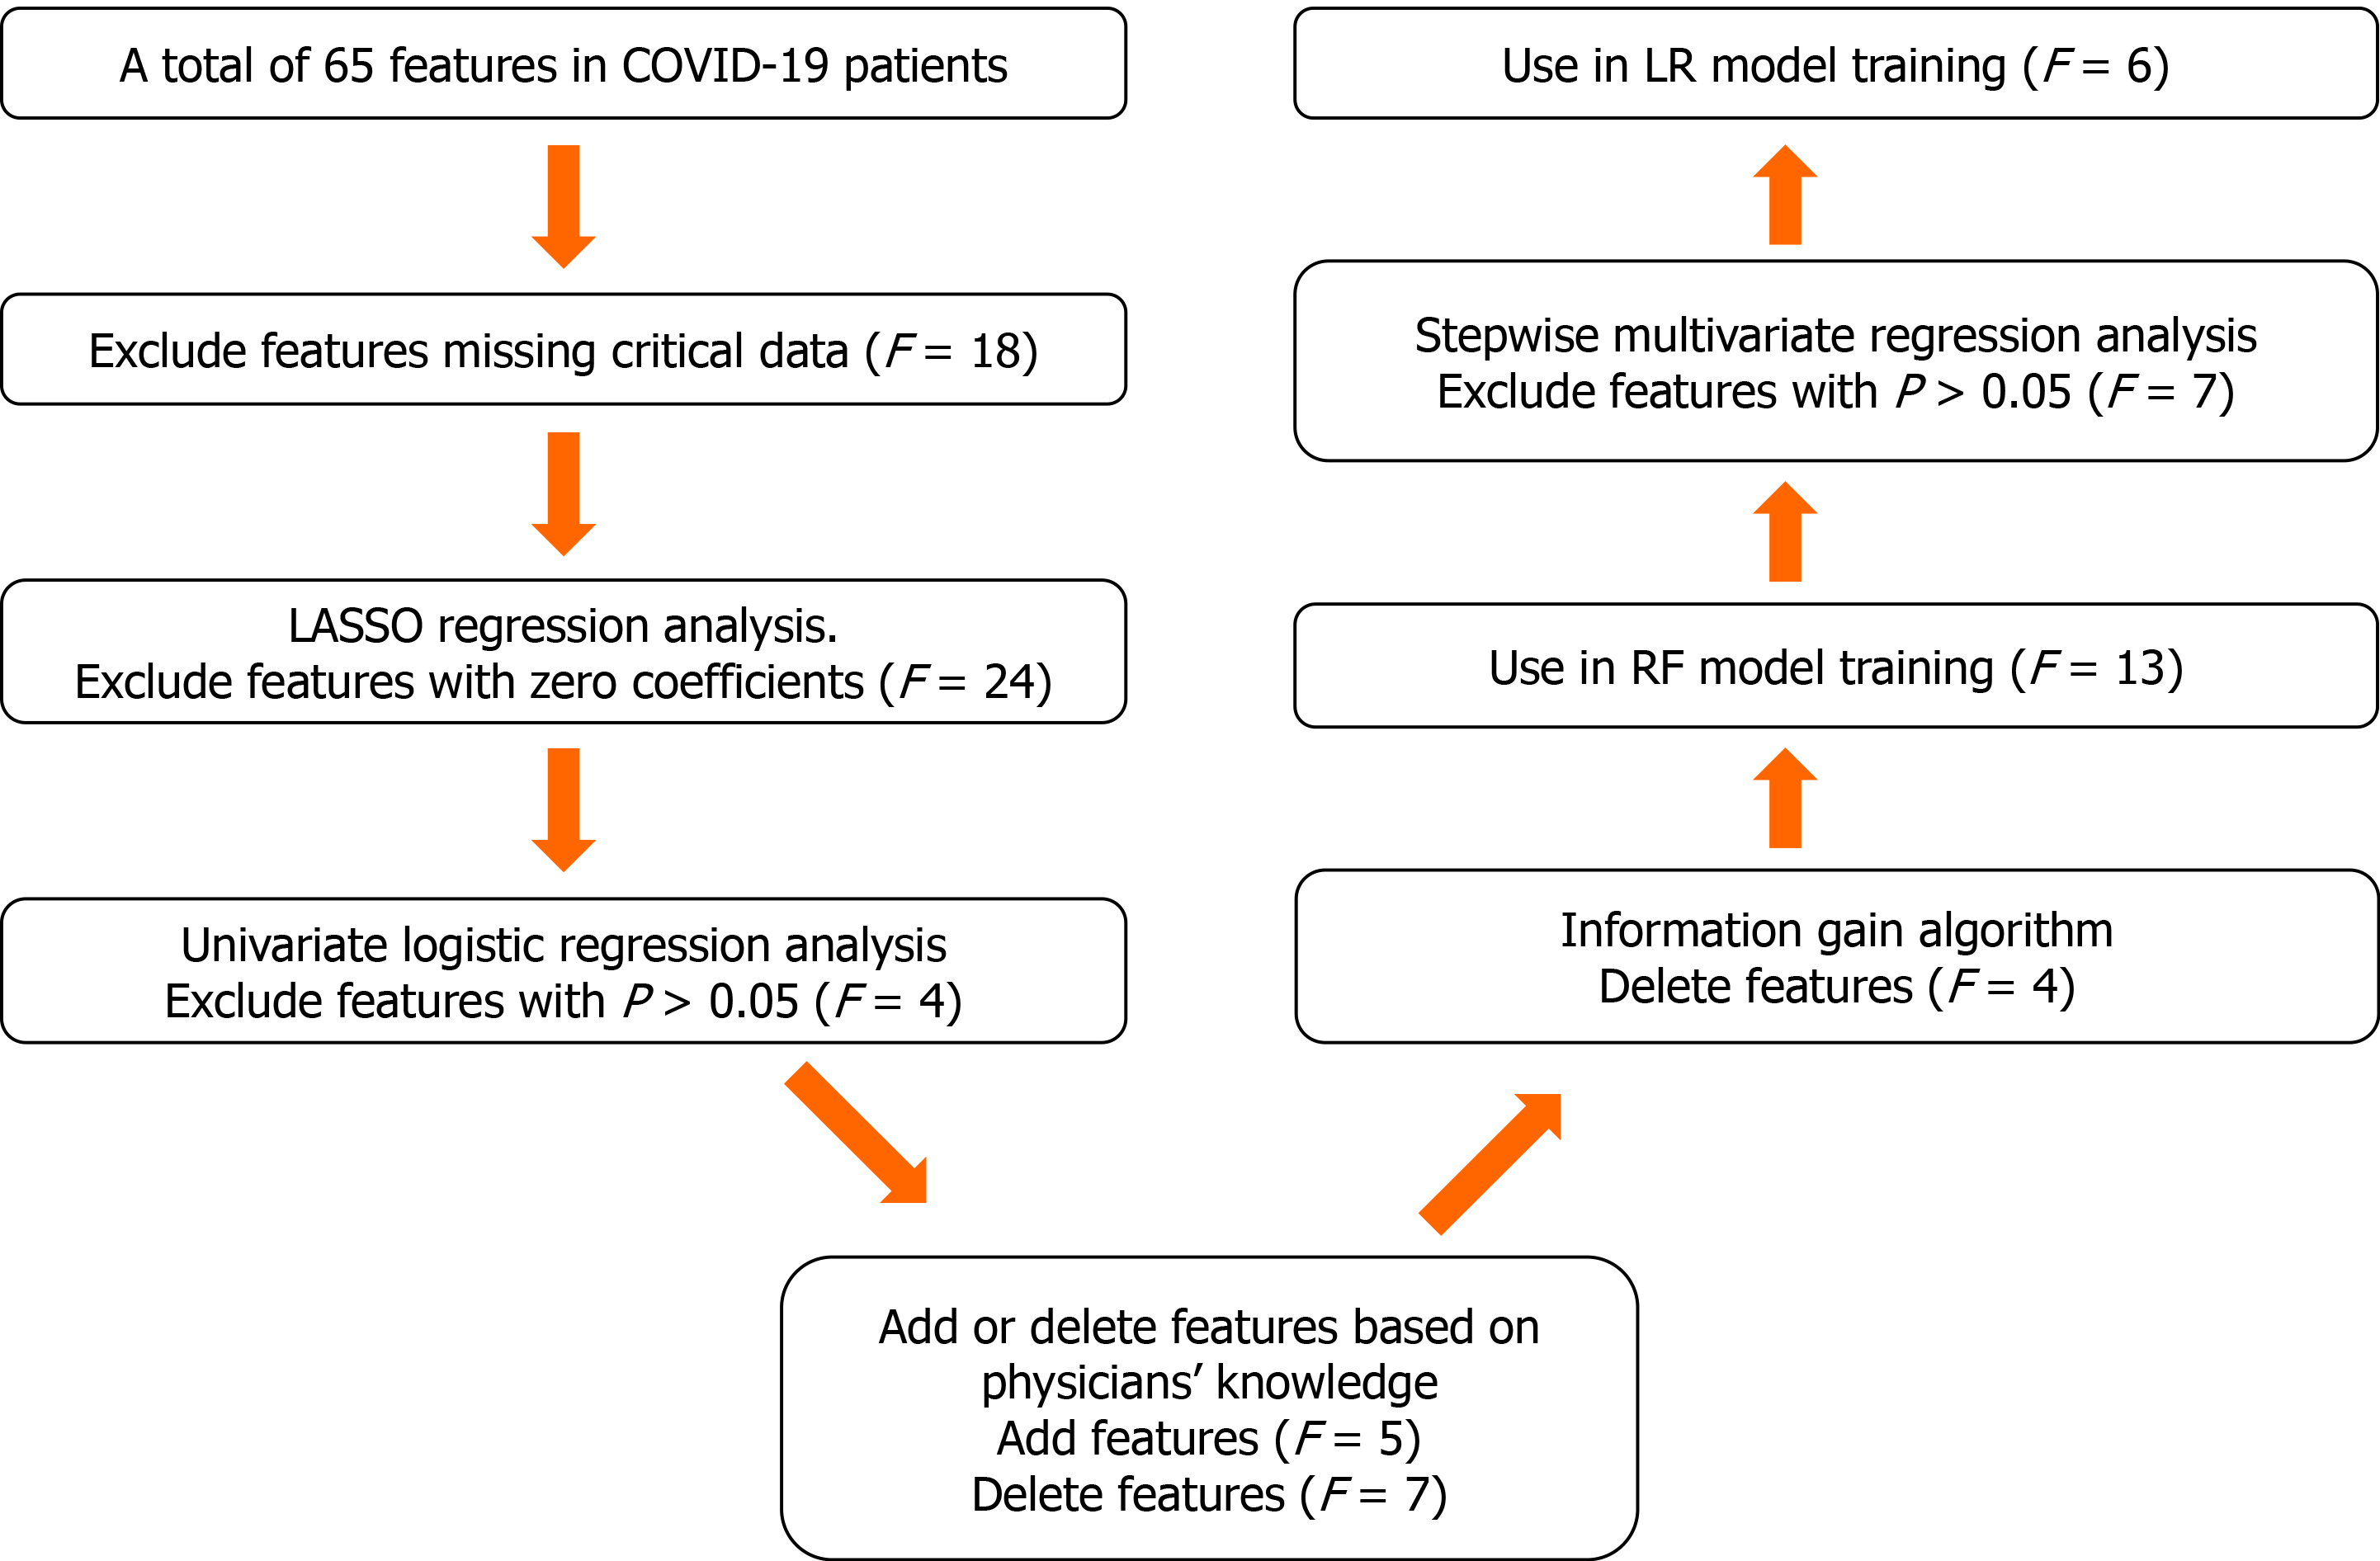
Figure 2 Feature selection.
Thirteen predictors were selected in the information gain algorithm and were to train the random forest (RF) model. Six predictors with P < 0.05 were selected in the multivariate logistic regression (LR) analysis and were used to train the LR model. COVID-19: Coronavirus disease 2019; LASSO: Least absolute shrinkage and selection operator.
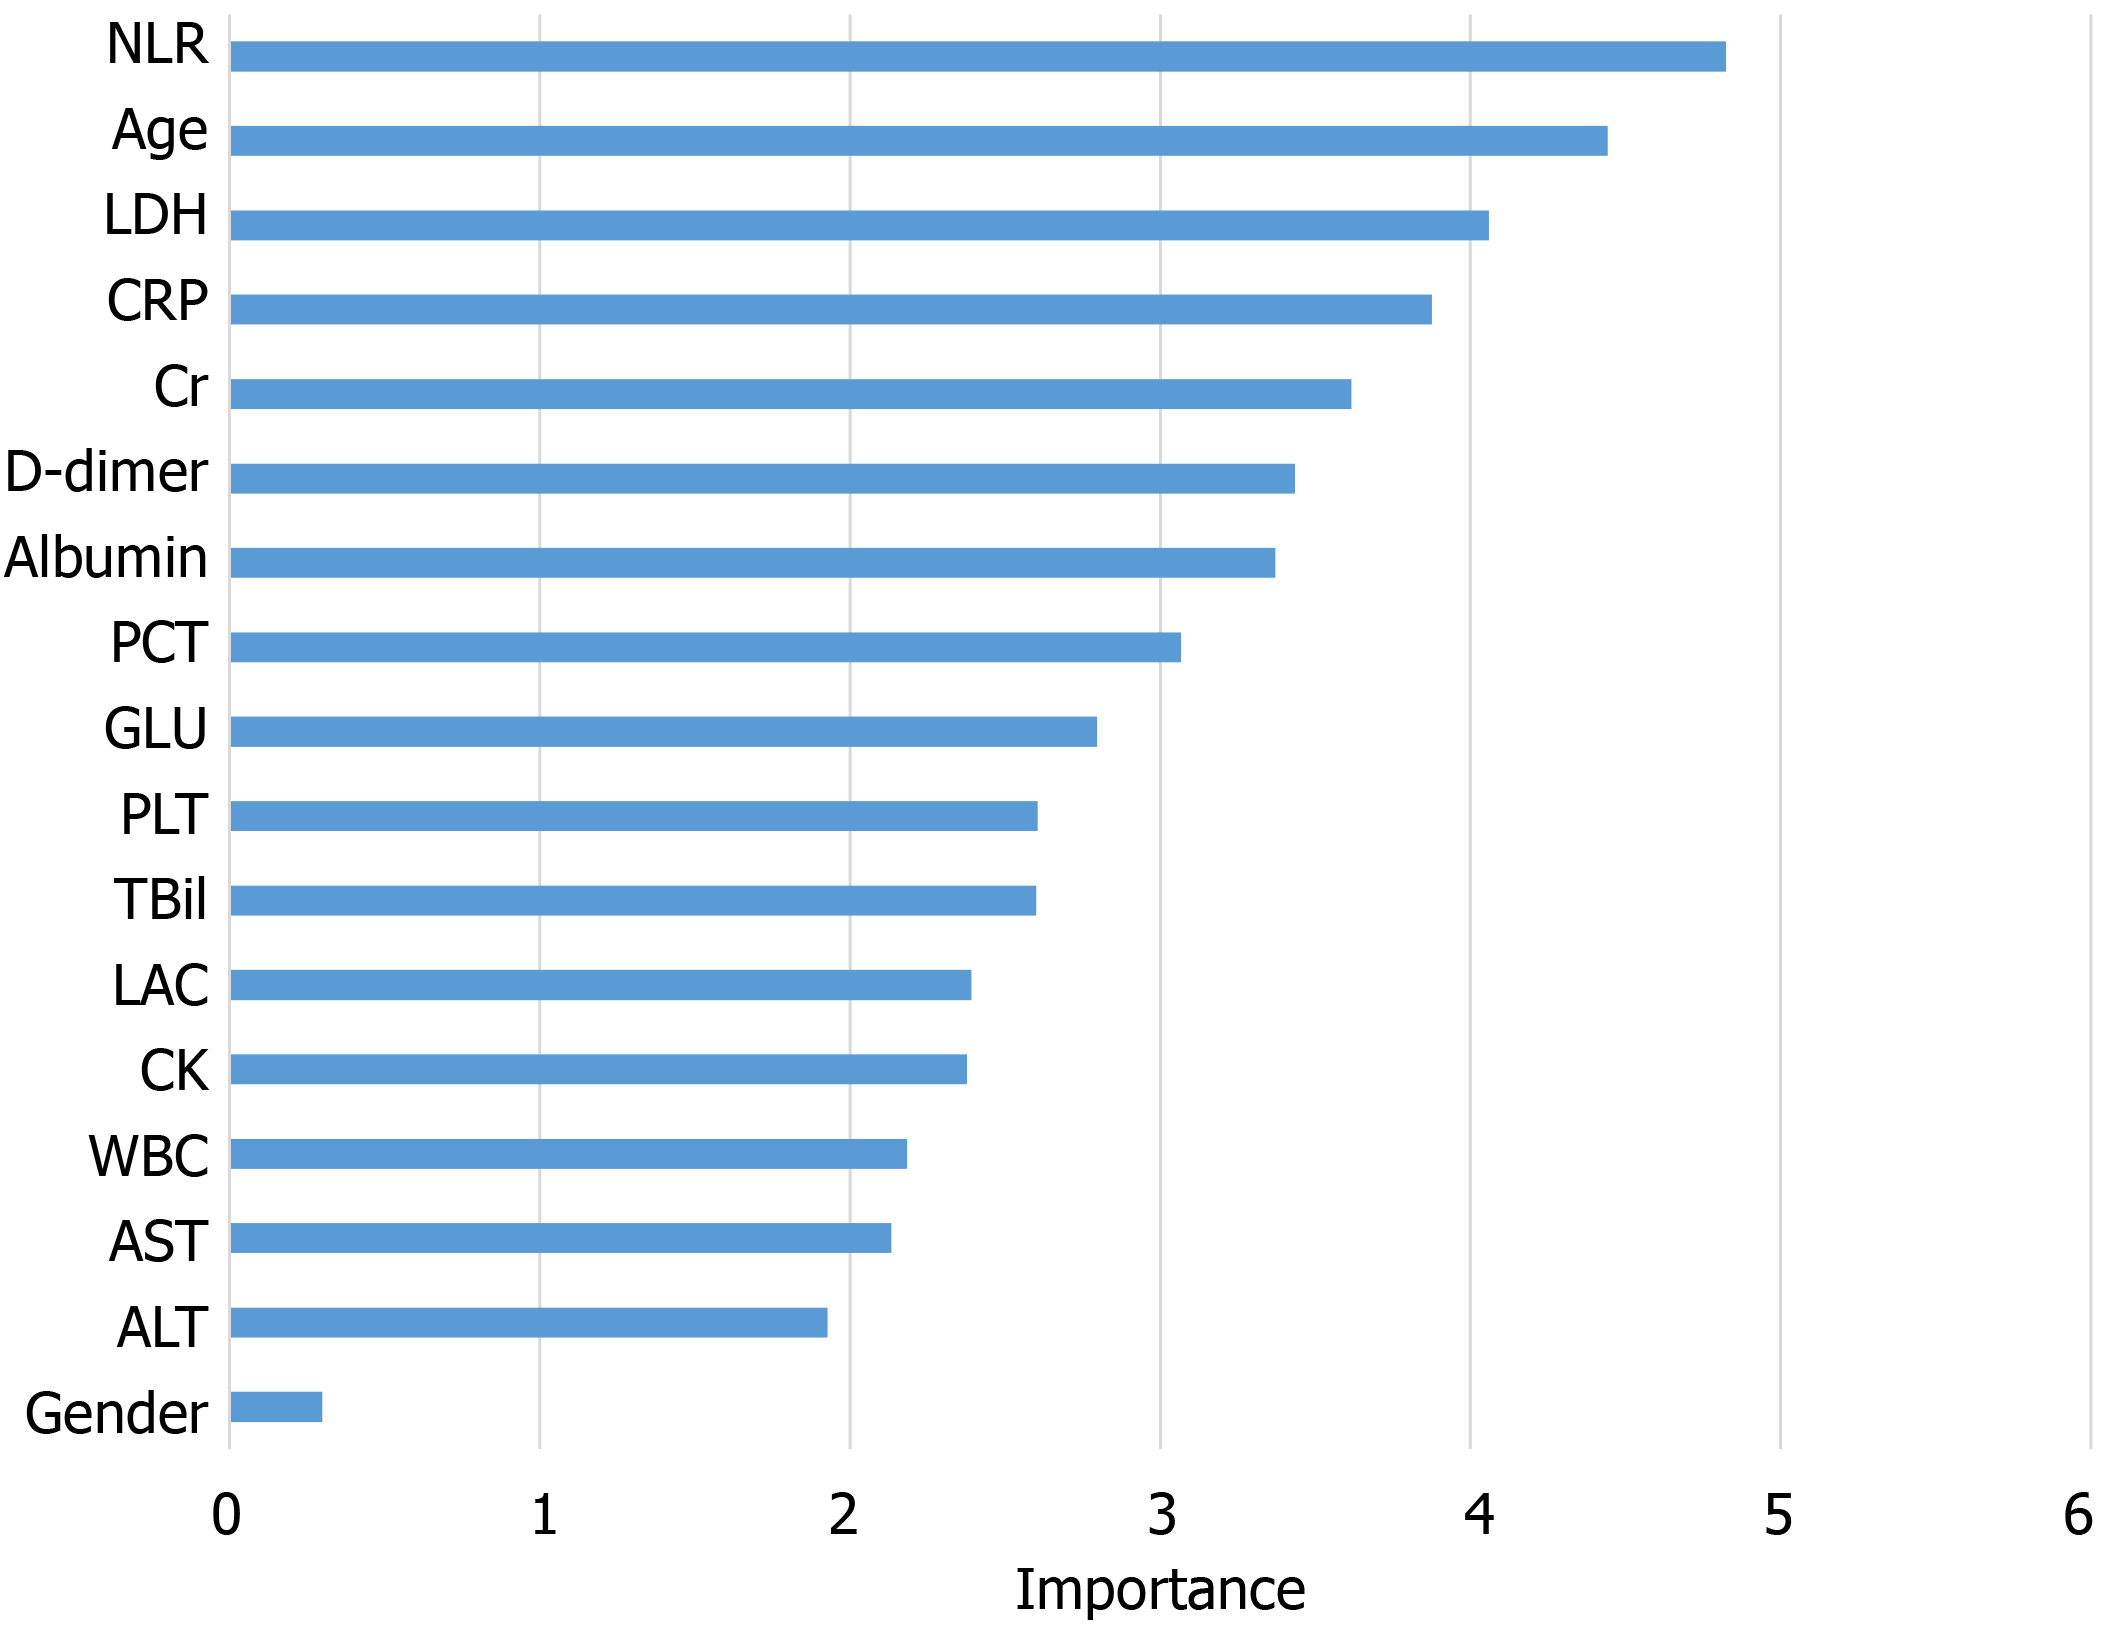
Figure 3 Importance of the variables included in the predictive model for coronavirus disease 2019 events based on the random forest algorithm.
ALT: Alanine transaminase; AST: Aspartate aminotransferase; CK: Creatine kinase; Cr: Creatinine; CRP: C-reactive protein; GLU: Glucose; LAC: Lactate; LDH: Lactate dehydrogenase; NLR: Neutrophil-to-lymphocyte ratio; PCT: Procalcitonin; PLT: Platelet; TBil: Total bilirubin; WBC: White blood cell.
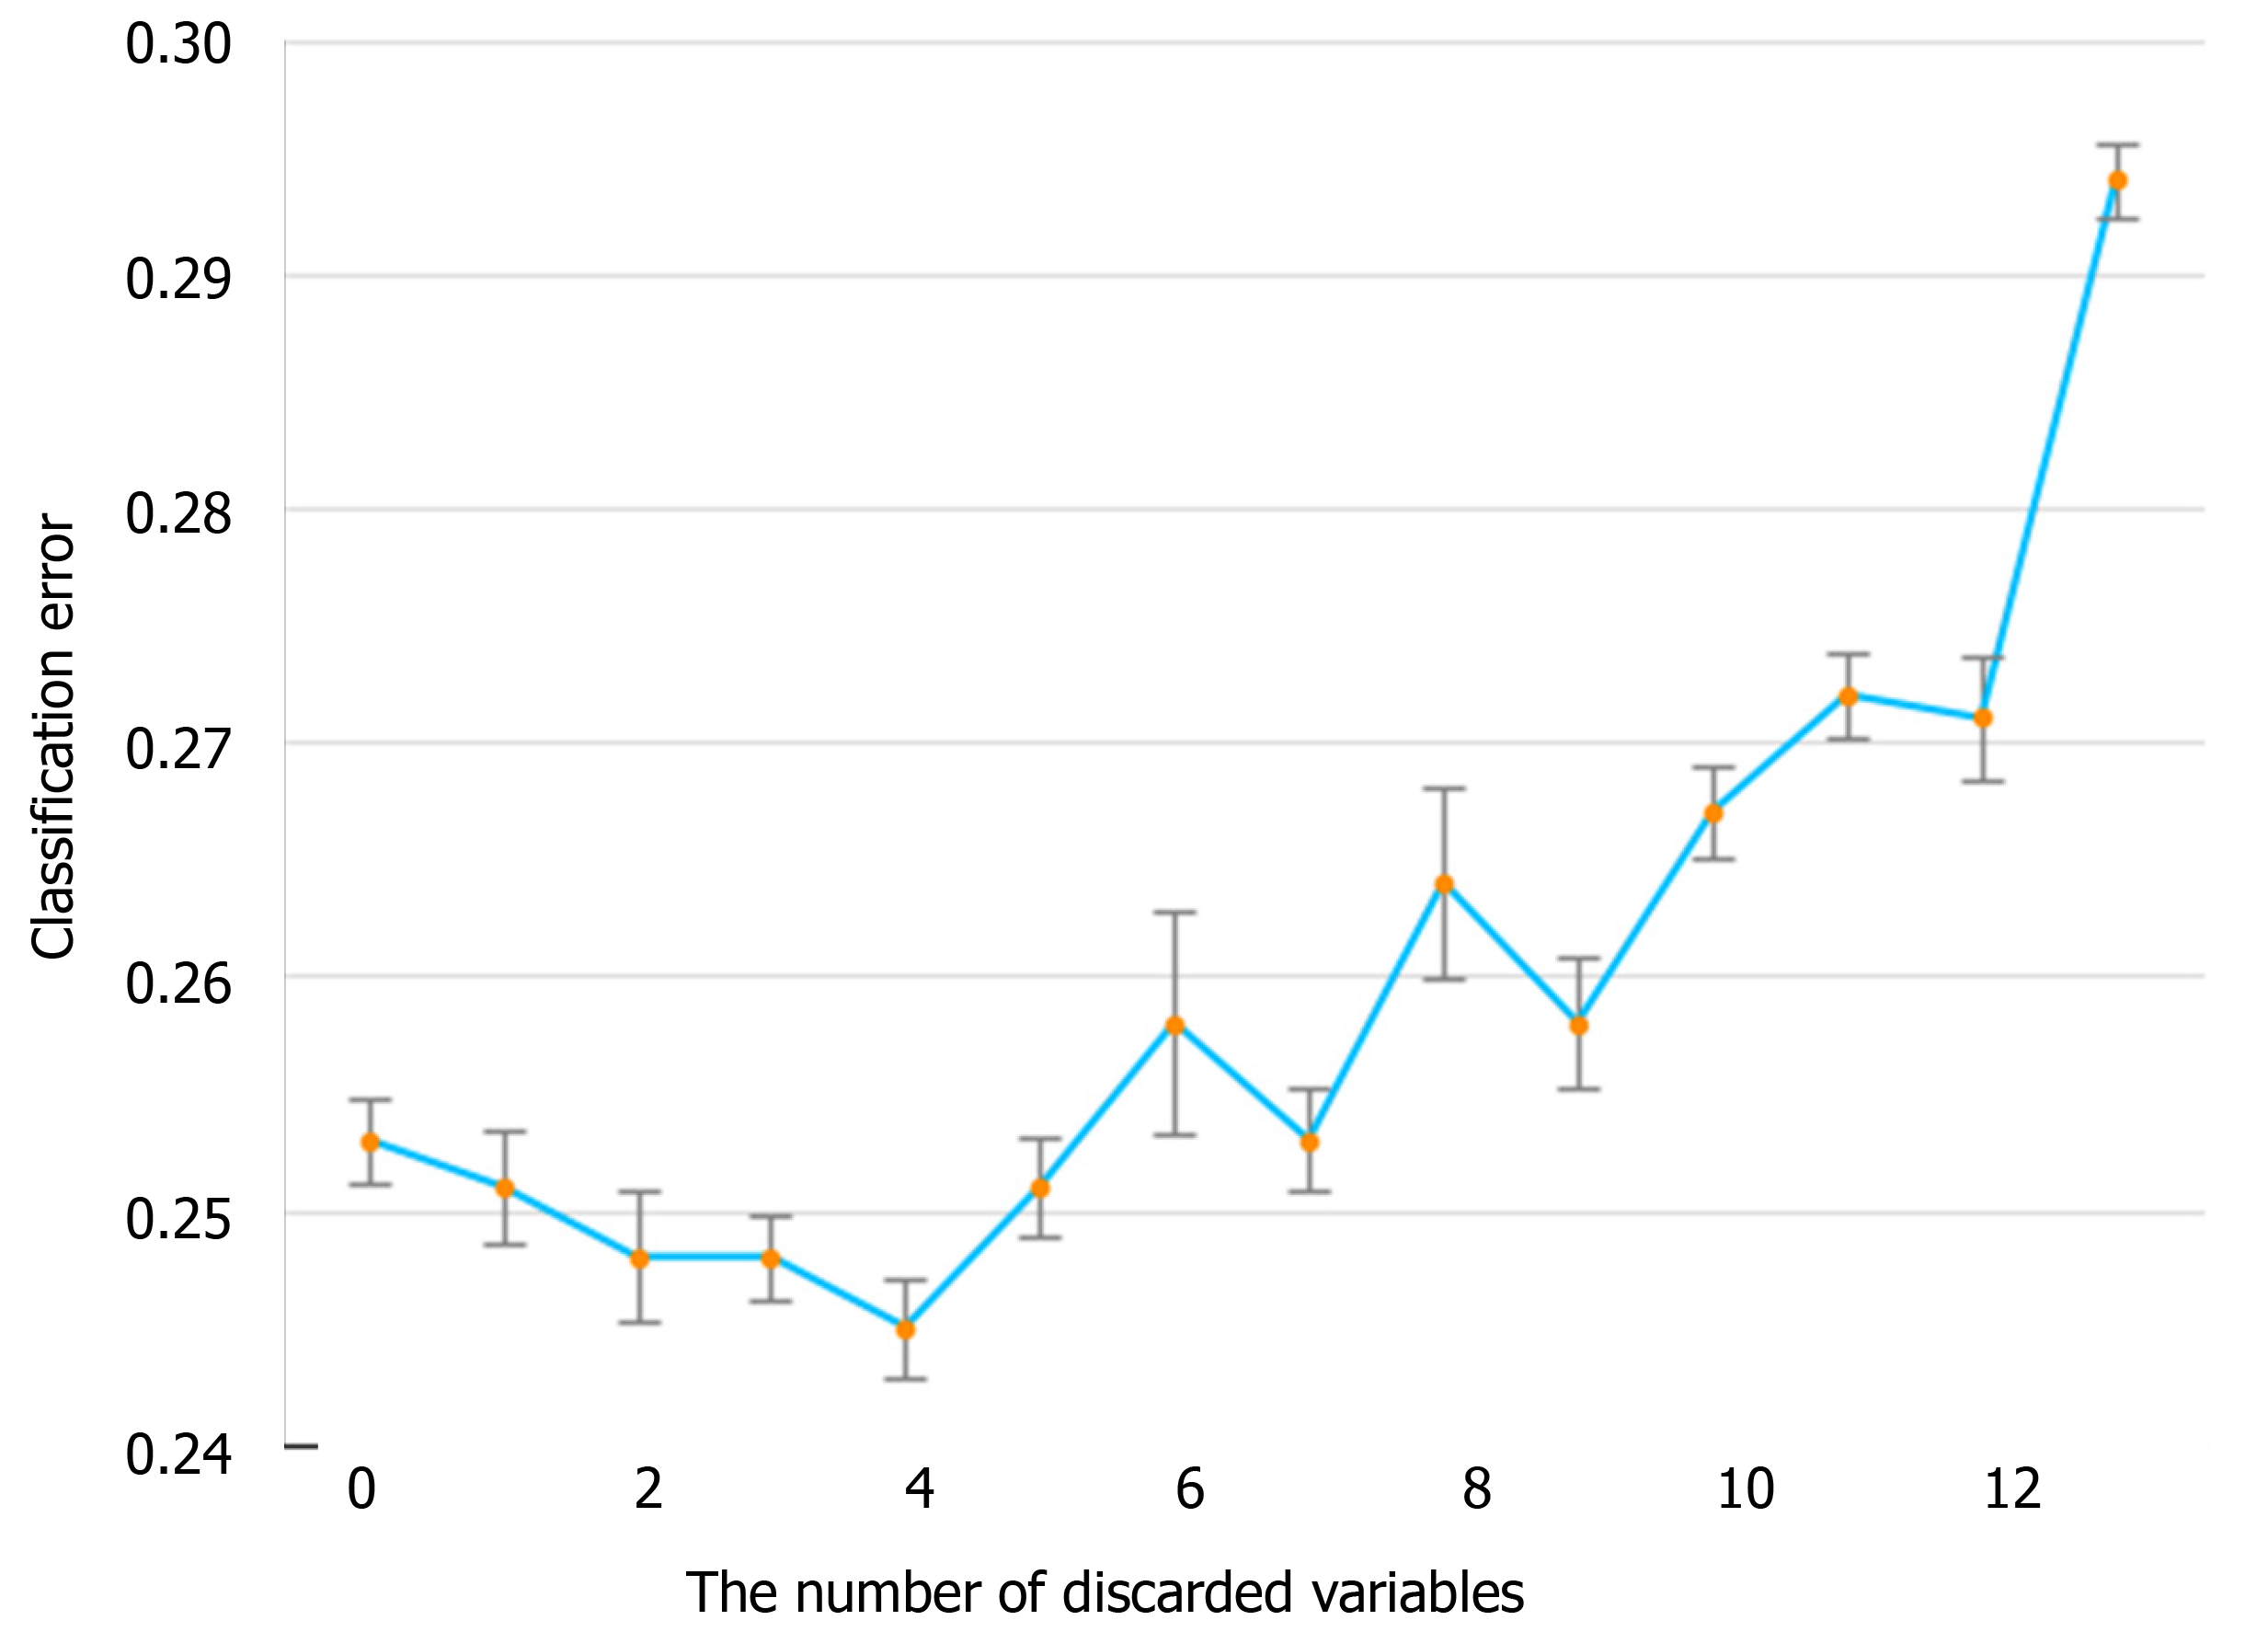
Figure 4 Relationship between the number of discarded variables and classification error.
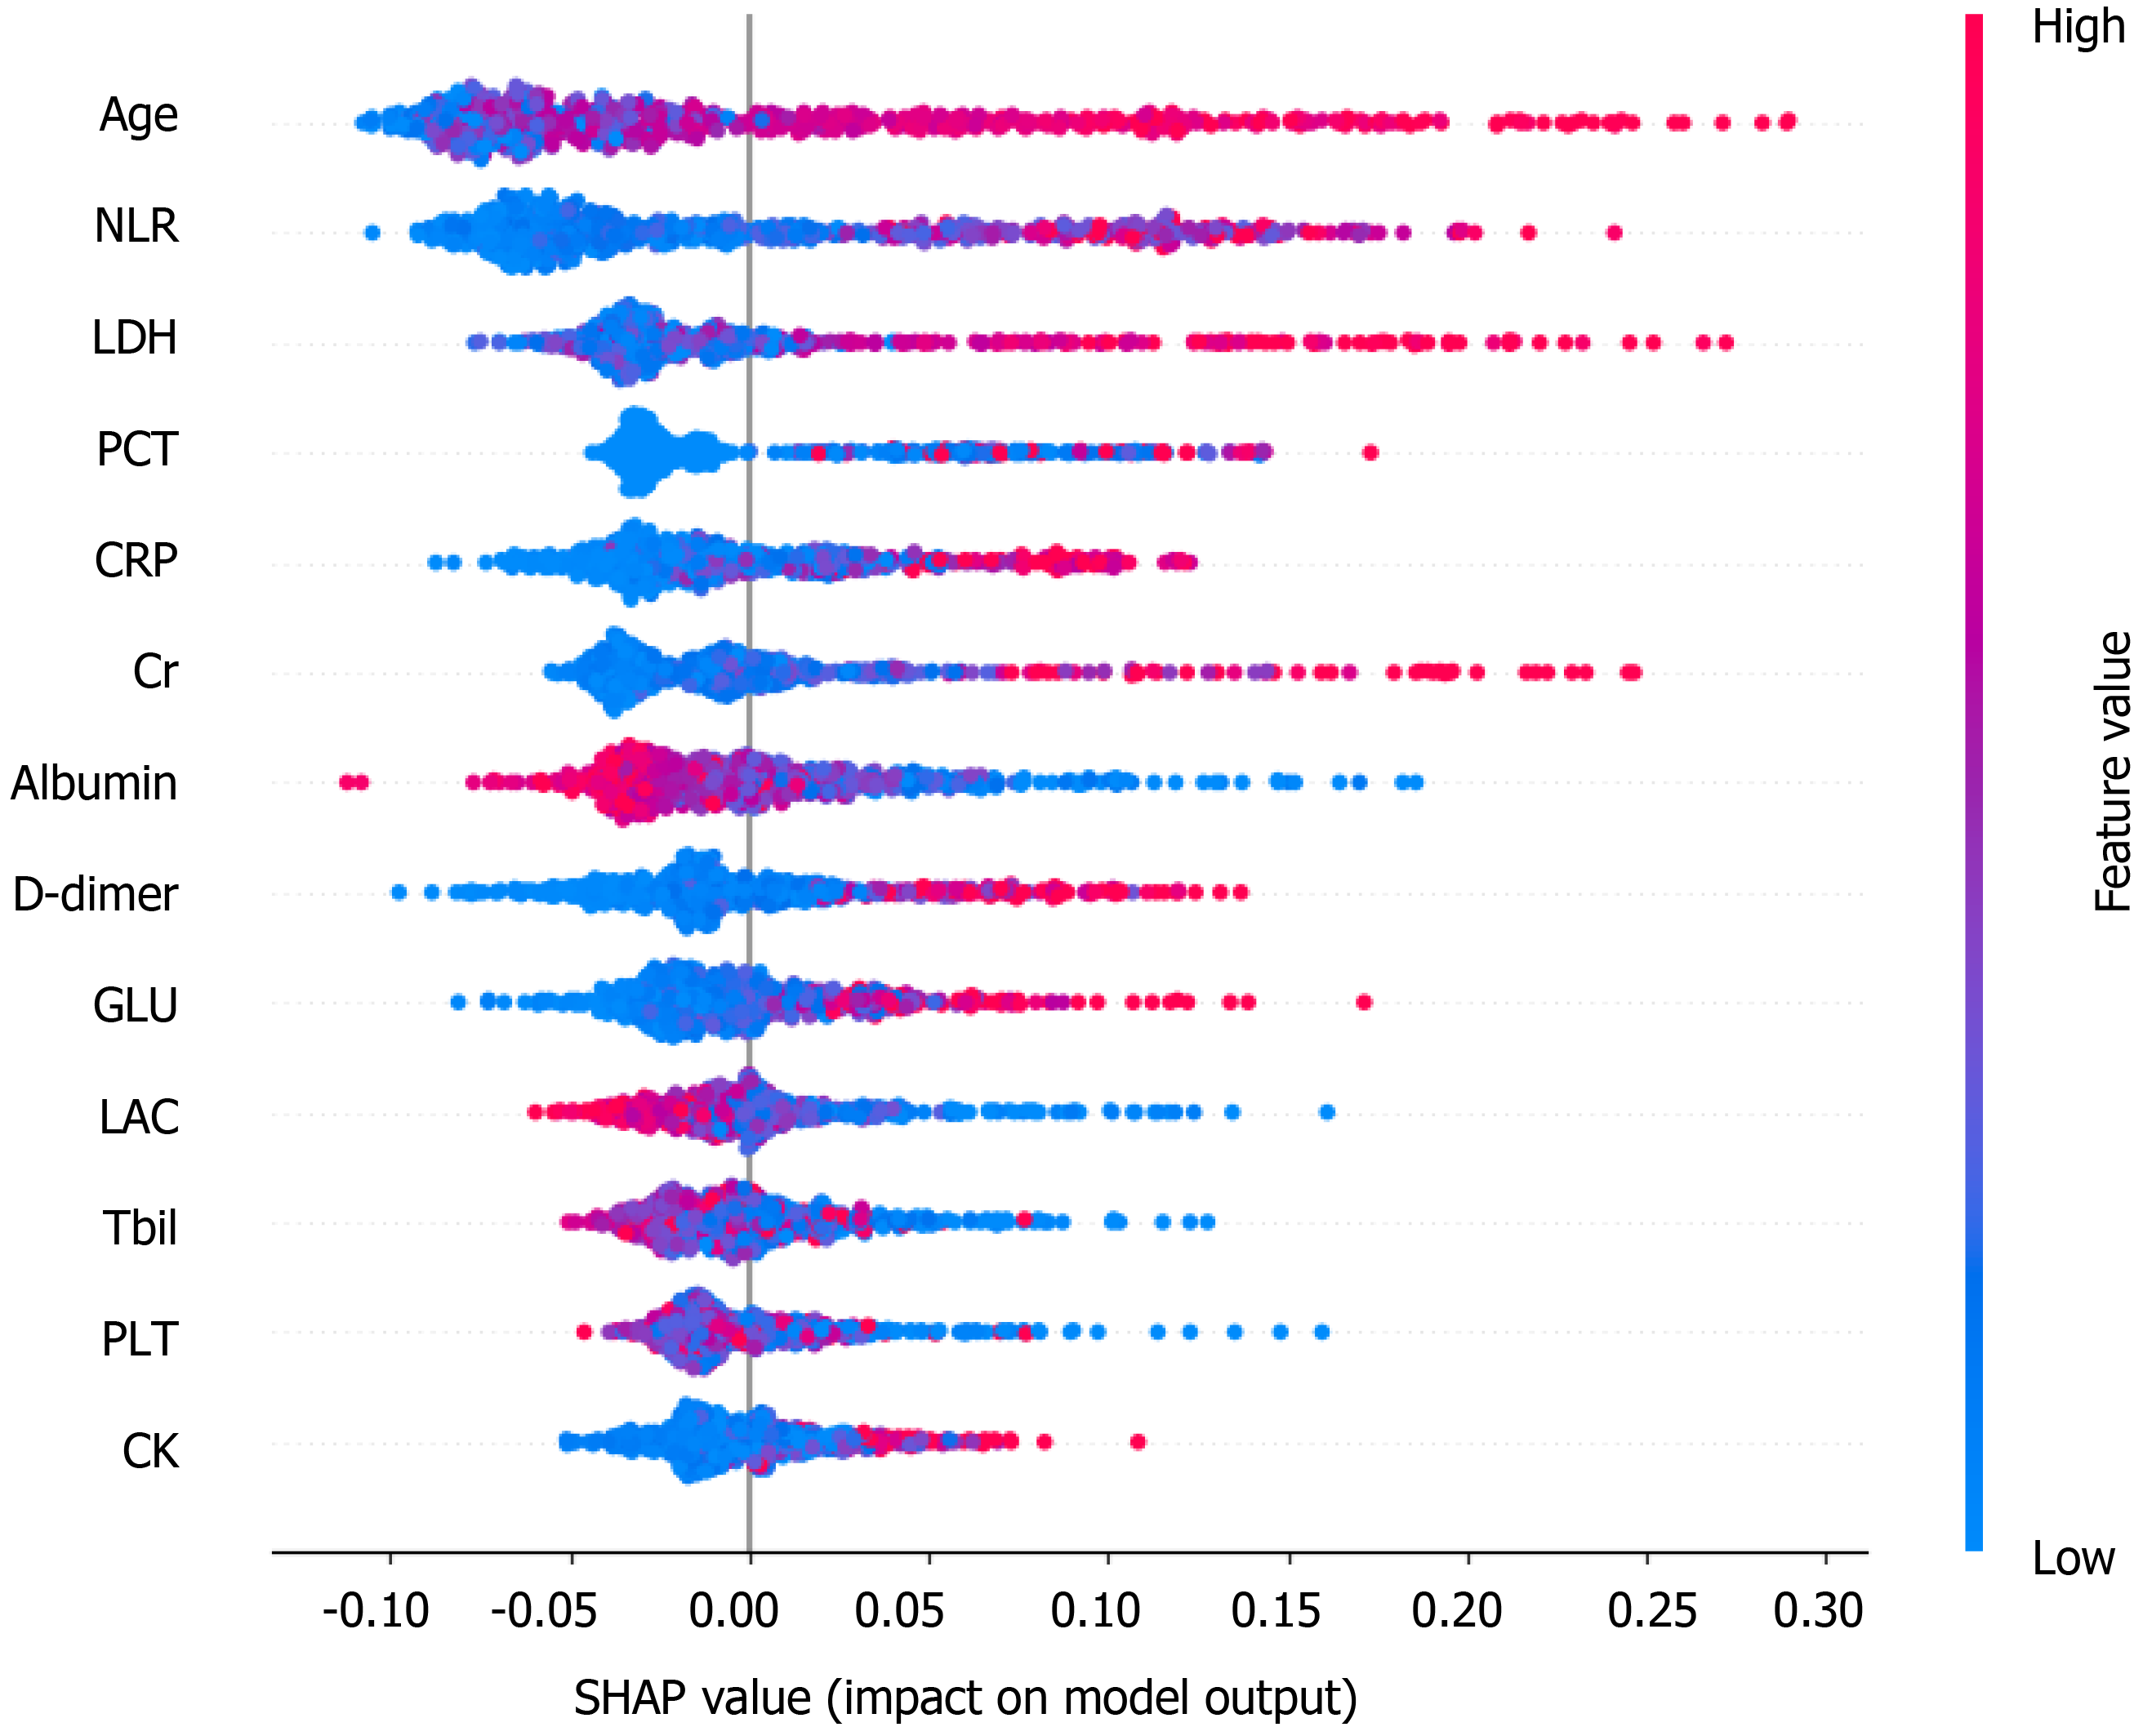
Figure 5 SHapley Additive exPlanations values of every feature used to train the random forest model for every sample.
Each dot corresponds to an individual person in the study. The dot’s position on the X axis shows the impact that feature has on the model’s prediction for that person. The color represents the feature value (red high, blue low). This reveals for example that an older age increases the predicted intensive care unit admission probability. CK: Creatine kinase; Cr: Creatinine; CRP: C-reactive protein; GLU: Glucose; LAC: Lactate; LDH: Lactate dehydrogenase; NLR: Neutrophil-to-lymphocyte ratio; PCT: Procalcitonin; PLT: Platelet; TBil: Total bilirubin.
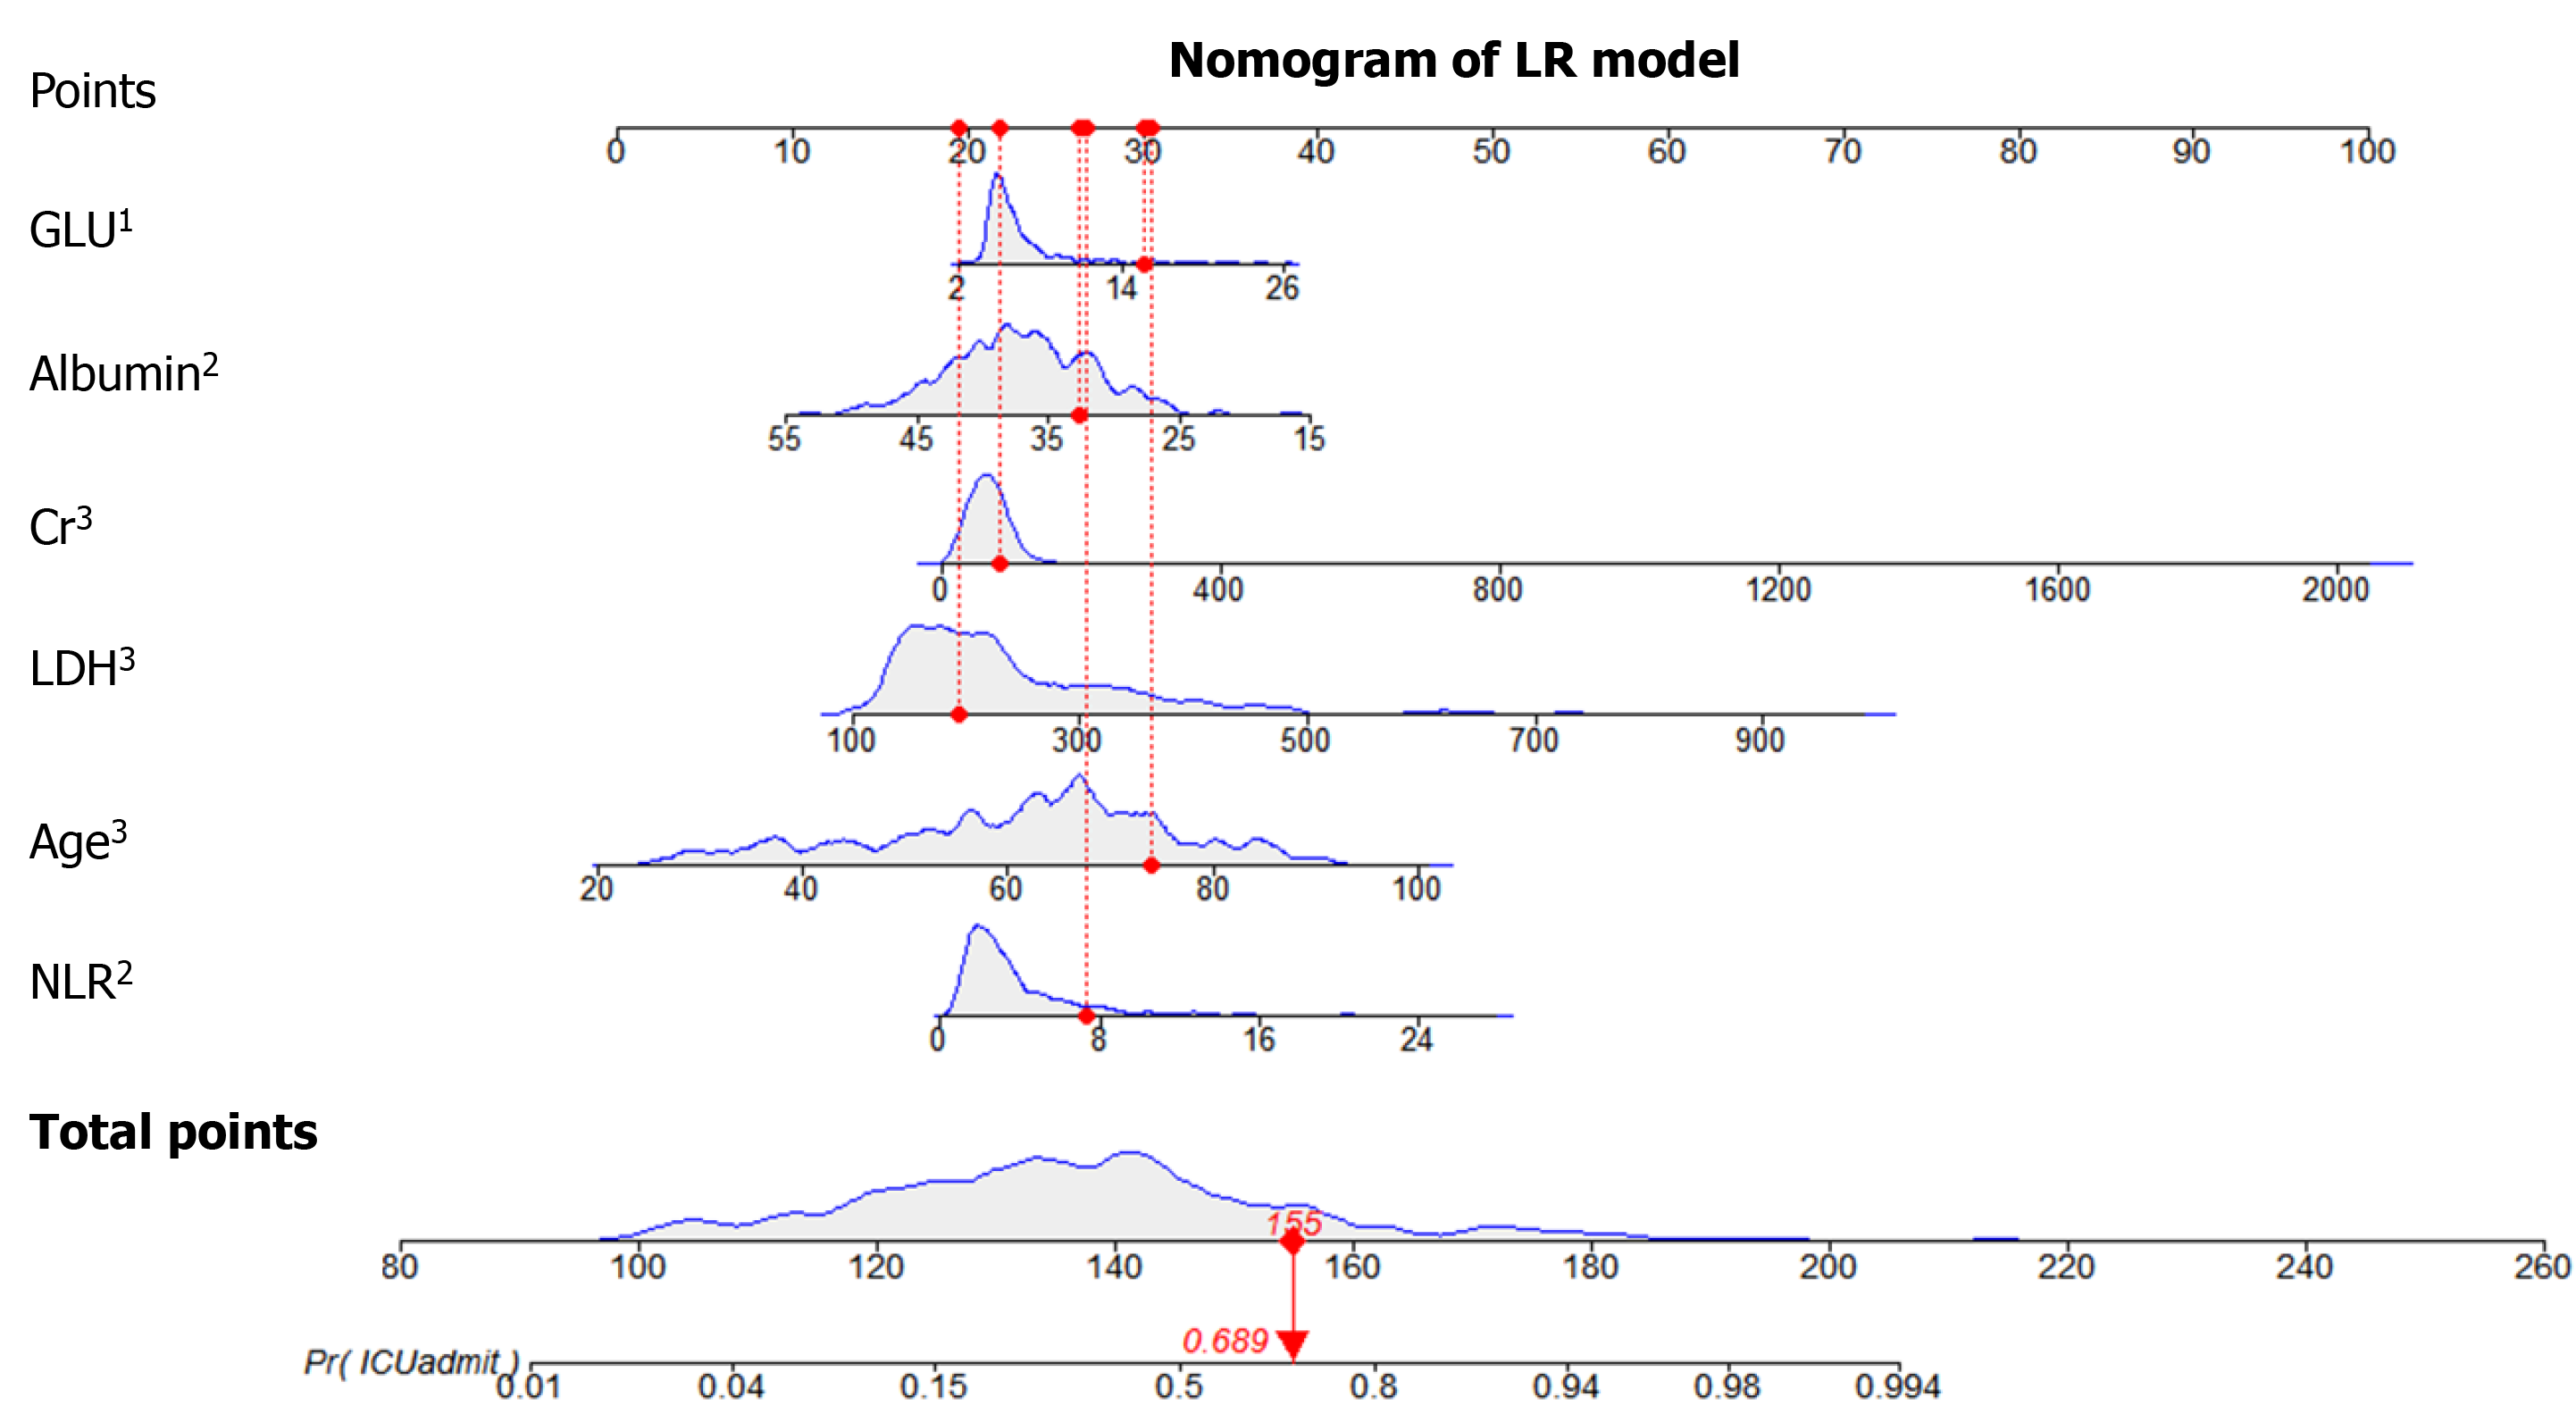
Figure 6 Nomogram of the logistic regression model to triage coronavirus disease 2019 patients.
One patient had a total nomogram score of 155 points, and the probability of intensive care unit admission was 0.689. 1Shows significance between 0.01 and 0.05; 2Shows significance between 0.001 and 0.01; 3Shows significance at a value of < 0.001. Cr: Creatinine; GLU: Glucose; LDH: Lactate dehydrogenase; LR: Logistic regression; NLR: Neutrophil-to-lymphocyte ratio.
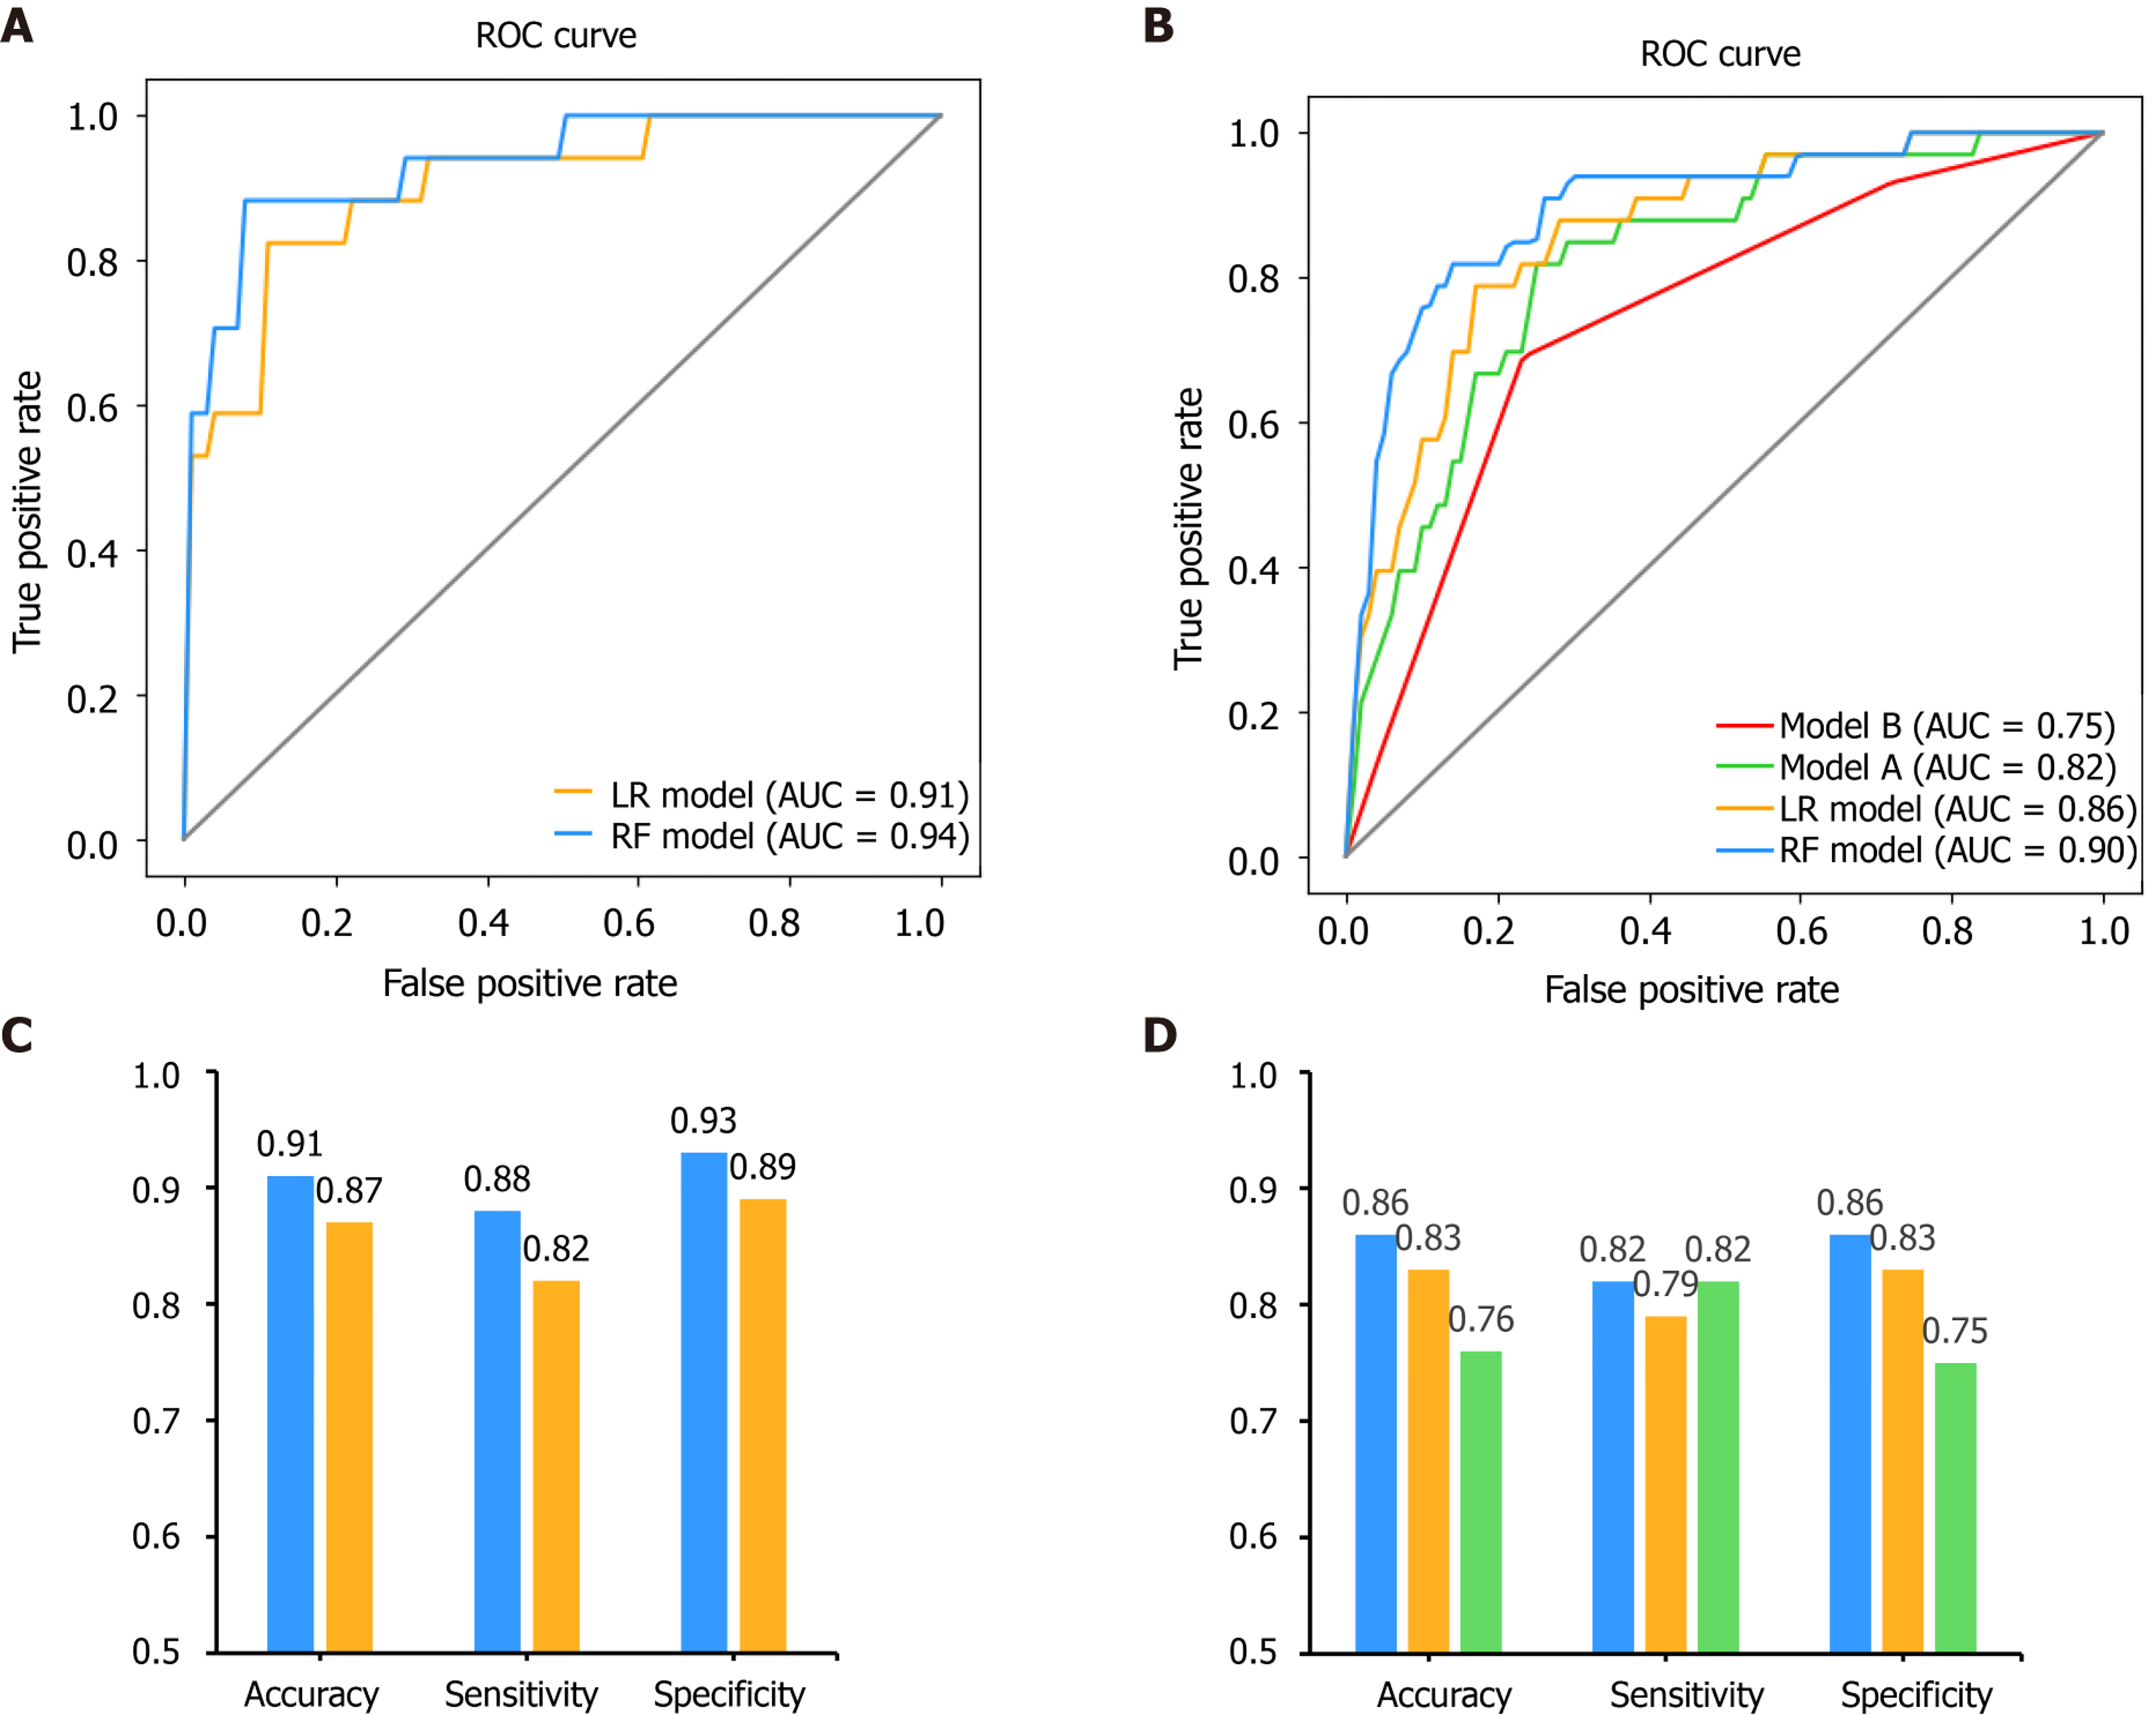
Figure 7 Performances of the newly developed prediction models and traditional scoring systems for internal and external validation.
A: The receiver operating characteristic (ROC) curve for the random forest (RF) model and the logistic regression (LR) model; B: Receiver operating characteristic curve for models RF, LR, A and B; C: The performance matrix comparison for the RF model and the LR model; D: The performance matrix for models RF, LR and A. Internal validation: A and C. External validation: B and D. The performance matrix of RF, LR and model A models are shown in blue, orange and green, respectively. AUC: Area under the receiver operating characteristic curve.
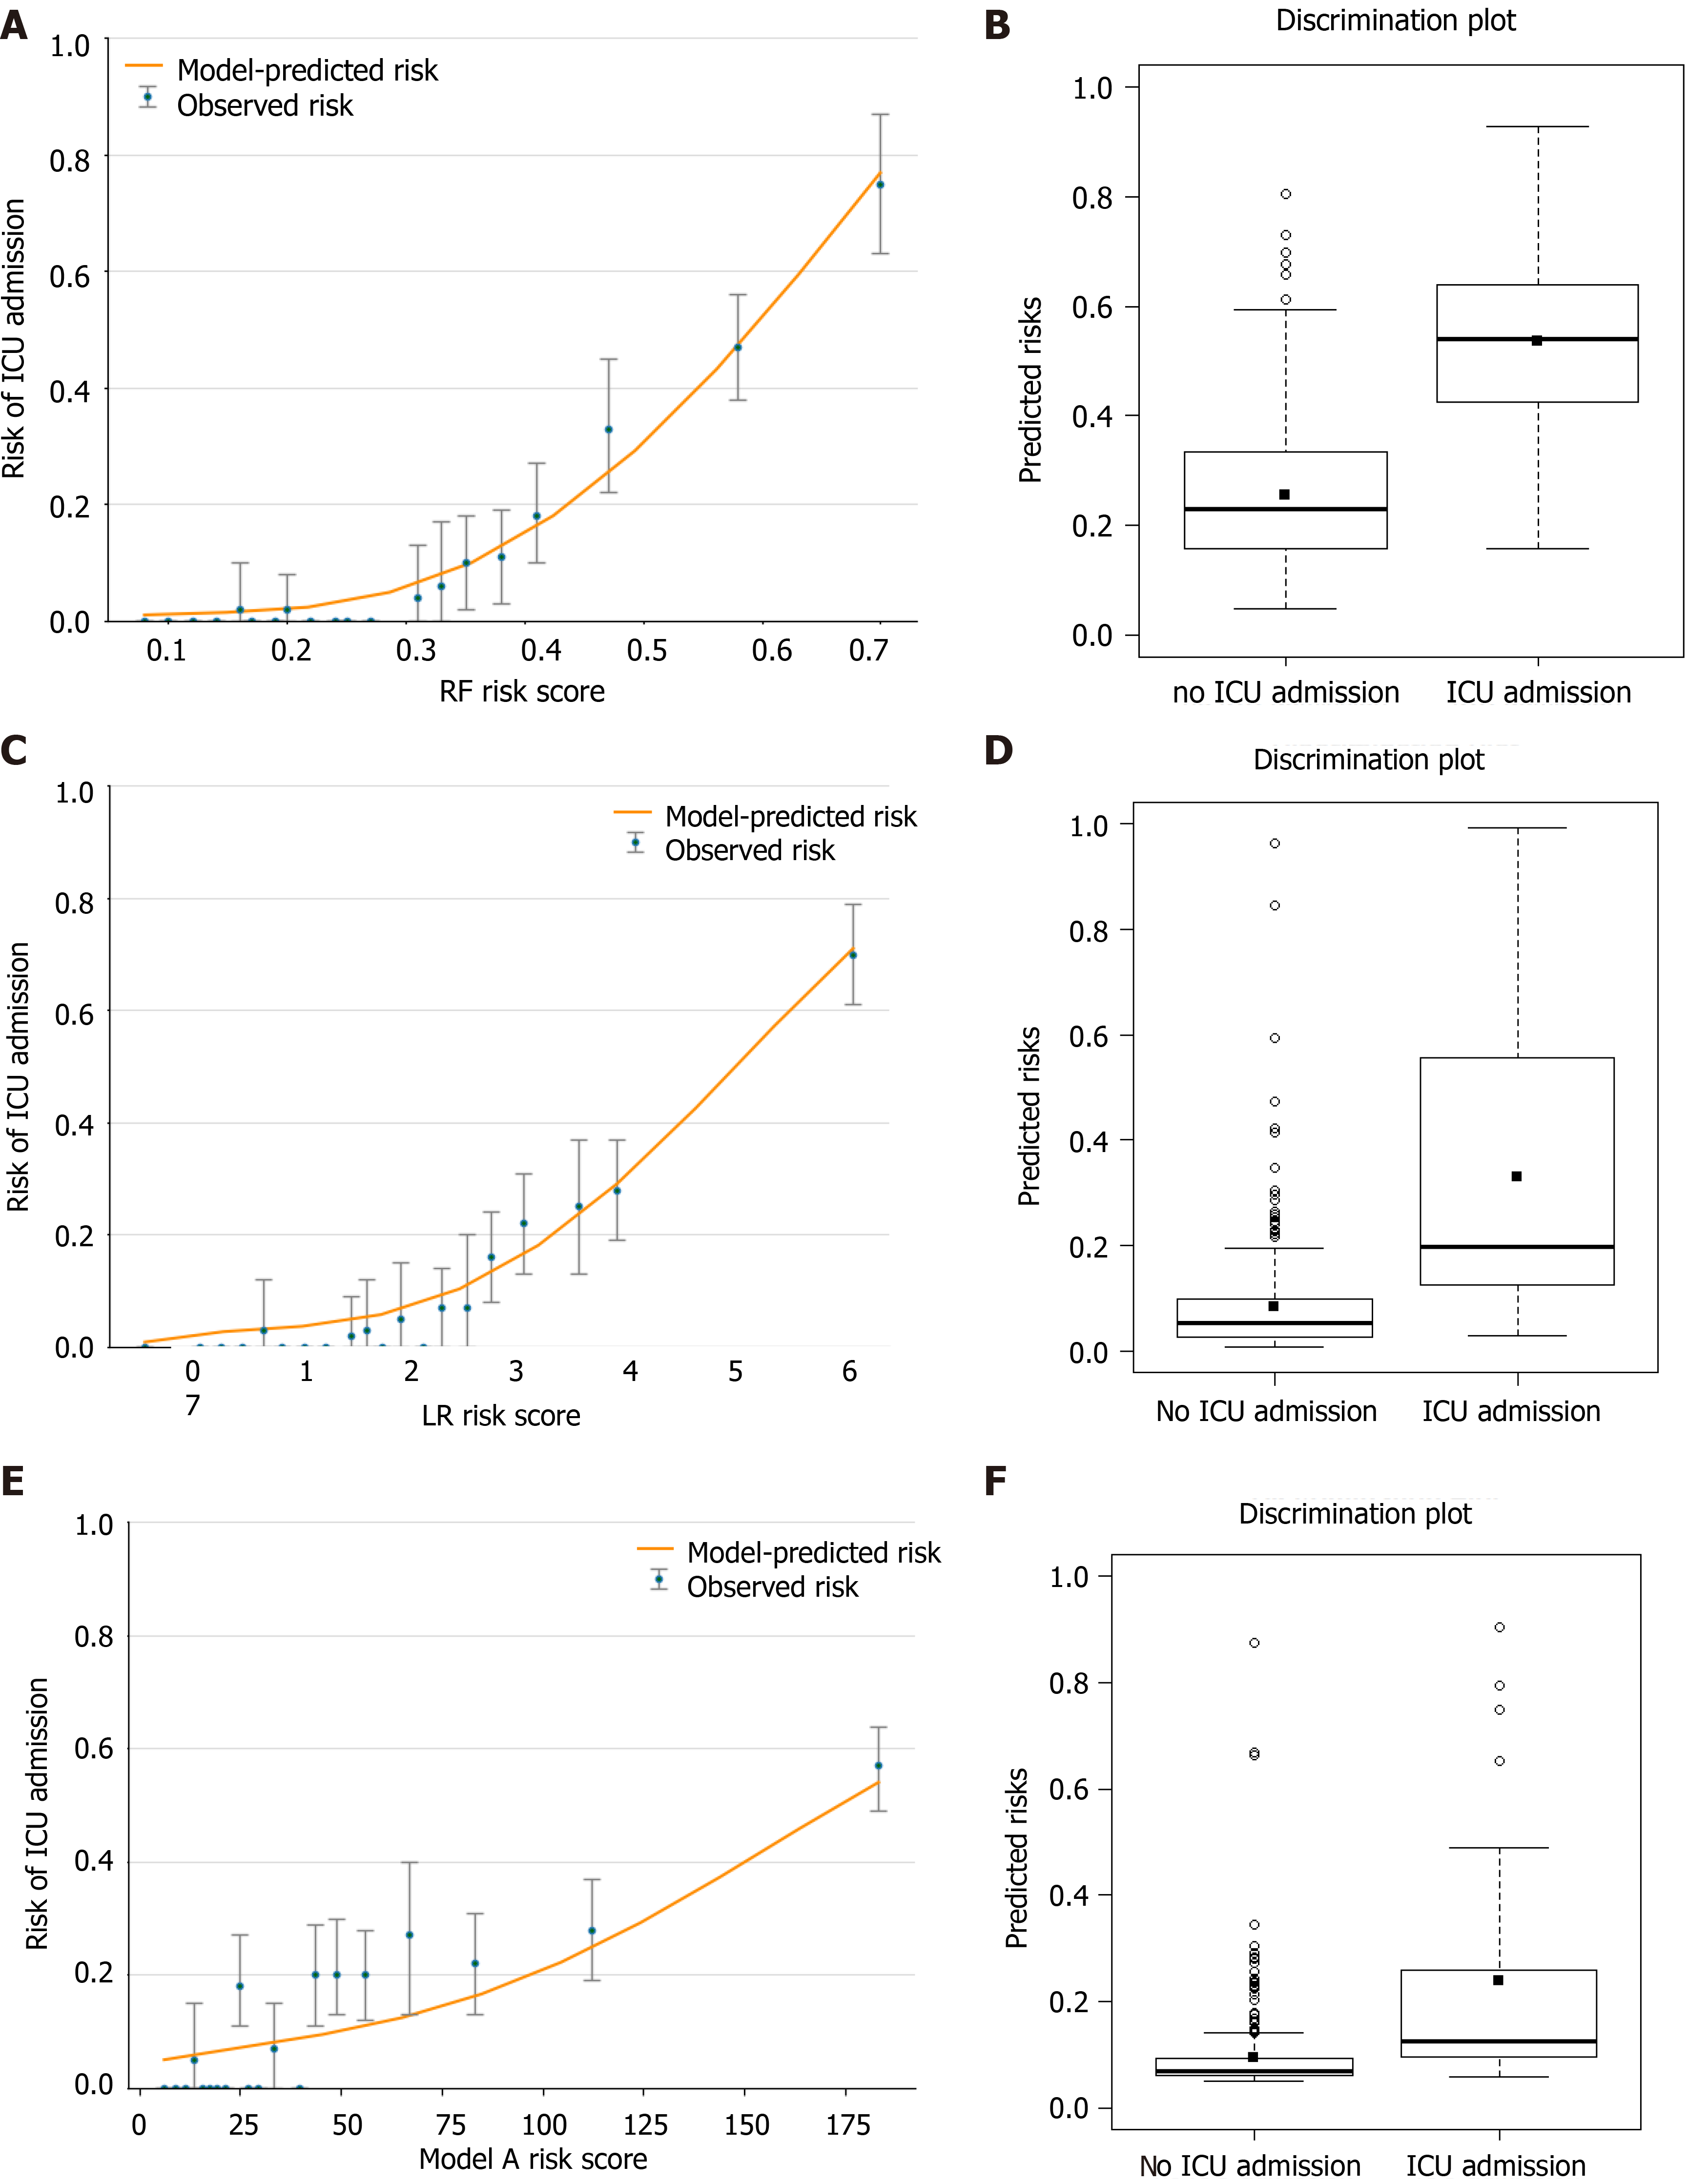
Figure 8 The calibration and discrimination of model random forest, logistic regression and A in external validation dataset.
A, C and E: The graph represents the relationship between observed (data markers represent the mean and the error bars represent the 95% confidence interval) and predicted risk of intensive care unit (ICU) admission using the models (orange line); B, D and F: The discrimination potentials of the random forest (RF), logistic regression (LR) and model A models. The values of the discrimination slope were 0.281, 0.246 and 0.143, respectively.
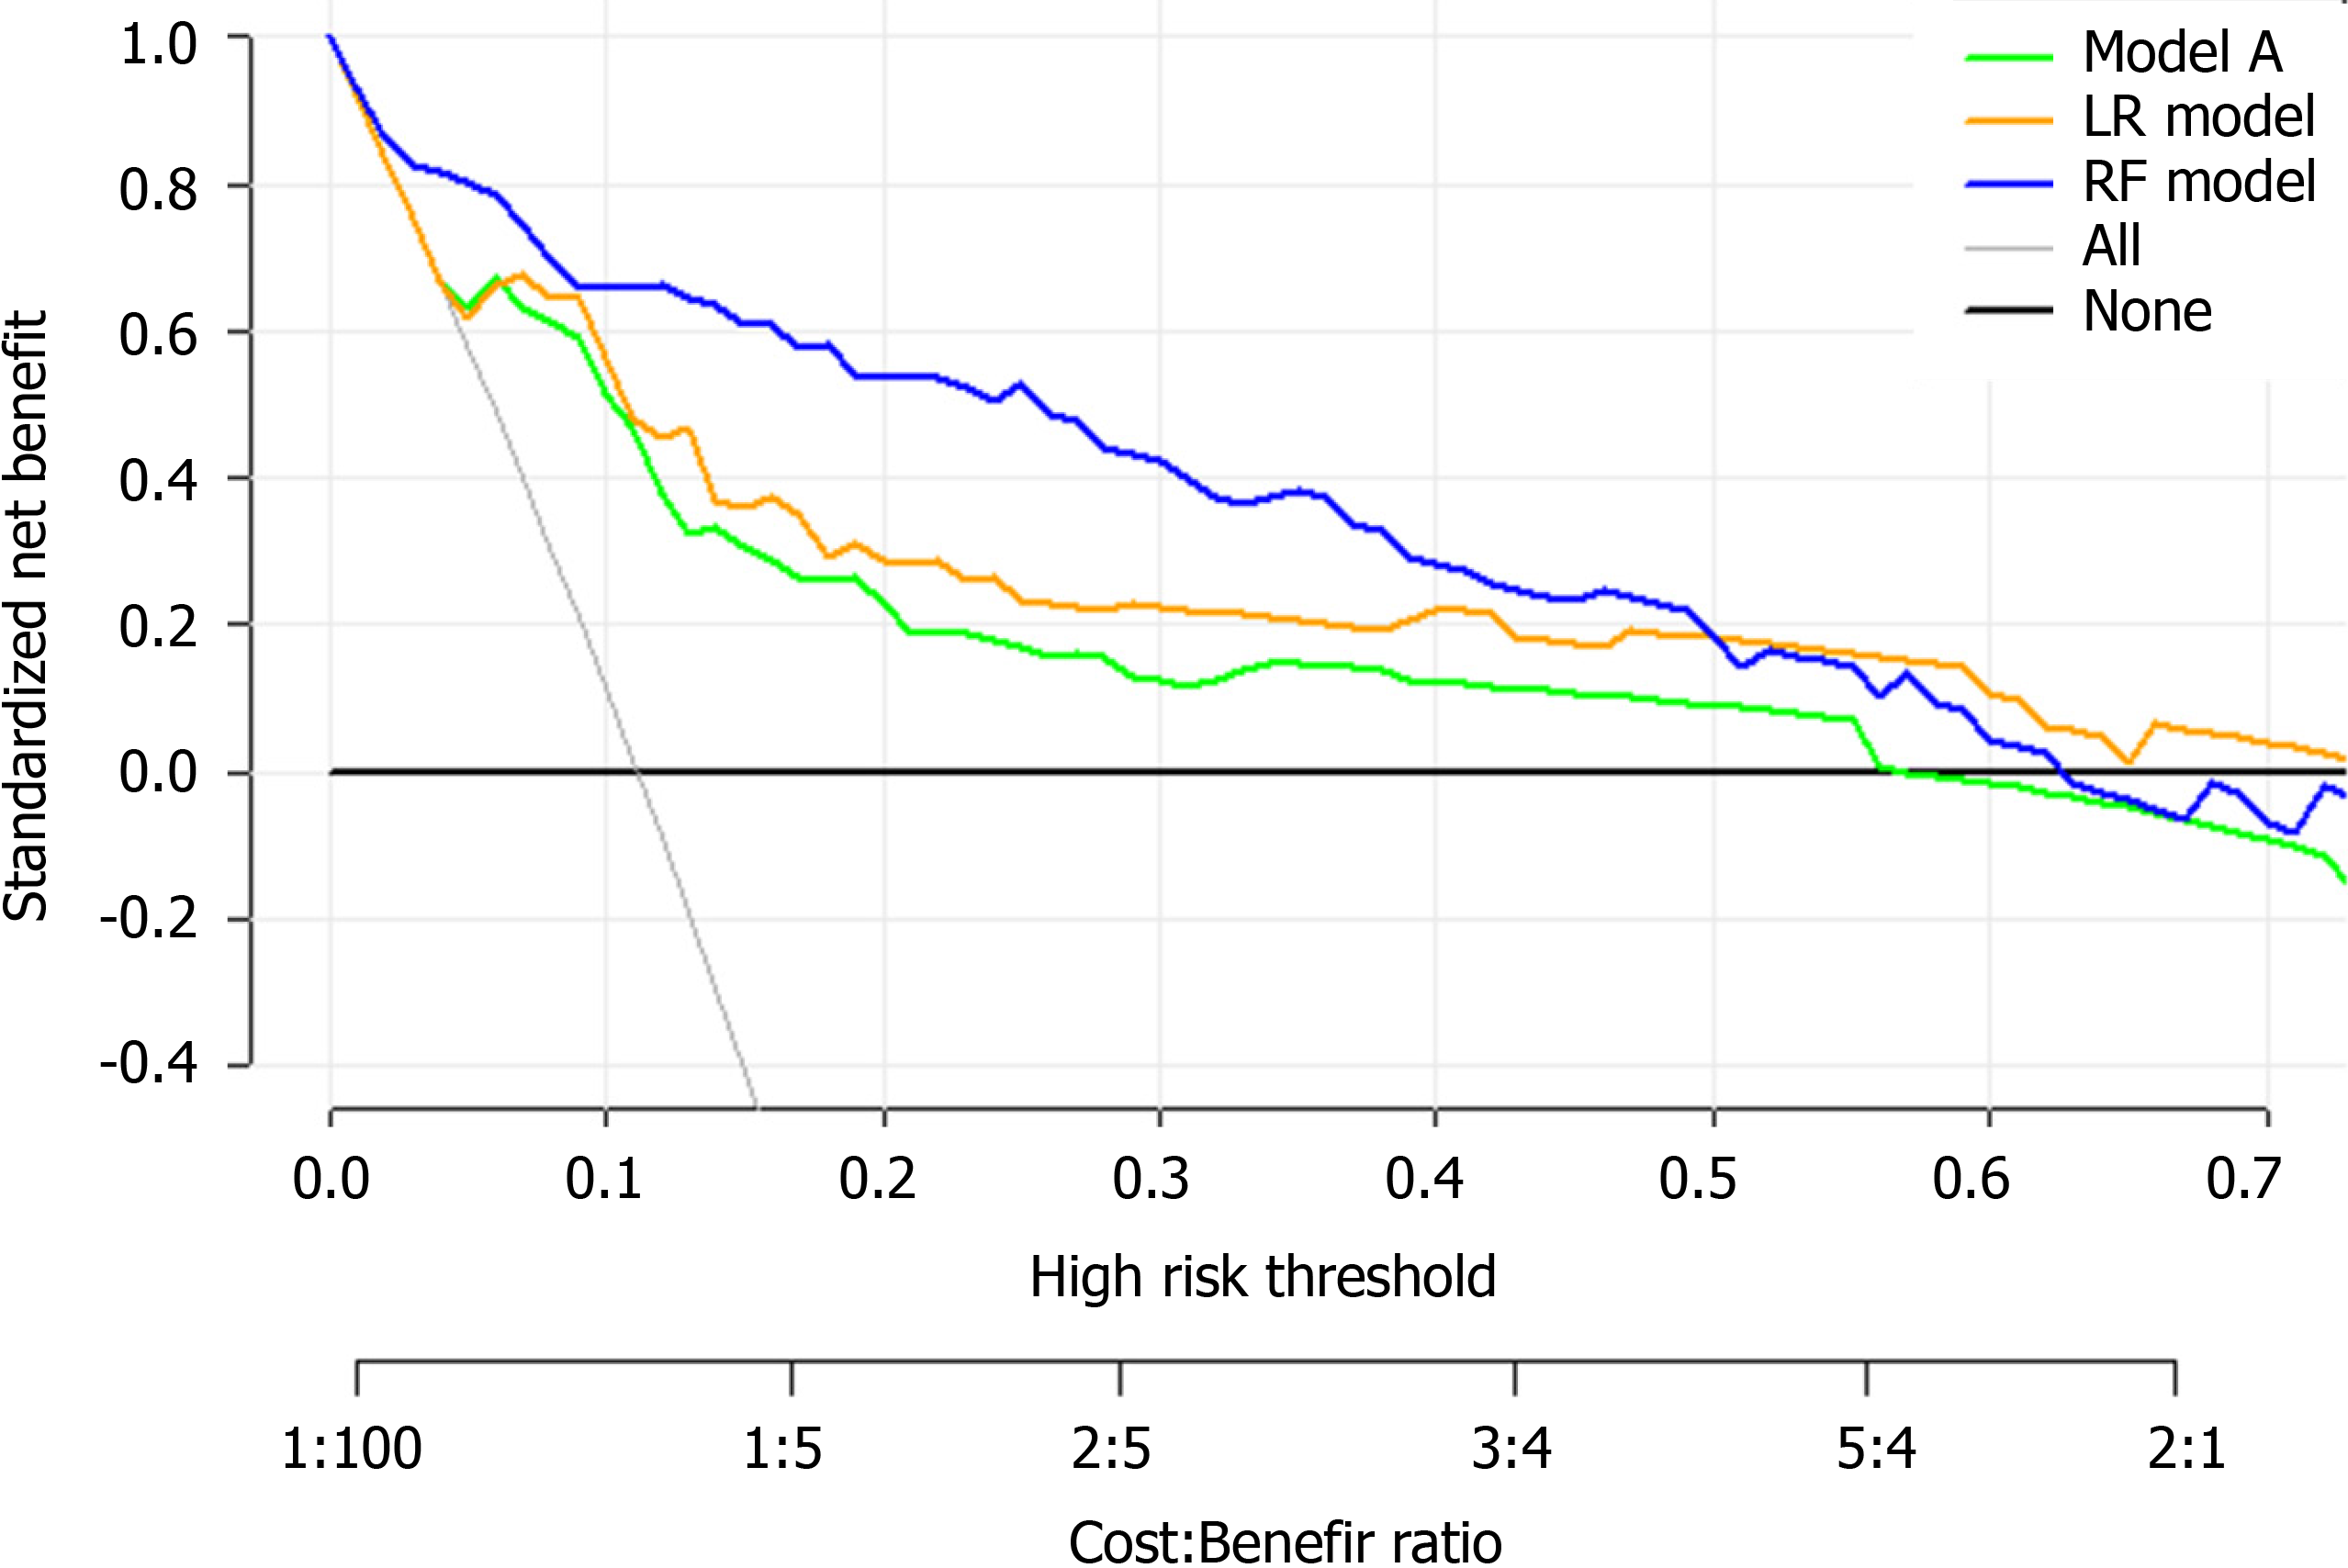
Figure 9 Decision curve analysis for the model A, logistic regression and random forest risk prediction models.
The vertical axis displays standardized net benefit. The two horizontal axes show the correspondence between high-risk threshold and cost: benefit ratio. The thin gray line is the standardized net benefit of allocating intensive care unit resources to all patients; the thick black line is the standardized net benefit of no intensive care unit admission. Decision curve analysis shows that our models had more significant standardized net benefits in the major threshold probabilities interval than model A, demonstrating that our models have better clinical benefit. LR: Logistic regression; RF: Random forest.
- Citation: Huang HF, Liu Y, Li JX, Dong H, Gao S, Huang ZY, Fu SZ, Yang LY, Lu HZ, Xia LY, Cao S, Gao Y, Yu XX. Validated tool for early prediction of intensive care unit admission in COVID-19 patients. World J Clin Cases 2021; 9(28): 8388-8403
- URL: https://www.wjgnet.com/2307-8960/full/v9/i28/8388.htm
- DOI: https://dx.doi.org/10.12998/wjcc.v9.i28.8388


