Copyright
©The Author(s) 2021.
World J Clin Cases. Apr 16, 2021; 9(11): 2584-2594
Published online Apr 16, 2021. doi: 10.12998/wjcc.v9.i11.2584
Published online Apr 16, 2021. doi: 10.12998/wjcc.v9.i11.2584
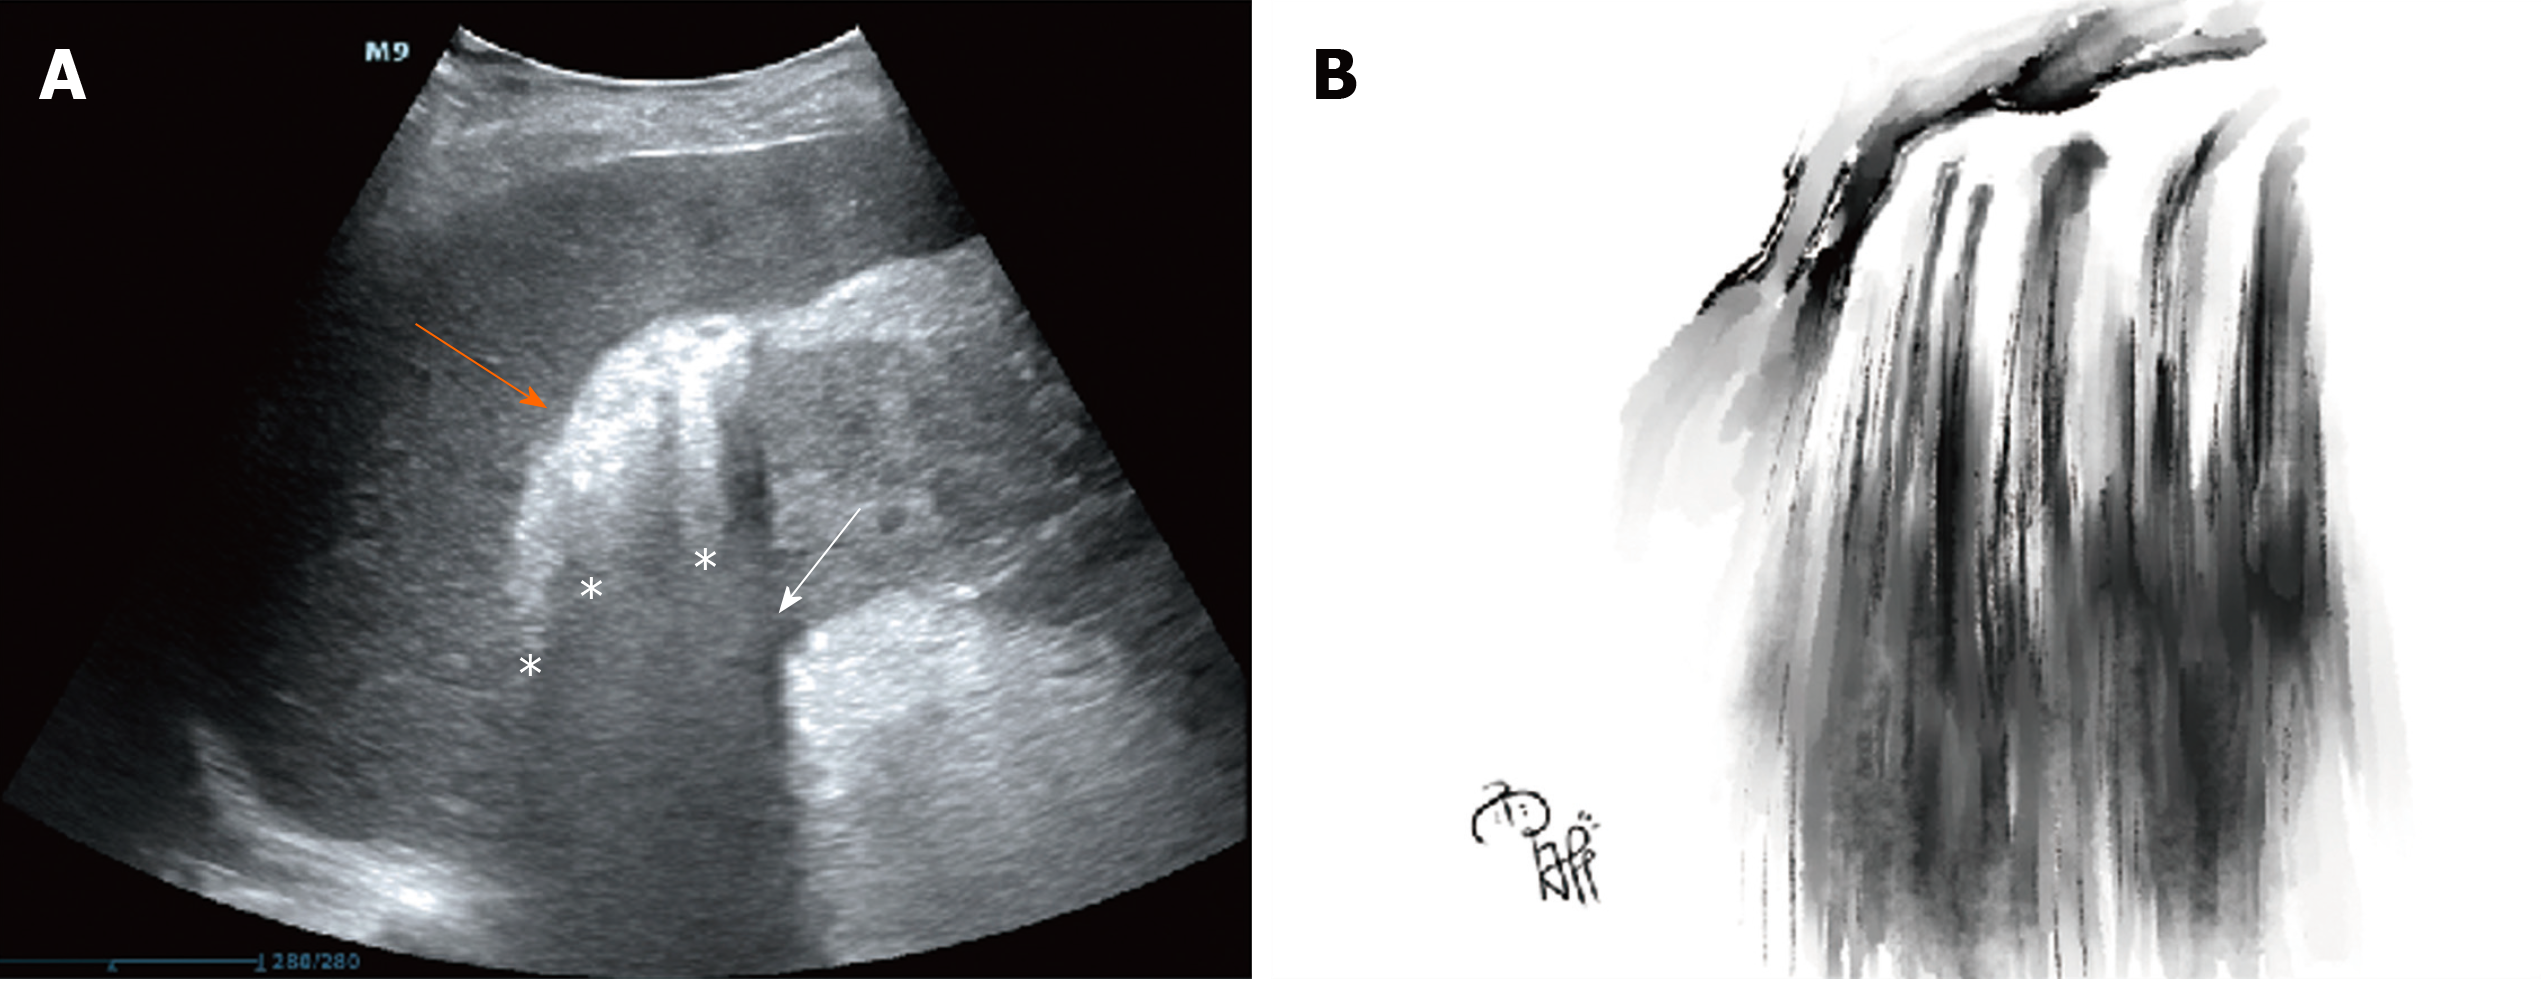
Figure 1 Point-of-care ultrasound of a “falls” sign and a sketch of this sign.
A: Image on day 3 after symptom onset showing hyperechoic spots or patches (orange oblique arrow) collecting in the right hepatorenal space with dirty shadowing (white oblique arrow) and comet-tail artifacts (white asterisks); B: Chinese landscape painting illustrating a mini waterfall by Yu-Xin Wang.
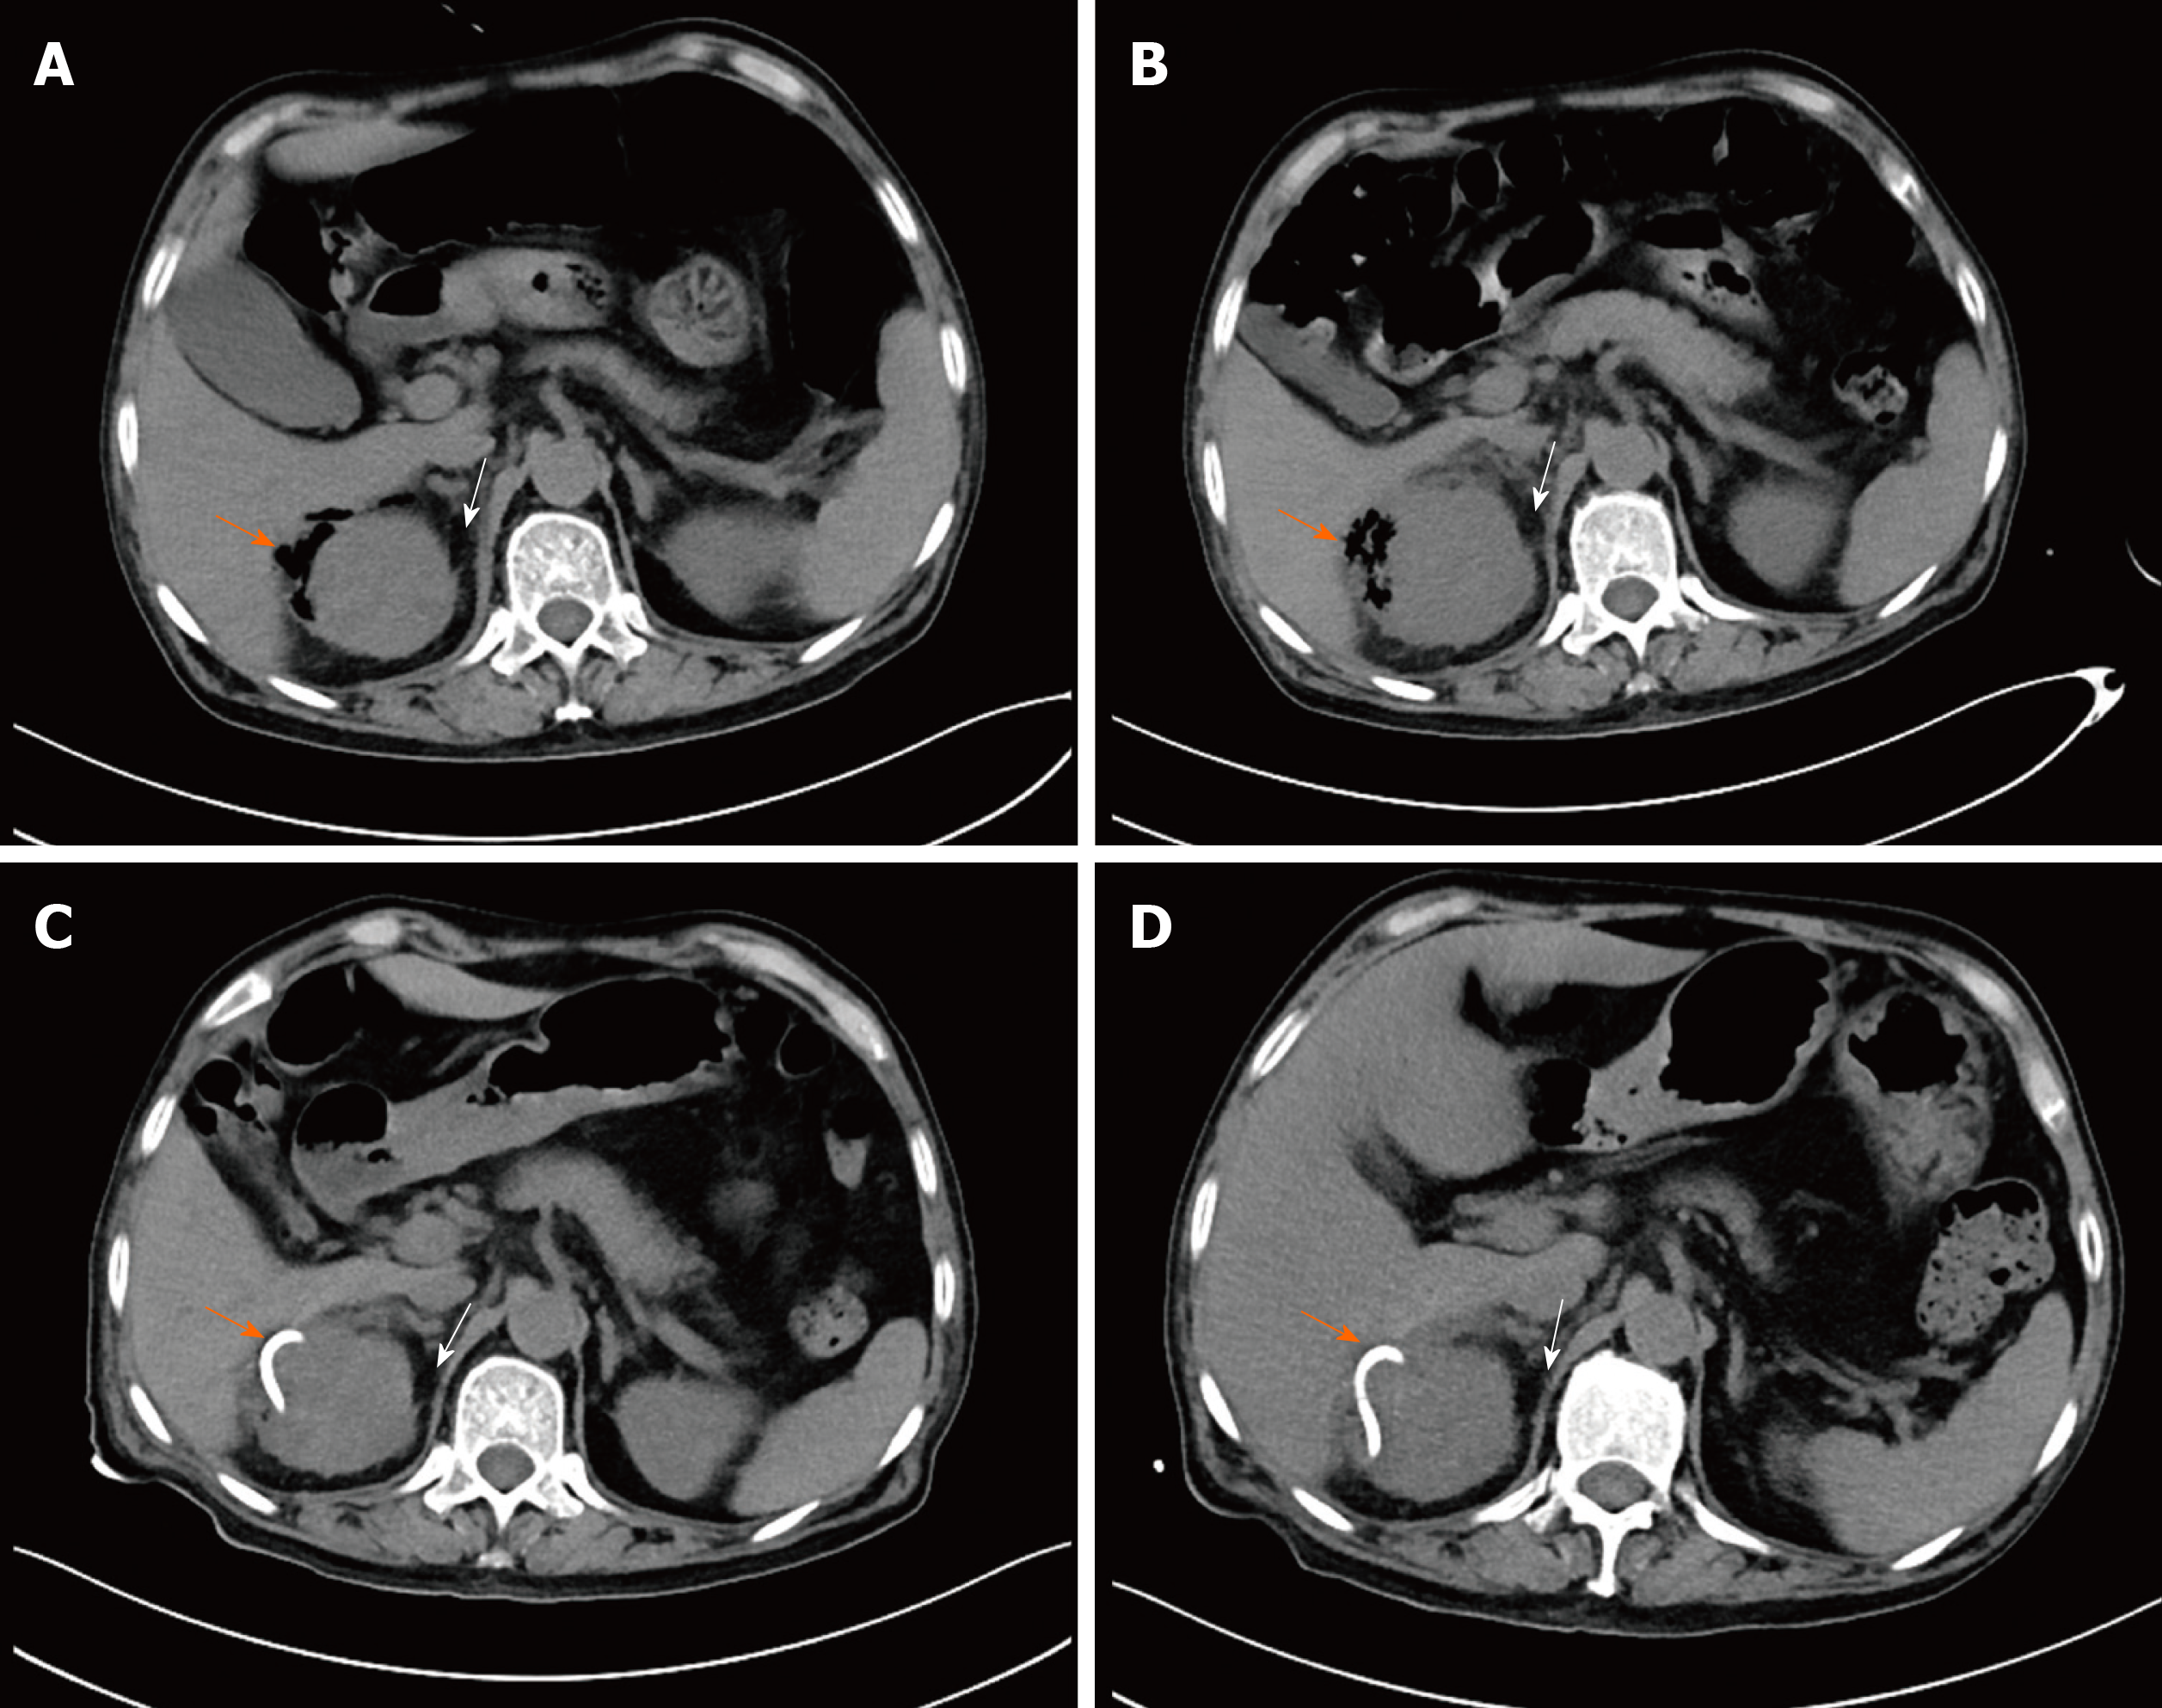
Figure 2 Comparison of computed tomography scans of the right kidney.
A: Image on day 3 after symptom onset showing gas bubbles (orange oblique arrow) in the right perirenal space and an enlarged kidney with perinephric fat stranding (PFS) (white oblique arrow); B: Image on day 7 after symptom onset showing gas bubbles plus an abscess in the right perirenal space (orange oblique arrow) and a more enlarged kidney with more PFS (white oblique arrow); C: Image on day 9 after symptom onset showing a pig-tail catheter (orange oblique arrow) in the right perirenal space and an enlarged kidney with PFS (white oblique arrow); D: Image on day 11 after symptom onset showing a pig-tail catheter (orange oblique arrow) in the right perirenal space and a normal-size kidney with clear perinephric fat (white oblique arrow).
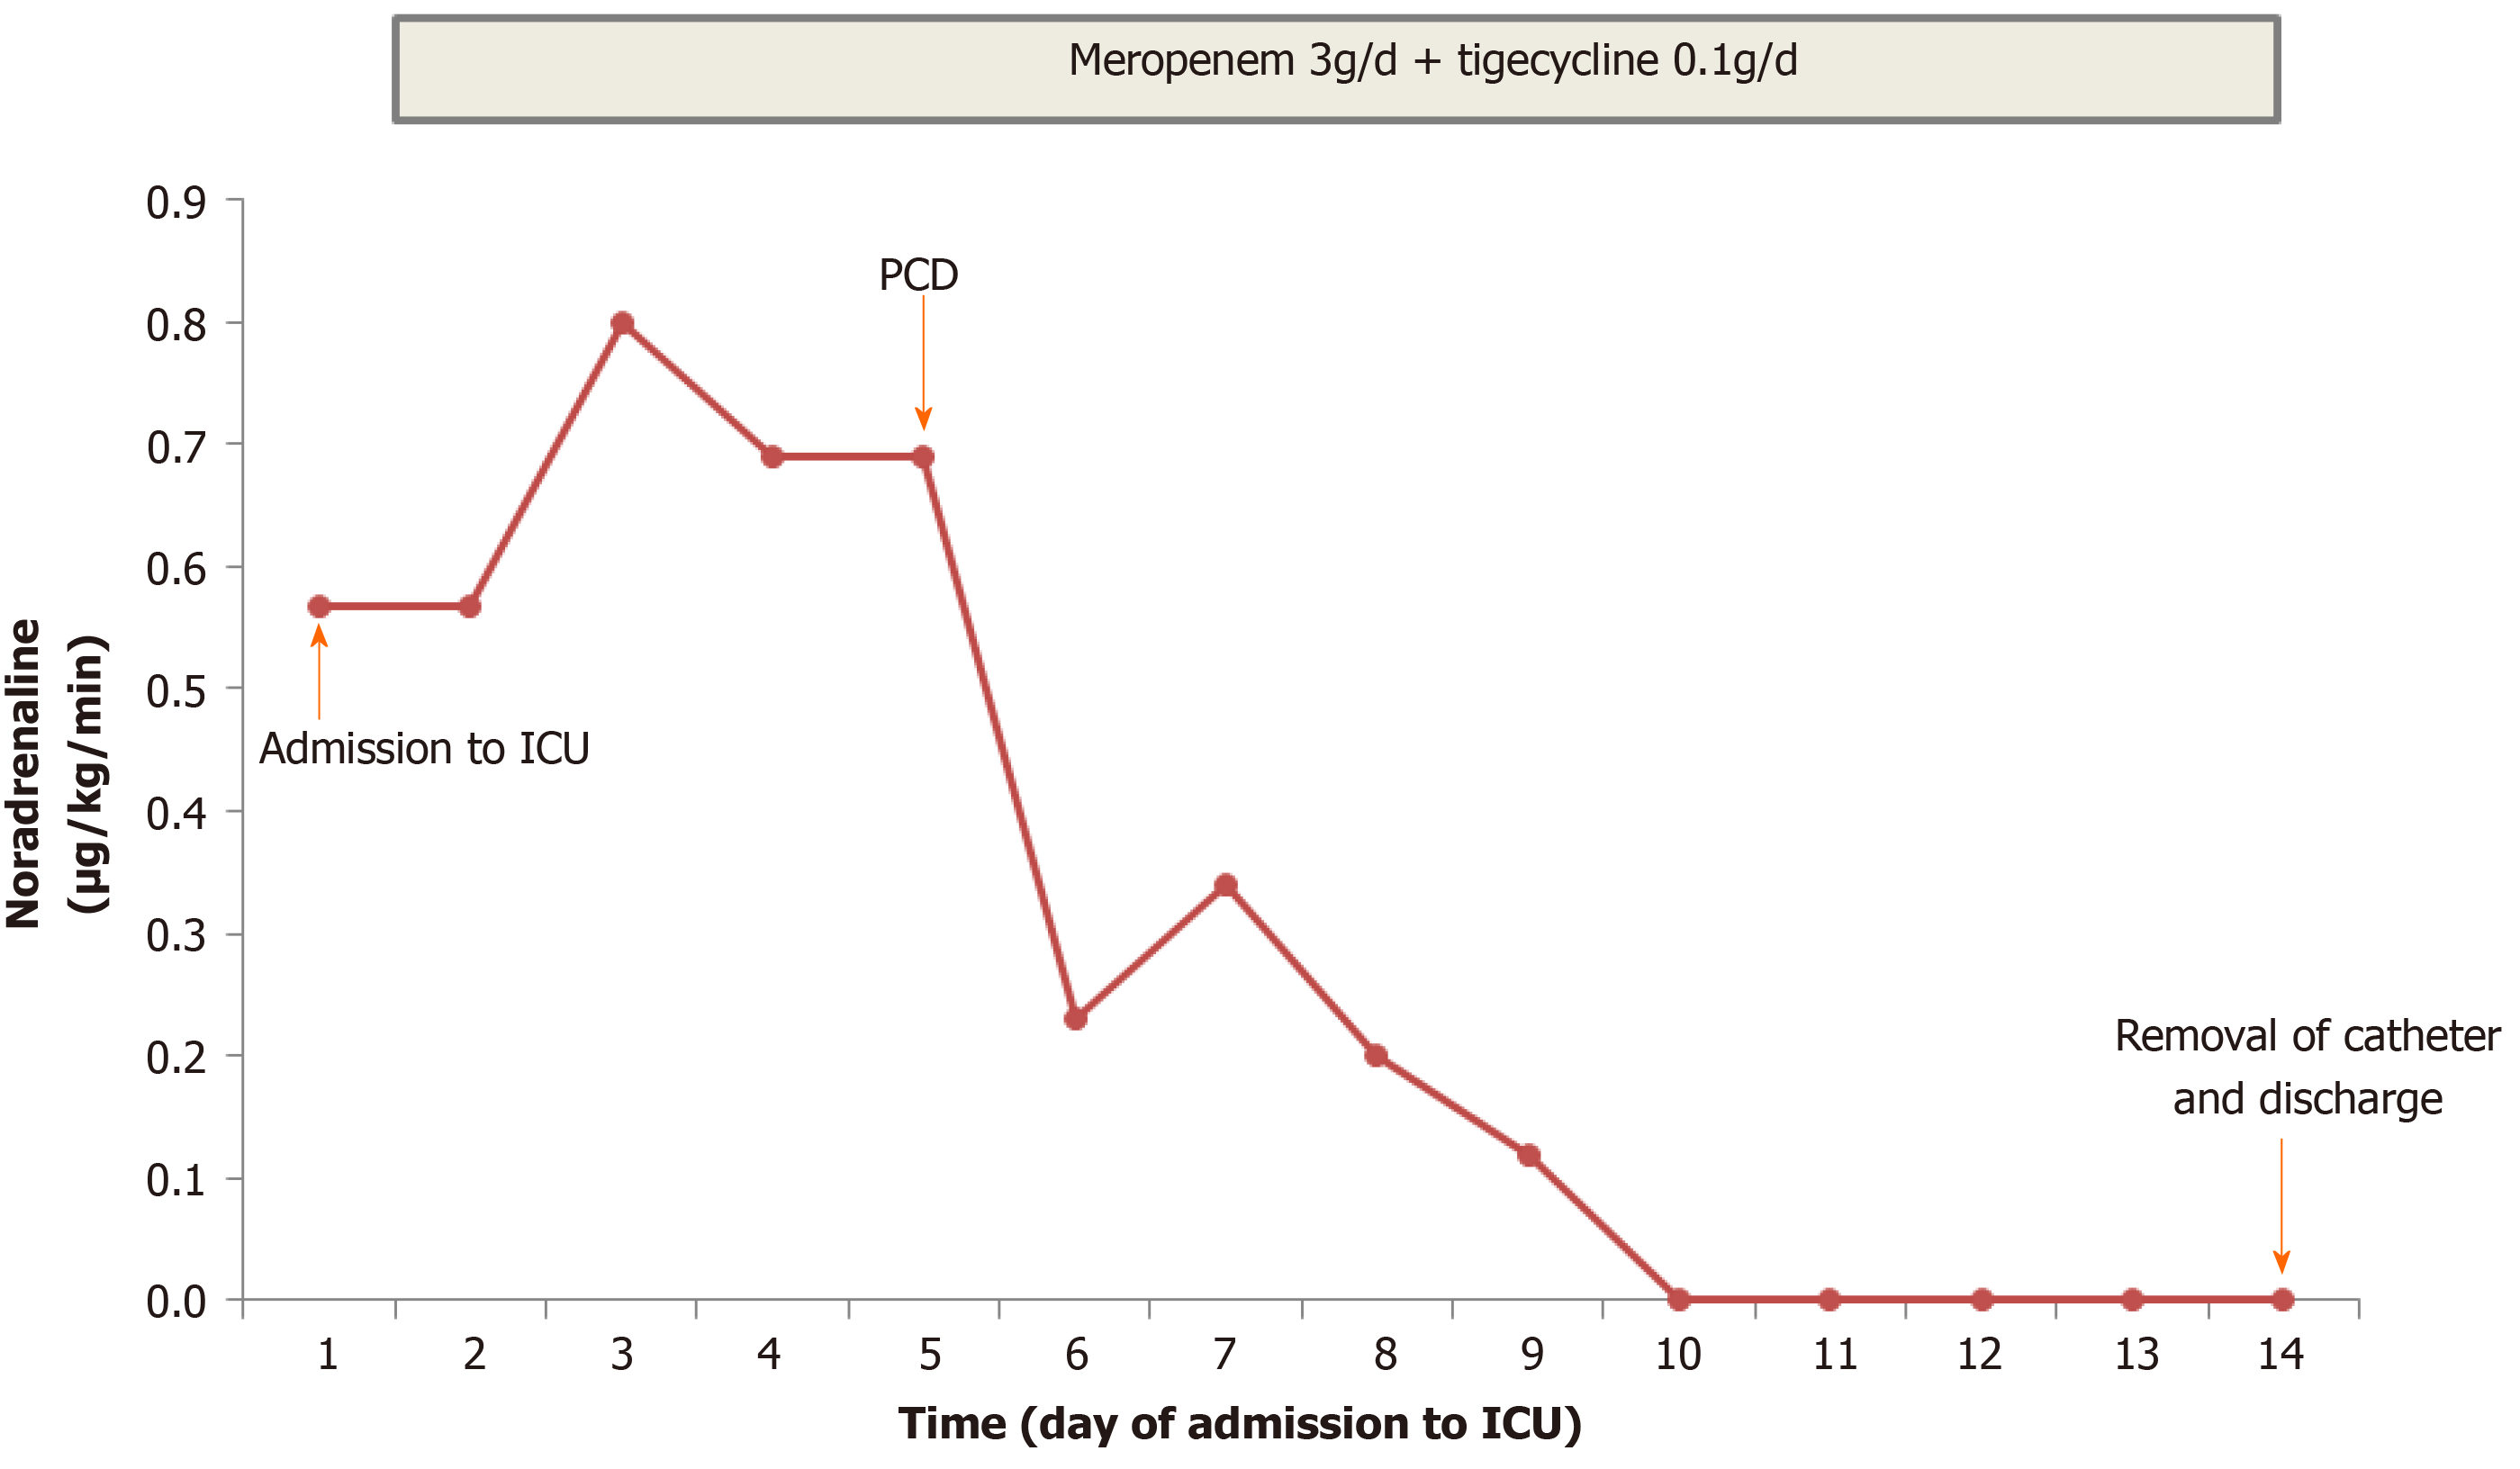
Figure 3 Clinical course and vasopressor doses.
Meropenem and tigecycline were prescribed on days 1-14. Percutaneous catheter drainage (PCD) was performed on day 5. The perinephric catheter was removed and the patient was discharged on day 14. ICU: Intensive care unit.
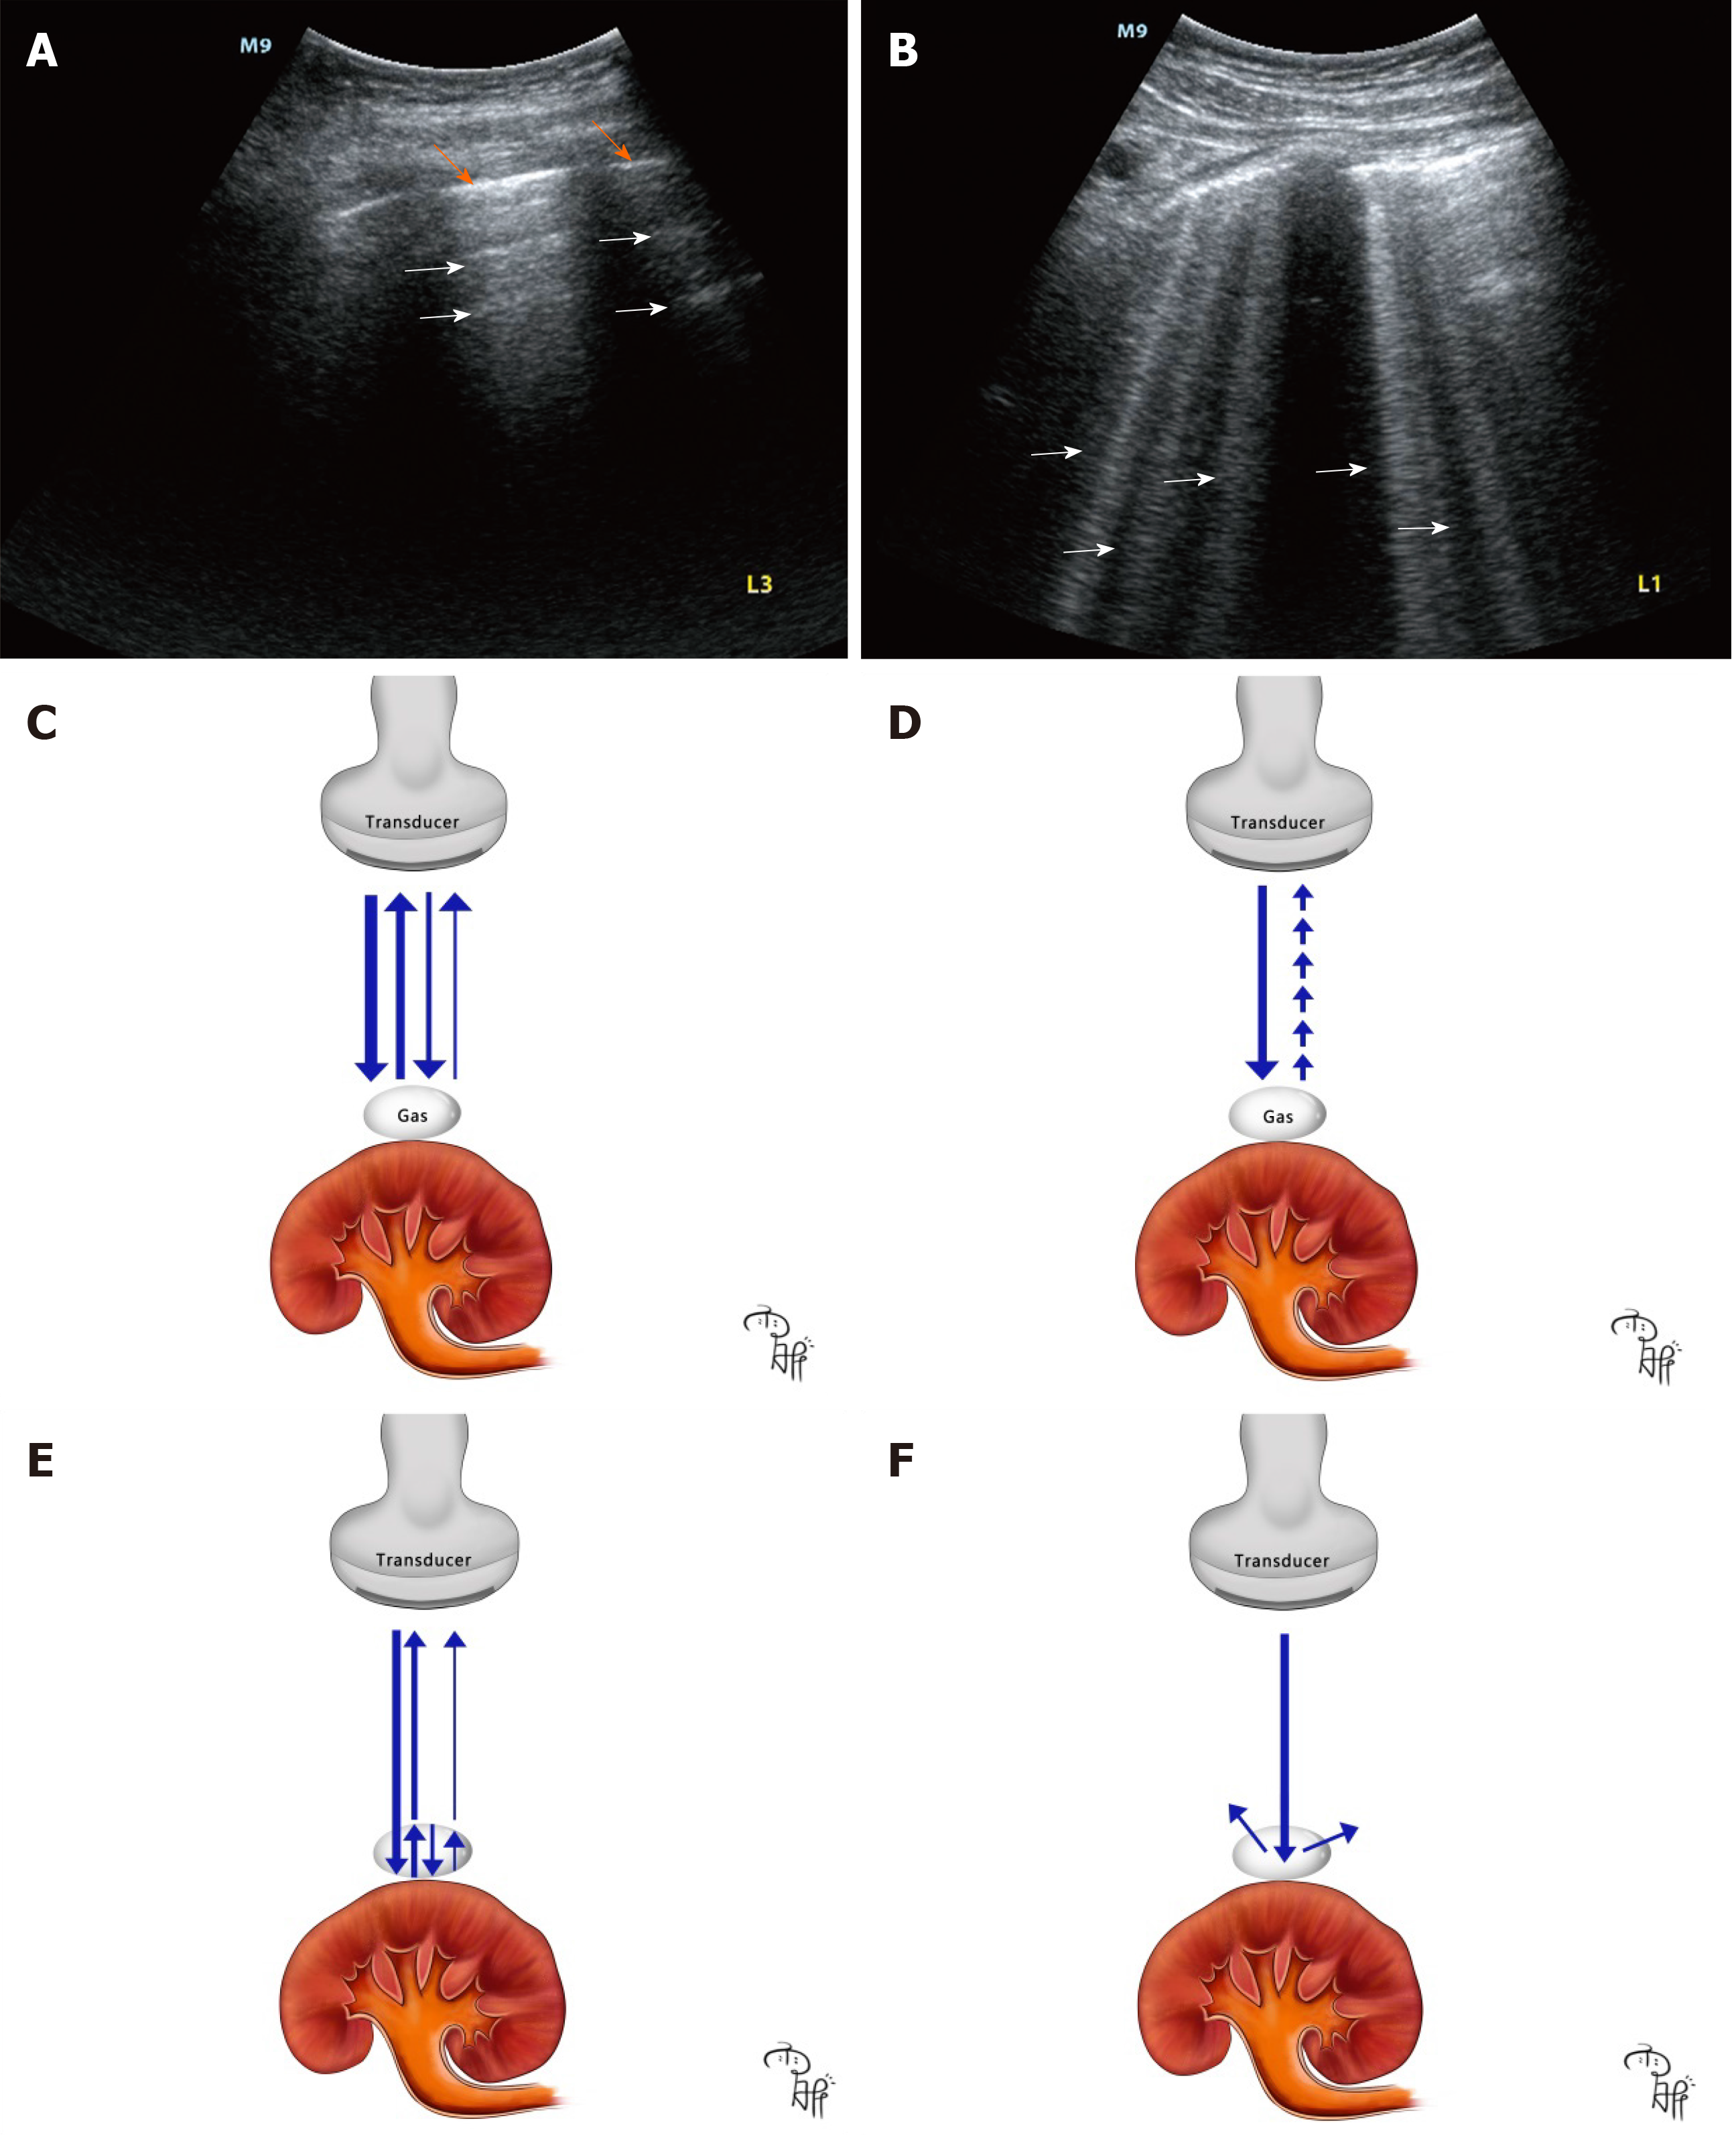
Figure 4 A-lines and B-lines in pulmonary ultrasound in our clinical practice and cartoon illustrating how different air-related artifacts in emphysematous pyelonephritis are produced.
A: Point-of-care ultrasound (POCUS) of a healthy lung showing gradually diminished A-lines (the white arrows) and pleura lines (the orange arrows), and the equidistance between the lines; B: POCUS of lung edema showing B-lines (the white arrows); C: Cartoon showing how A-lines are produced. The ultrasound beams (the blue arrows) are repetitively reflecting between gas and the transducer with strength degradation; D: Cartoon showing how B-lines are produced. The ultrasound beam (the blue arrow) provokes resonance in the gas-fluid interface, emitting continuous waves back to the transducer (the small blue arrows); E: Cartoon showing how comet-tail artifacts are produced. The ultrasound beam is repetitively reflecting between the shallow and deep sides (the blue arrows) of gas bubbles with gradually diminished ultrasound beams returning to the transducer; F: Cartoon showing how dirty shadowing is produced. The ultrasound beam is reflecting in multiple directions (the blue arrows) deep into the gas.
- Citation: Xing ZX, Yang H, Zhang W, Wang Y, Wang CS, Chen T, Chen HJ. Point-of-care ultrasound for the early diagnosis of emphysematous pyelonephritis: A case report and literature review . World J Clin Cases 2021; 9(11): 2584-2594
- URL: https://www.wjgnet.com/2307-8960/full/v9/i11/2584.htm
- DOI: https://dx.doi.org/10.12998/wjcc.v9.i11.2584


