Copyright
©The Author(s) 2020.
World J Clin Cases. Nov 26, 2020; 8(22): 5722-5728
Published online Nov 26, 2020. doi: 10.12998/wjcc.v8.i22.5722
Published online Nov 26, 2020. doi: 10.12998/wjcc.v8.i22.5722
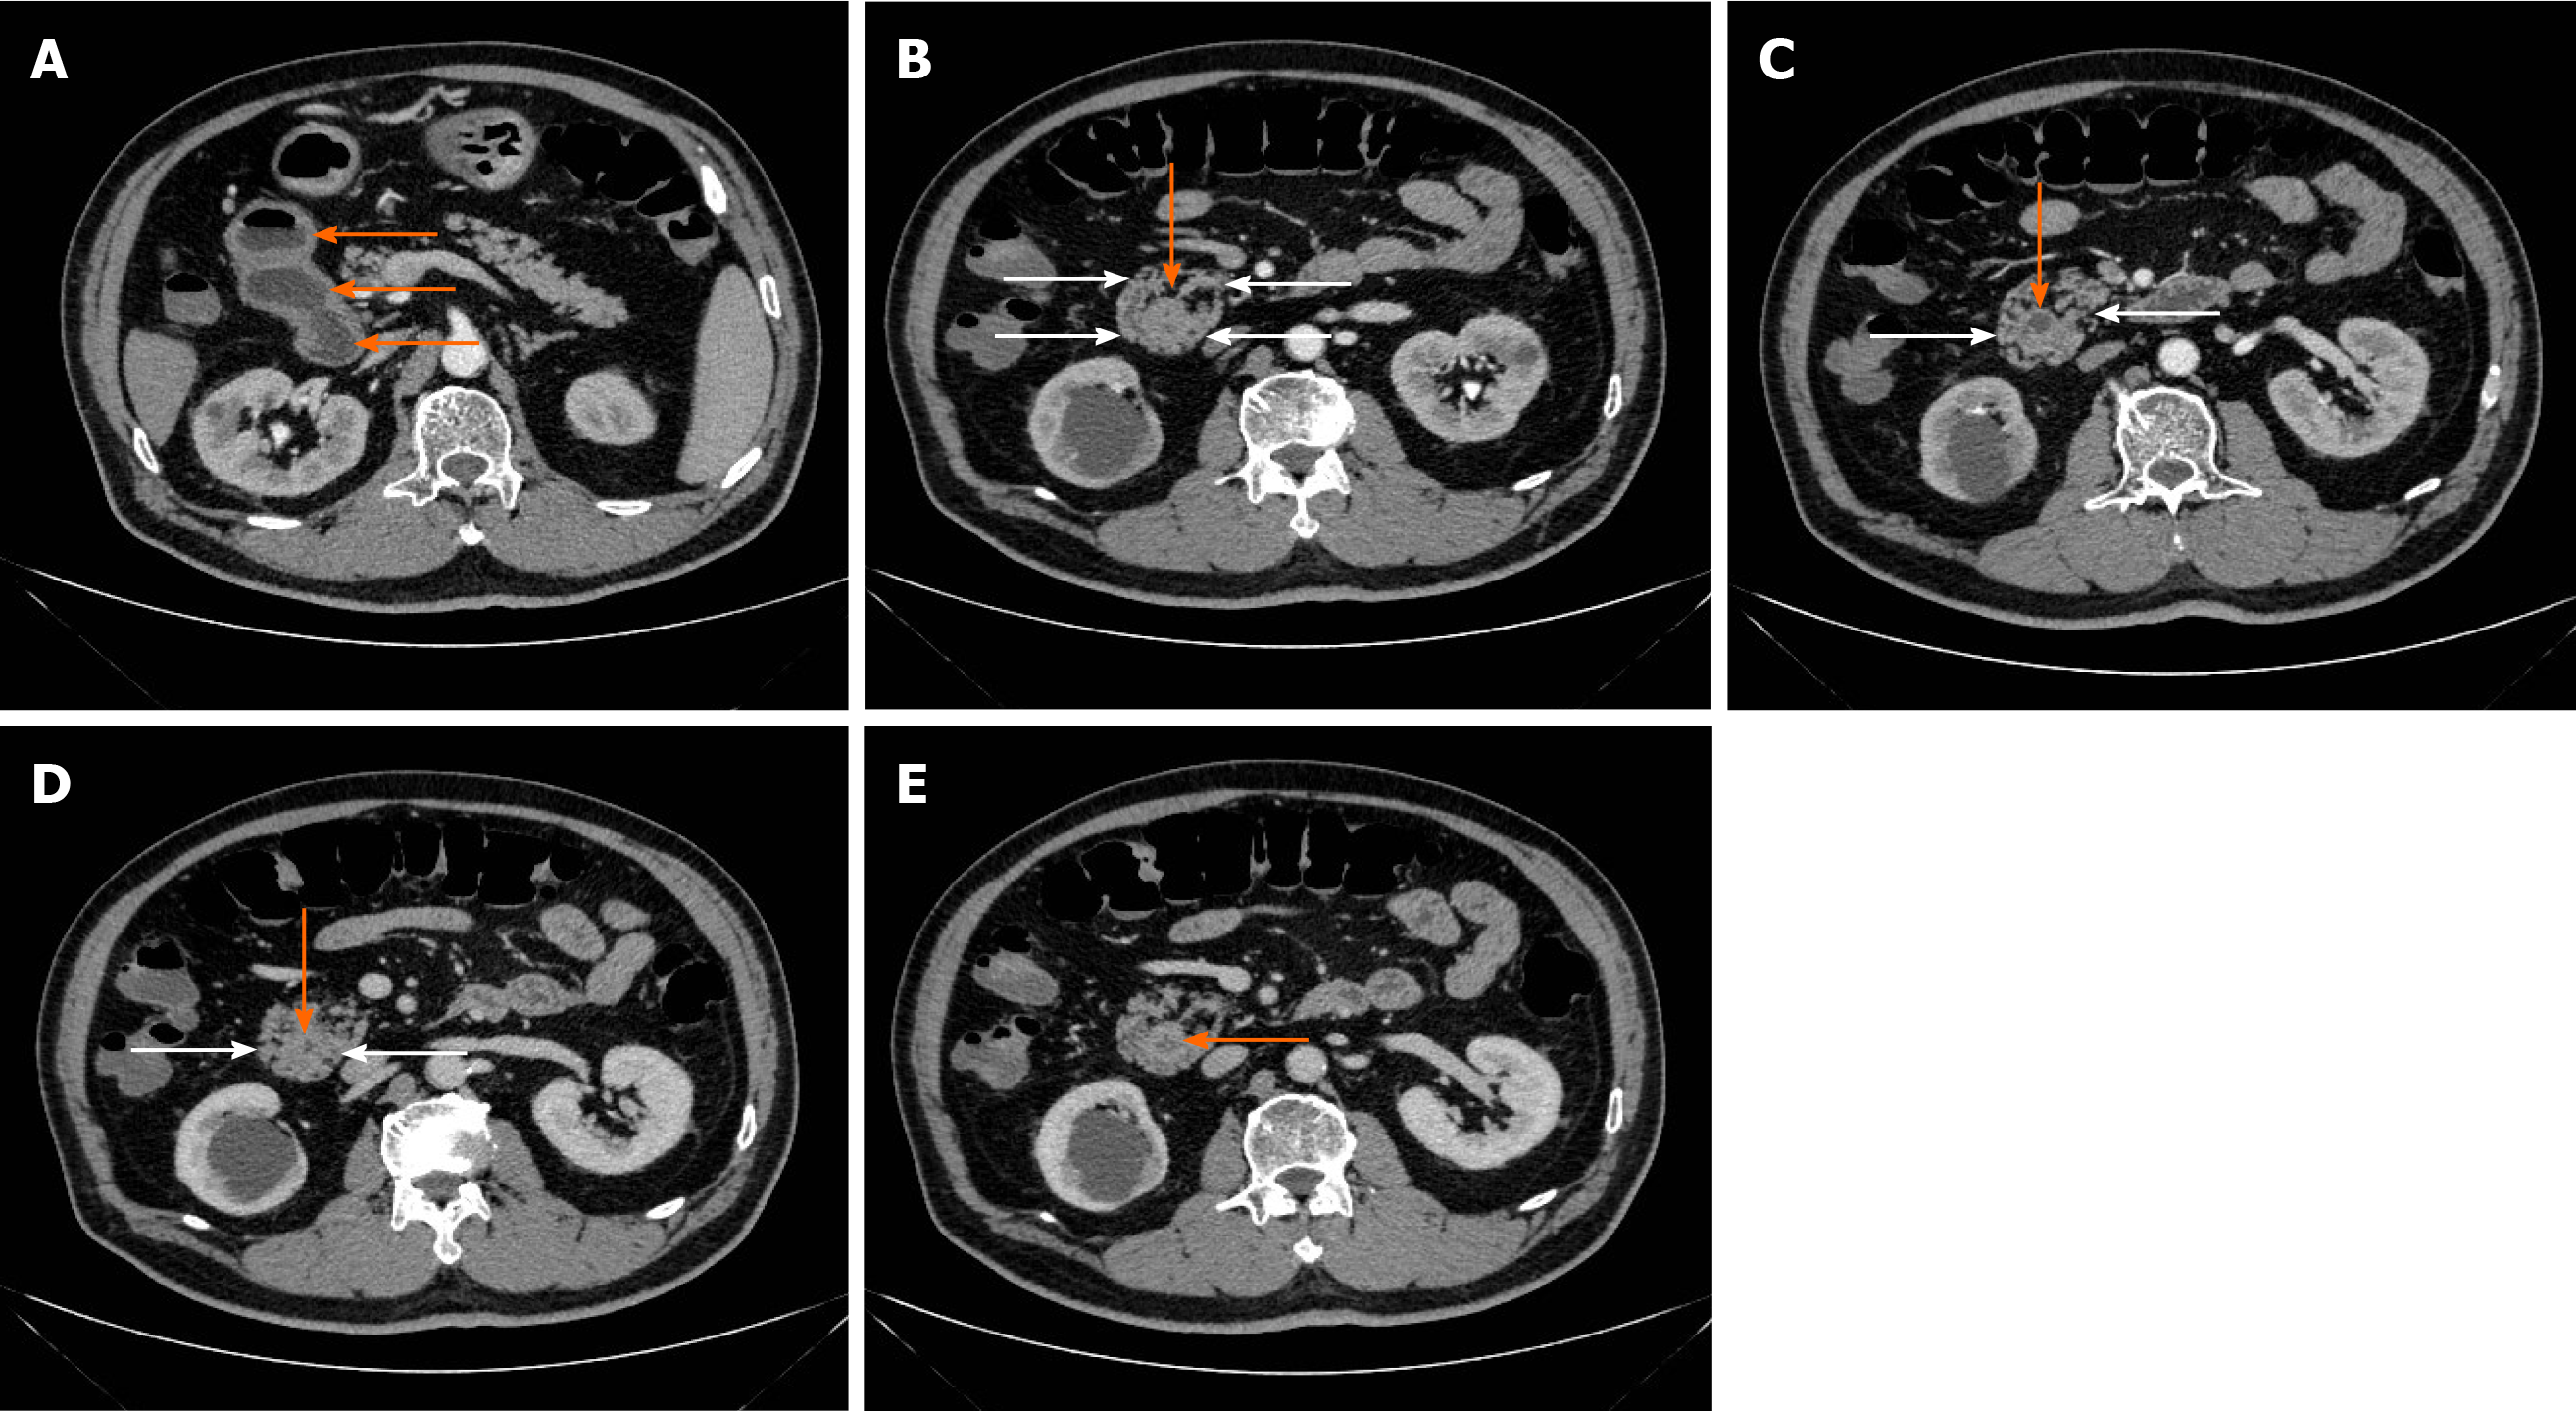
Figure 1 Computed tomography images of the duodenum in annular pancreas patients.
A: Orange arrows show dilated duodenum; B-D: White arrows show annular pancreas, and orange arrows show narrowed duodenum; E: Orange arrow shows that the duodenal wall is thick, suggesting a tumor.
Figure 2 Double bubble sign in computed tomography images.
A: Orange arrows show dilatation of the duodenum, stomach, and common bile duct; B-E: Orange arrows show annular pancreas; F: Orange arrow shows annular pancreas, and white arrow shows narrowed duodenum.
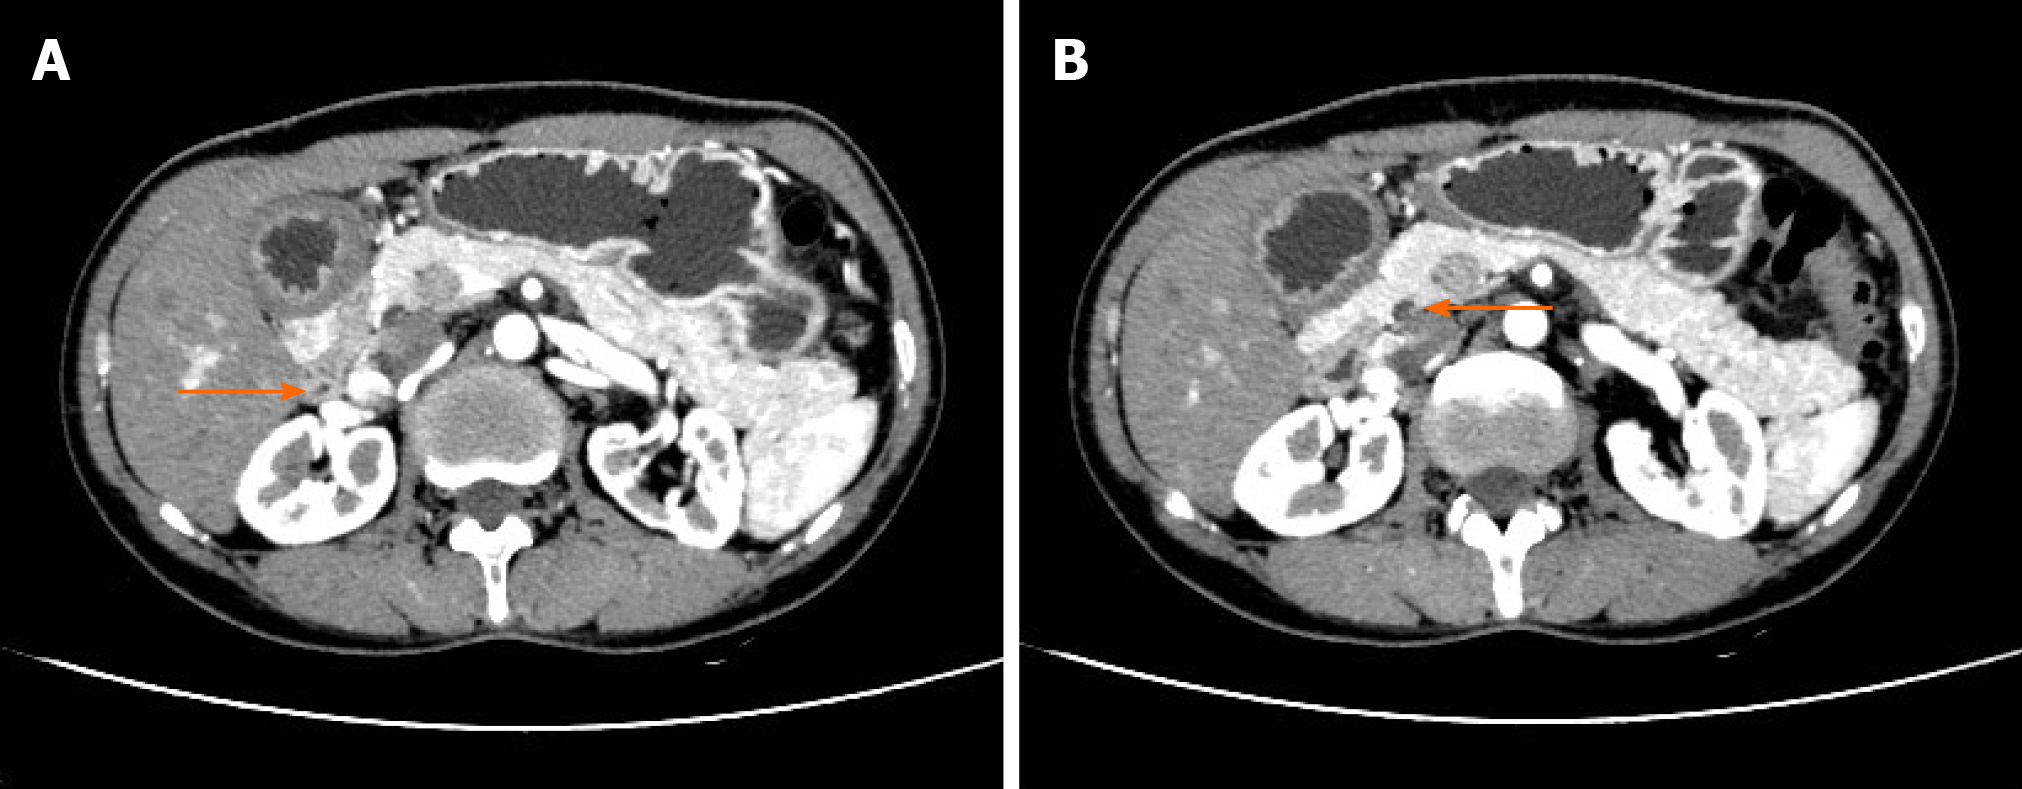
Figure 3 Incomplete annular pancreas.
A: Orange arrow shows narrowed duodenum; B: Orange arrow shows annular pancreas.
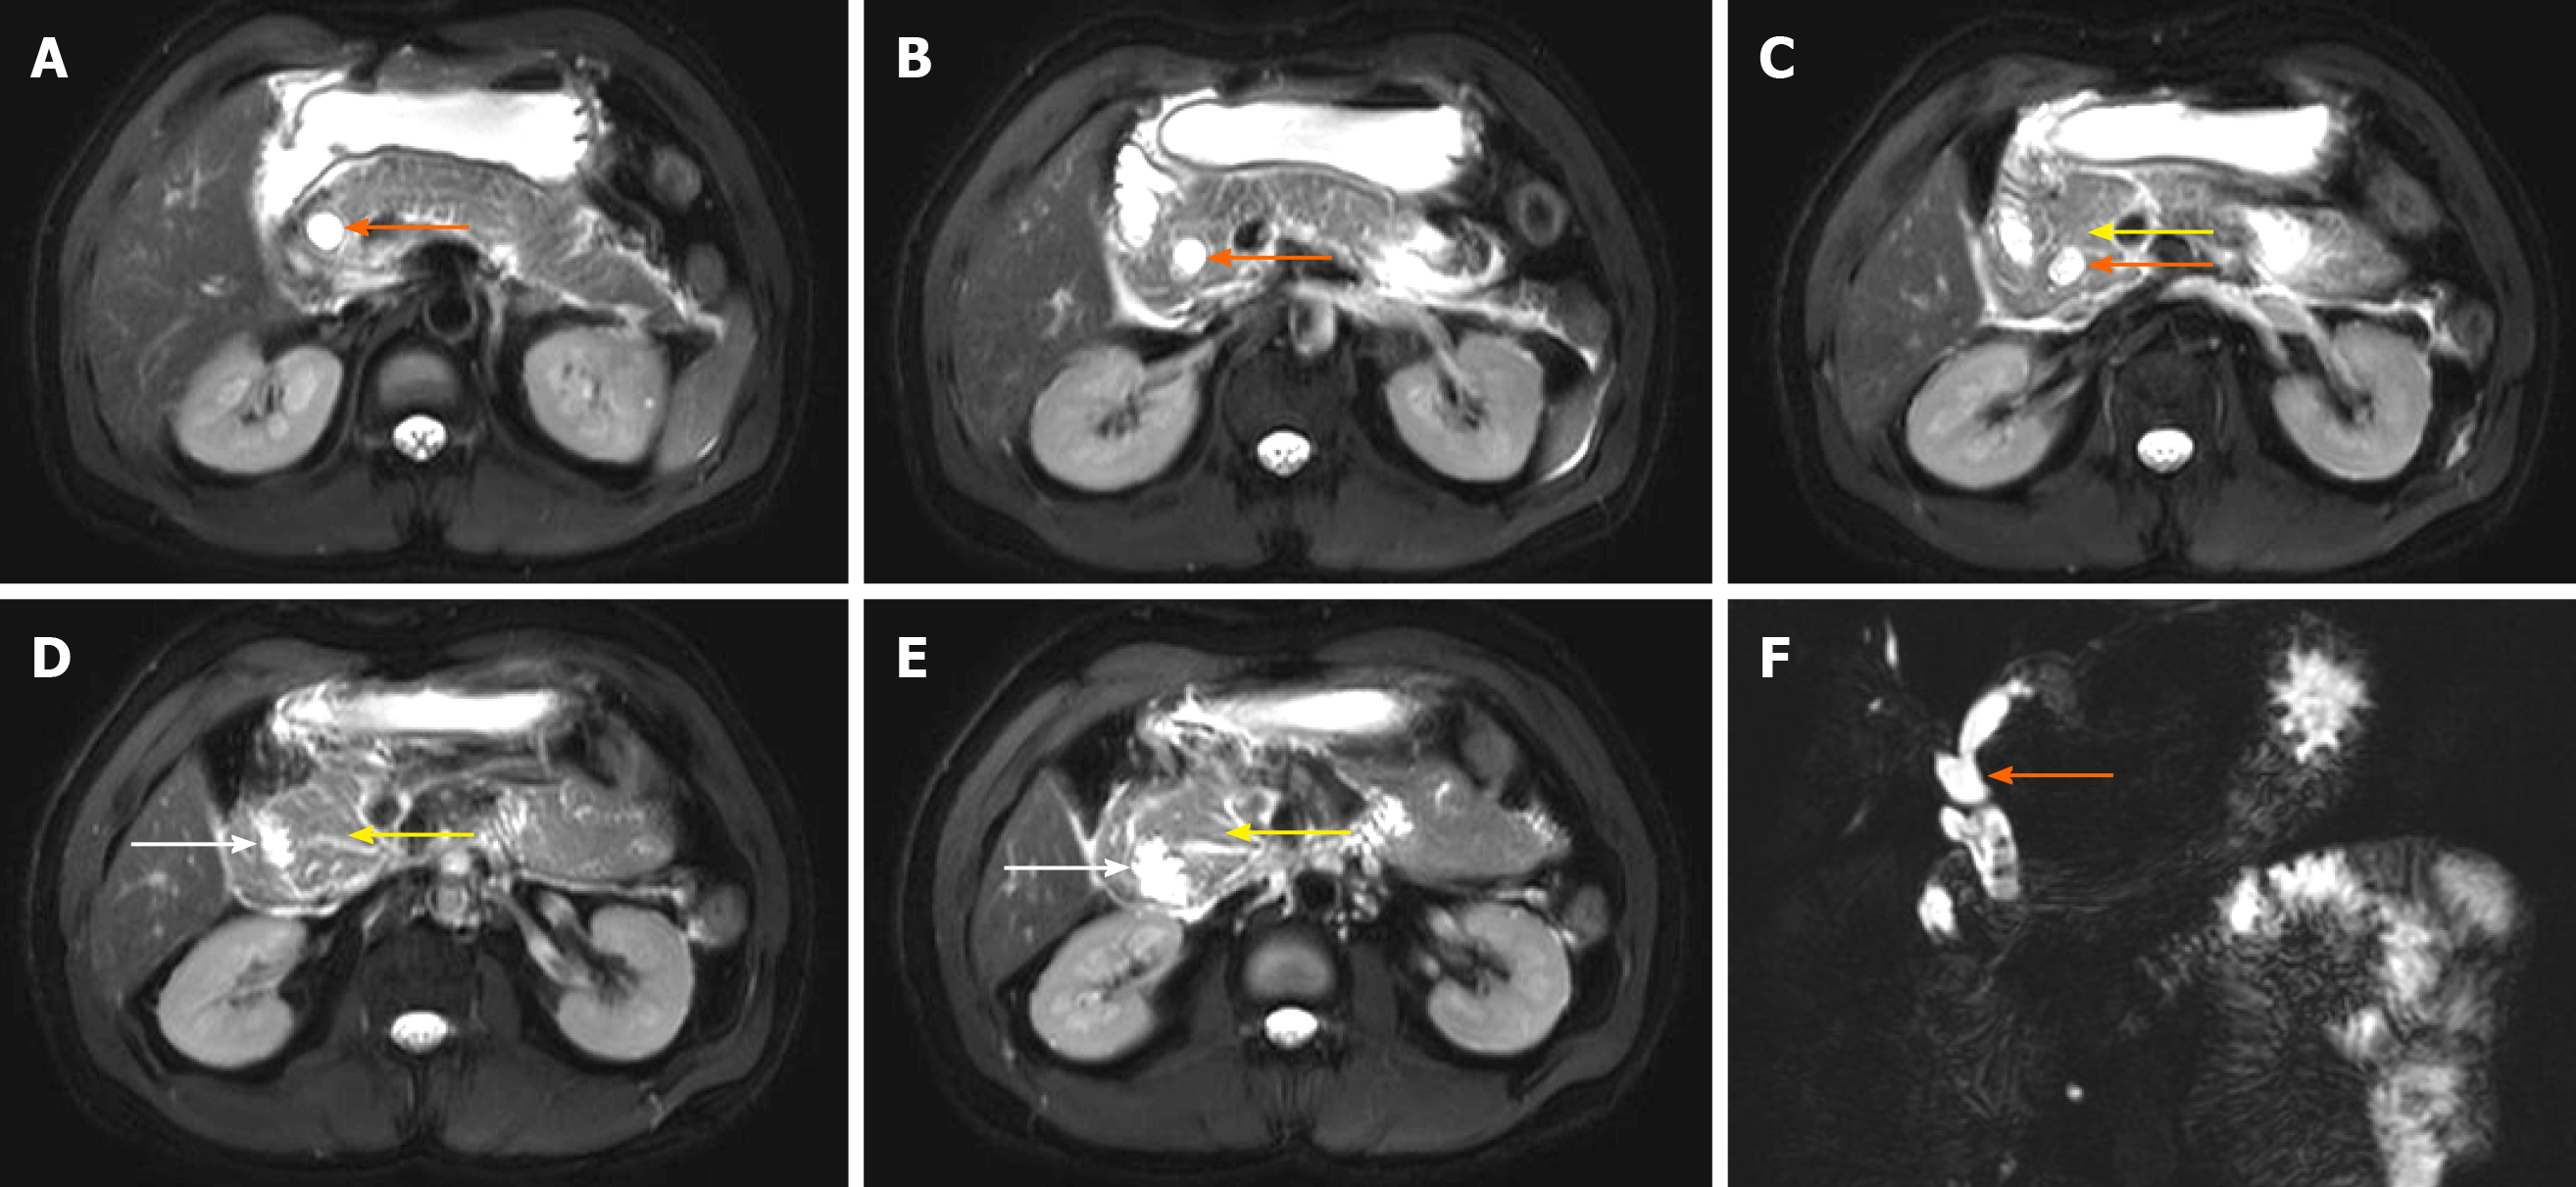
Figure 4 Annular pancreas gradually wraps around the duodenum.
A-C: Orange arrows show dilatation of the common bile duct; D and E: White arrows shows narrowed duodenum; F: Orange arrows show dilatation of the common bile duct; C-E: Yellow arrows show annular pancreas.
Figure 5 Stenosis of the end of the common bile duct.
A: Orange arrow shows choledochal strictured end; B and C: Orange arrows show the incomplete annular pancreas.
- Citation: Yi D, Ding XB, Dong SS, Shao C, Zhao LJ. Clinical characteristics of adult-type annular pancreas: A case report . World J Clin Cases 2020; 8(22): 5722-5728
- URL: https://www.wjgnet.com/2307-8960/full/v8/i22/5722.htm
- DOI: https://dx.doi.org/10.12998/wjcc.v8.i22.5722


