Copyright
©The Author(s) 2020.
World J Clin Cases. Nov 26, 2020; 8(22): 5707-5714
Published online Nov 26, 2020. doi: 10.12998/wjcc.v8.i22.5707
Published online Nov 26, 2020. doi: 10.12998/wjcc.v8.i22.5707
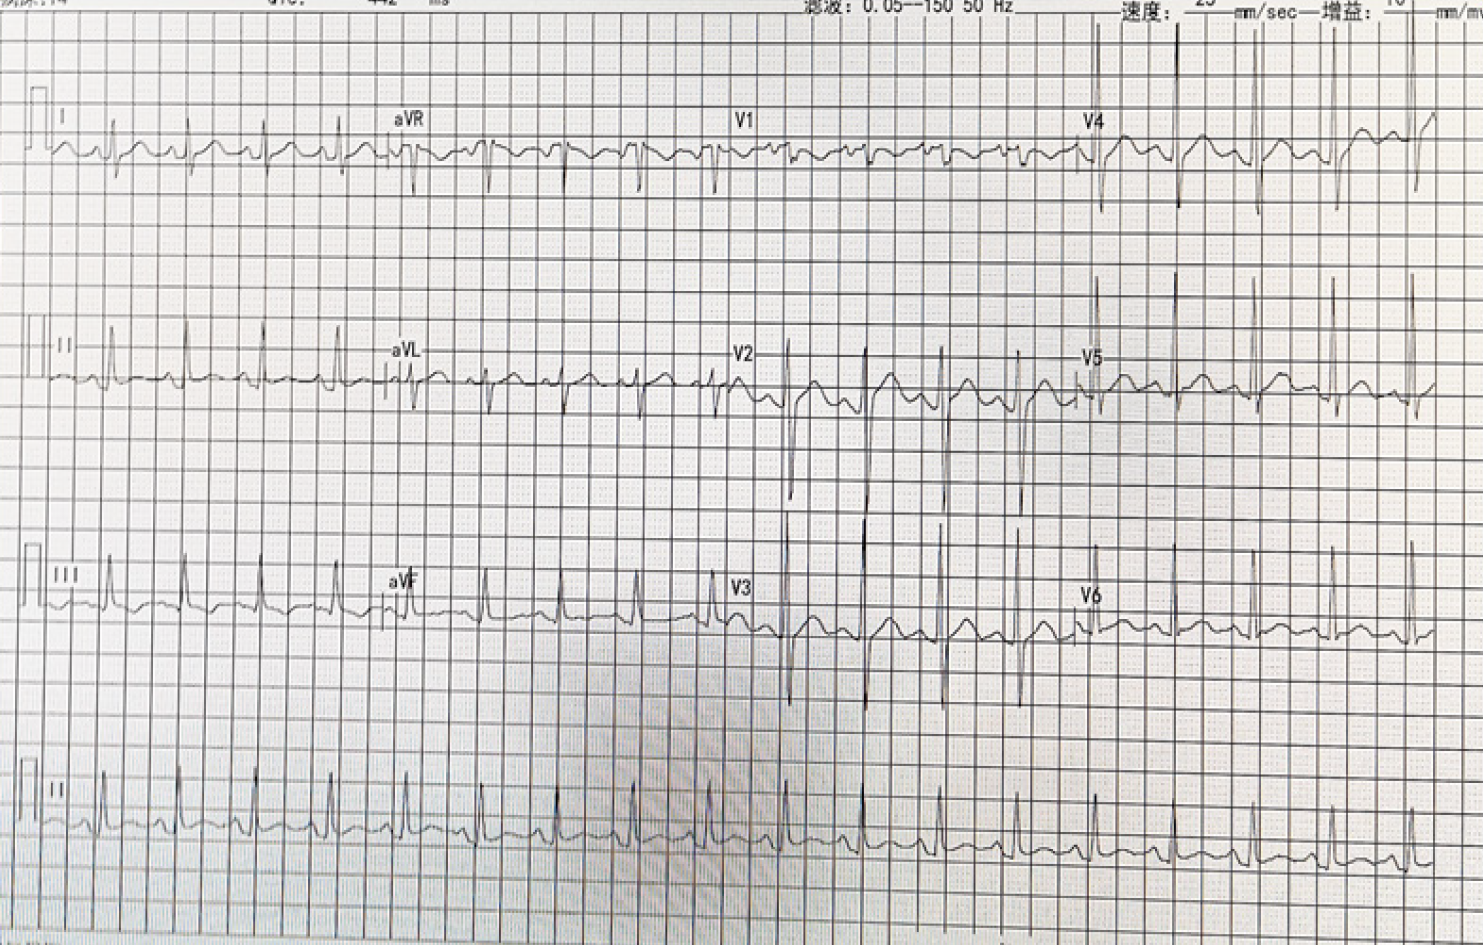
Figure 1 Electrocardiogram demonstrated sinus tachycardia.
The heart rate was 125 beats/min.
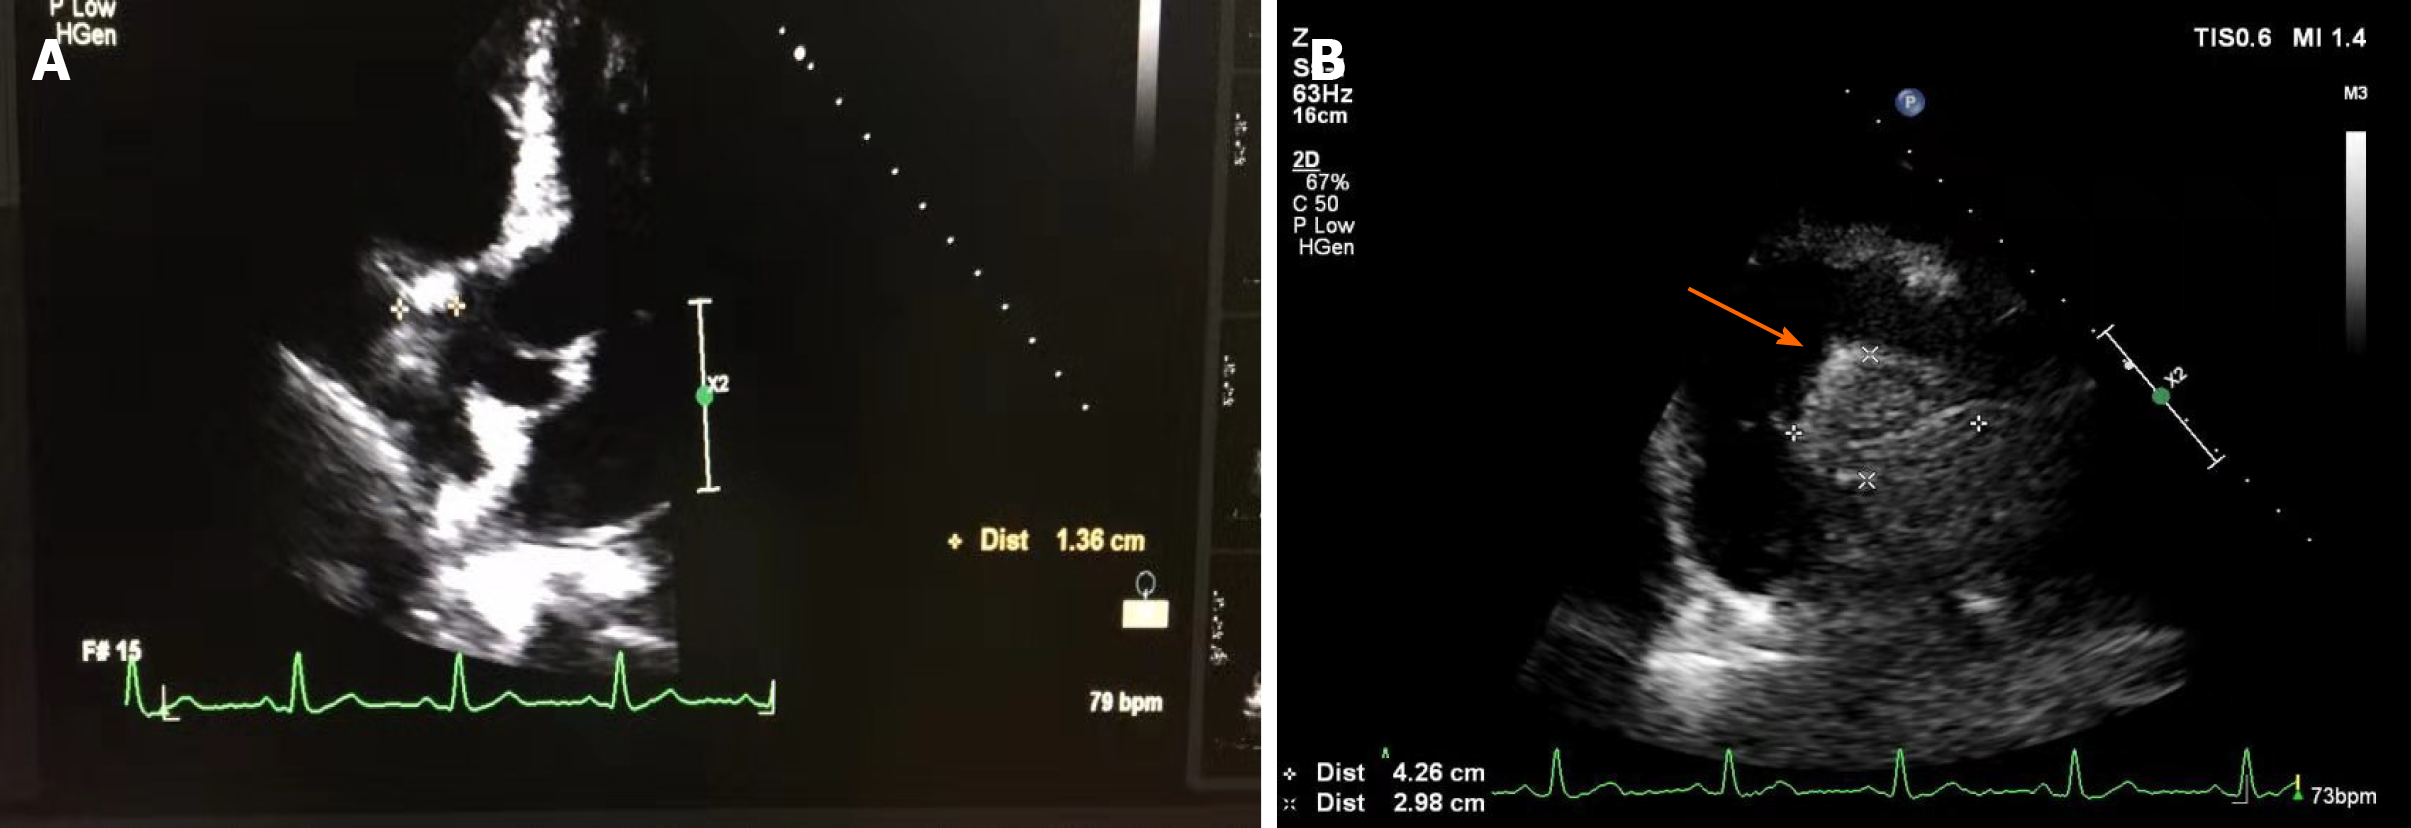
Figure 2 Echocardiography.
A and B: Echocardiography revealed a 4.26 cm × 2.98 cm intracardiac mass in the right atrioventricular groove, which was wrapped around the proximal segment of the right coronary artery (arrow).
Figure 3 Coronary angiography.
Coronary angiography demonstrated that there were abundant blood vessels from the proximal segment of the right coronary artery that wrapped around and supplied the intracardiac mass in the right atrioventricular groove (arrow).
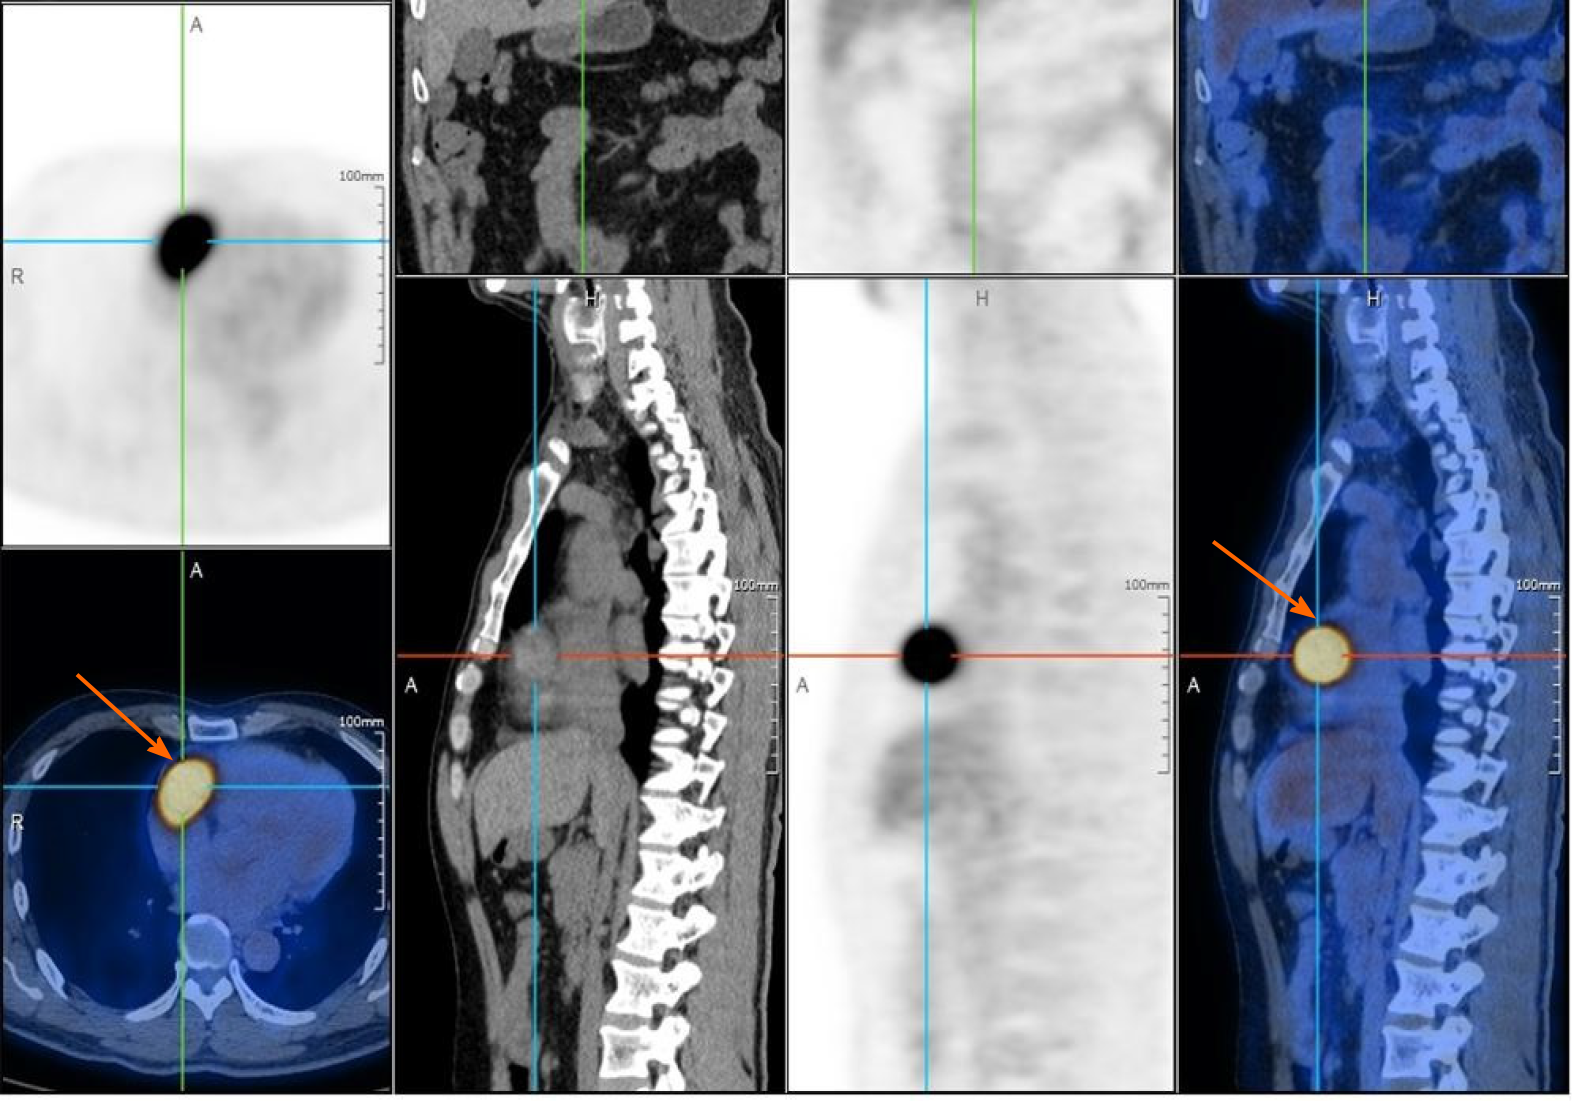
Figure 4 Positron emission tomography/computed tomography.
Positron emission tomography/computed tomography demonstrated an abnormal increased glucose metabolism nodule in the right atrioventricular groove. The maximum standardized uptake value was 21.1, suggesting that the intracardiac mass in the right atrioventricular groove (arrow) was a malignant tumor.
Figure 5 Intracardiac mass.
A: An intracardiac mass that was dark red was located in the right atrioventricular groove, and the right coronary artery crossed over the intracardiac mass; B: The intracardiac mass 3 cm × 2.5 cm × 2 cm in size was completely excised; C: When the mass was cut open, a solid content dark red in color was observed.
Figure 6 Immunohistochemistry.
A: Synaptophysin (positive); B: Chromogranin A (positive); C: Ki67 (3% positive); D: CD56 (positive); E: S100 (positive).
- Citation: Wang Q, Huang ZY, Ge JB, Shu XH. Nonhypertensive male with multiple paragangliomas of the heart and neck: A case report. World J Clin Cases 2020; 8(22): 5707-5714
- URL: https://www.wjgnet.com/2307-8960/full/v8/i22/5707.htm
- DOI: https://dx.doi.org/10.12998/wjcc.v8.i22.5707


