Copyright
©The Author(s) 2020.
World J Clin Cases. Nov 26, 2020; 8(22): 5657-5662
Published online Nov 26, 2020. doi: 10.12998/wjcc.v8.i22.5657
Published online Nov 26, 2020. doi: 10.12998/wjcc.v8.i22.5657
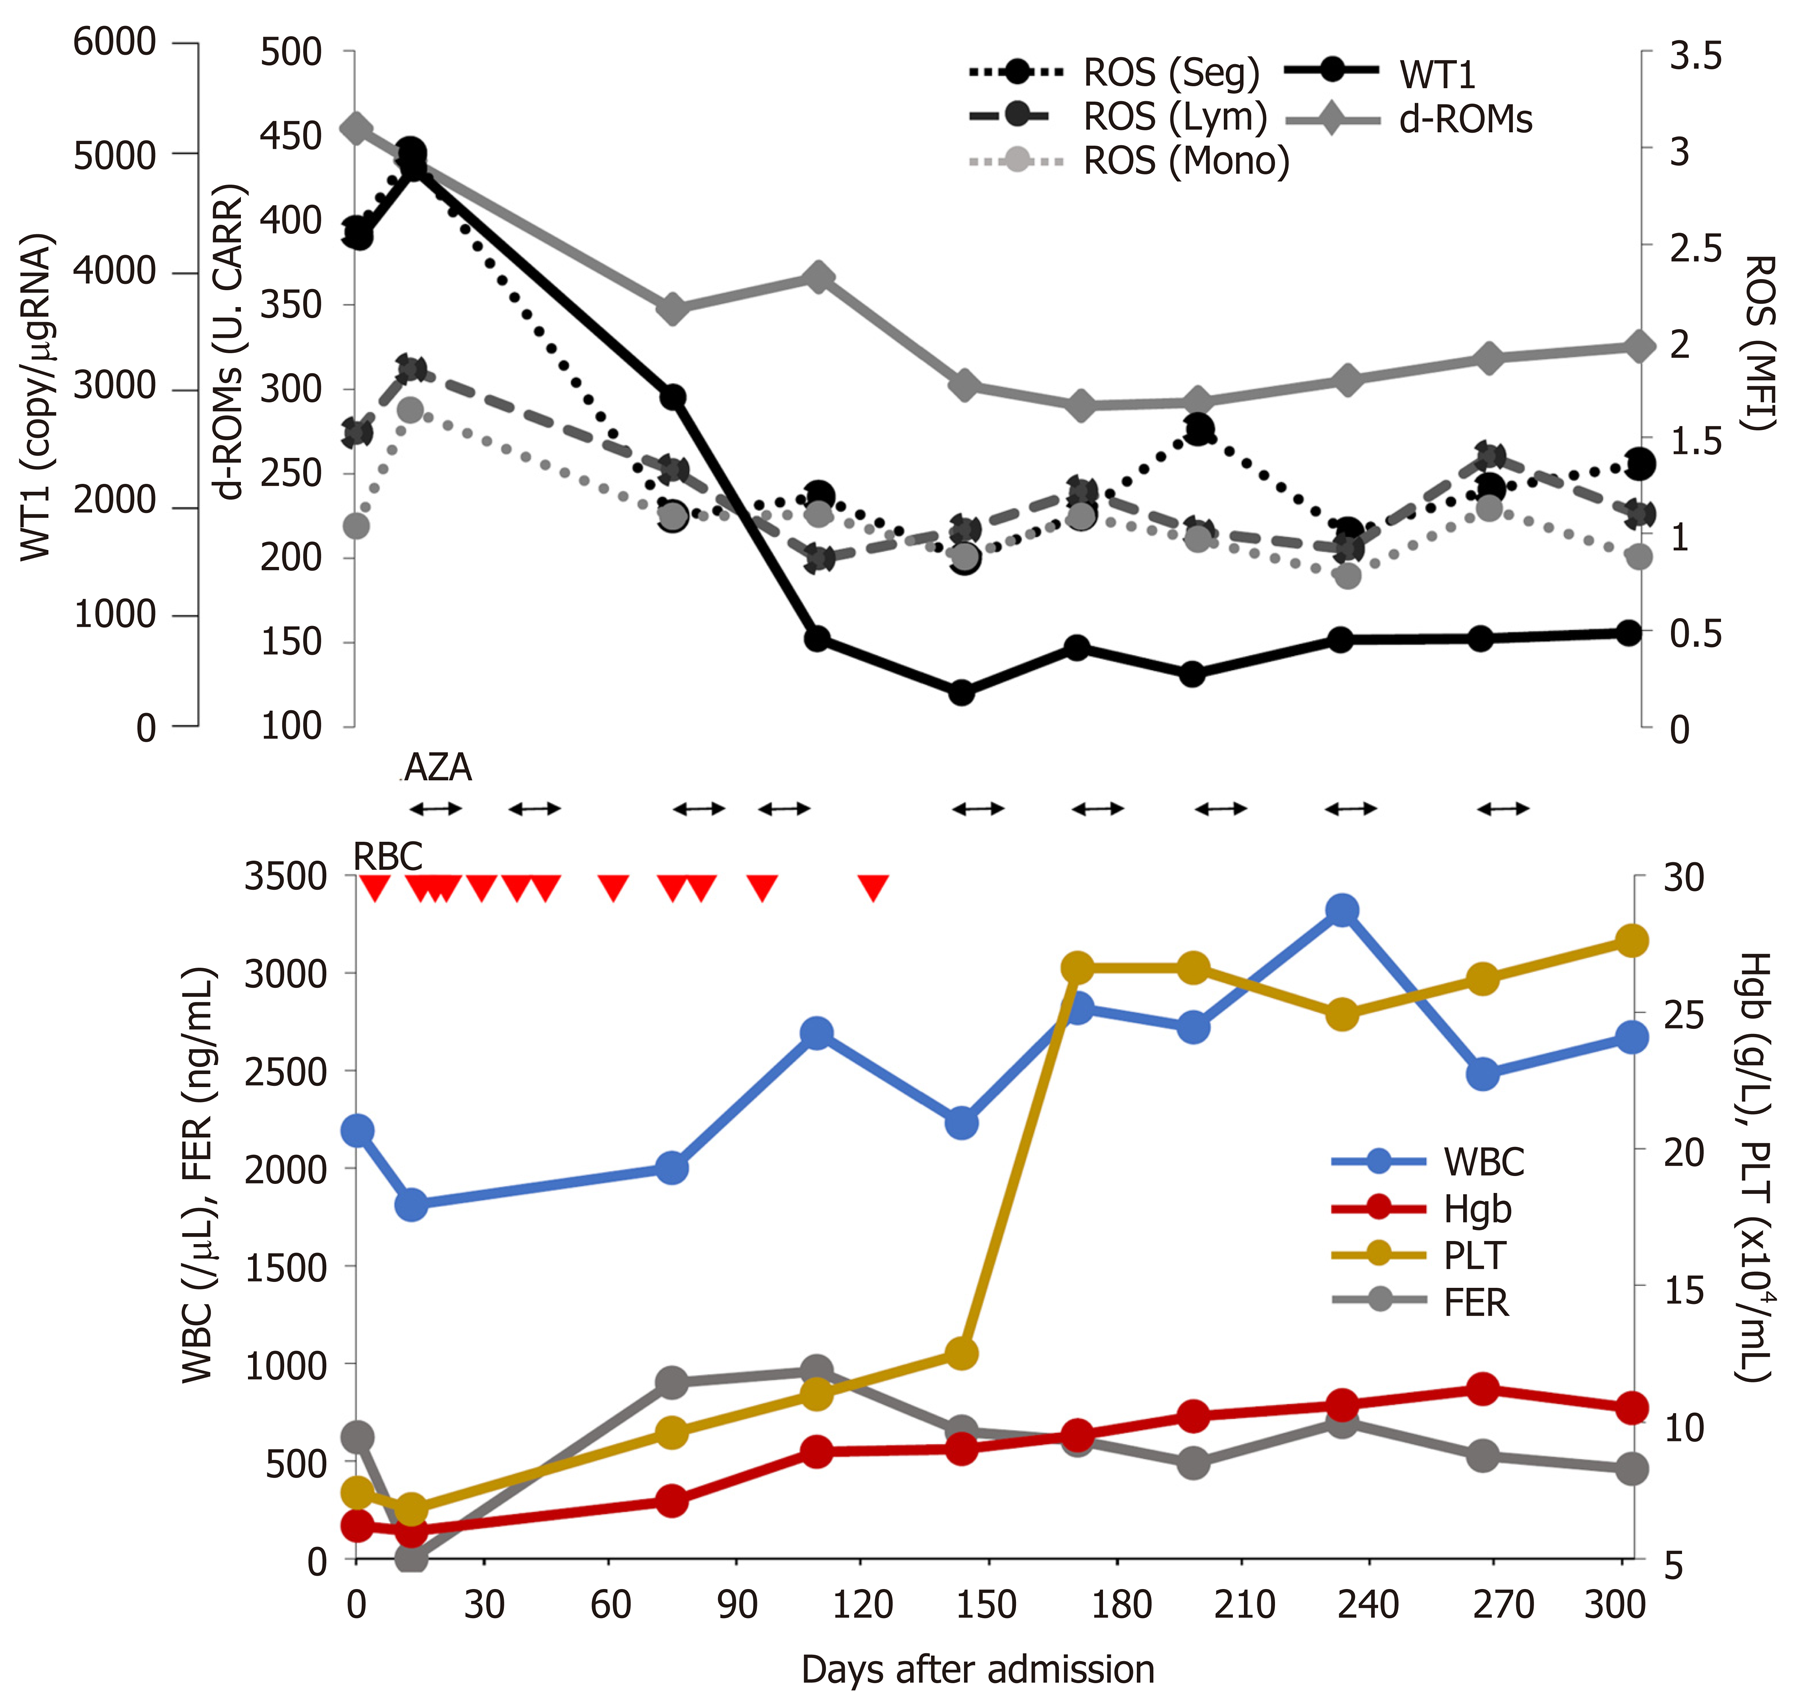
Figure 1 Clinical course with laboratory data during azacitidine therapy.
Red triangle (2 units): RBC: Red blood cell transfusions; ROS: Reactive oxygen species; AZA: Azacitidine, WT1: Wilms’ tumor 1; d-ROM: Derivatives of reactive oxygen metabolite; FER: Ferritin; Normal ranges: Serum d-ROM; < 300 Carratelli units; Ferritin: 18.6–261 ng/dL.
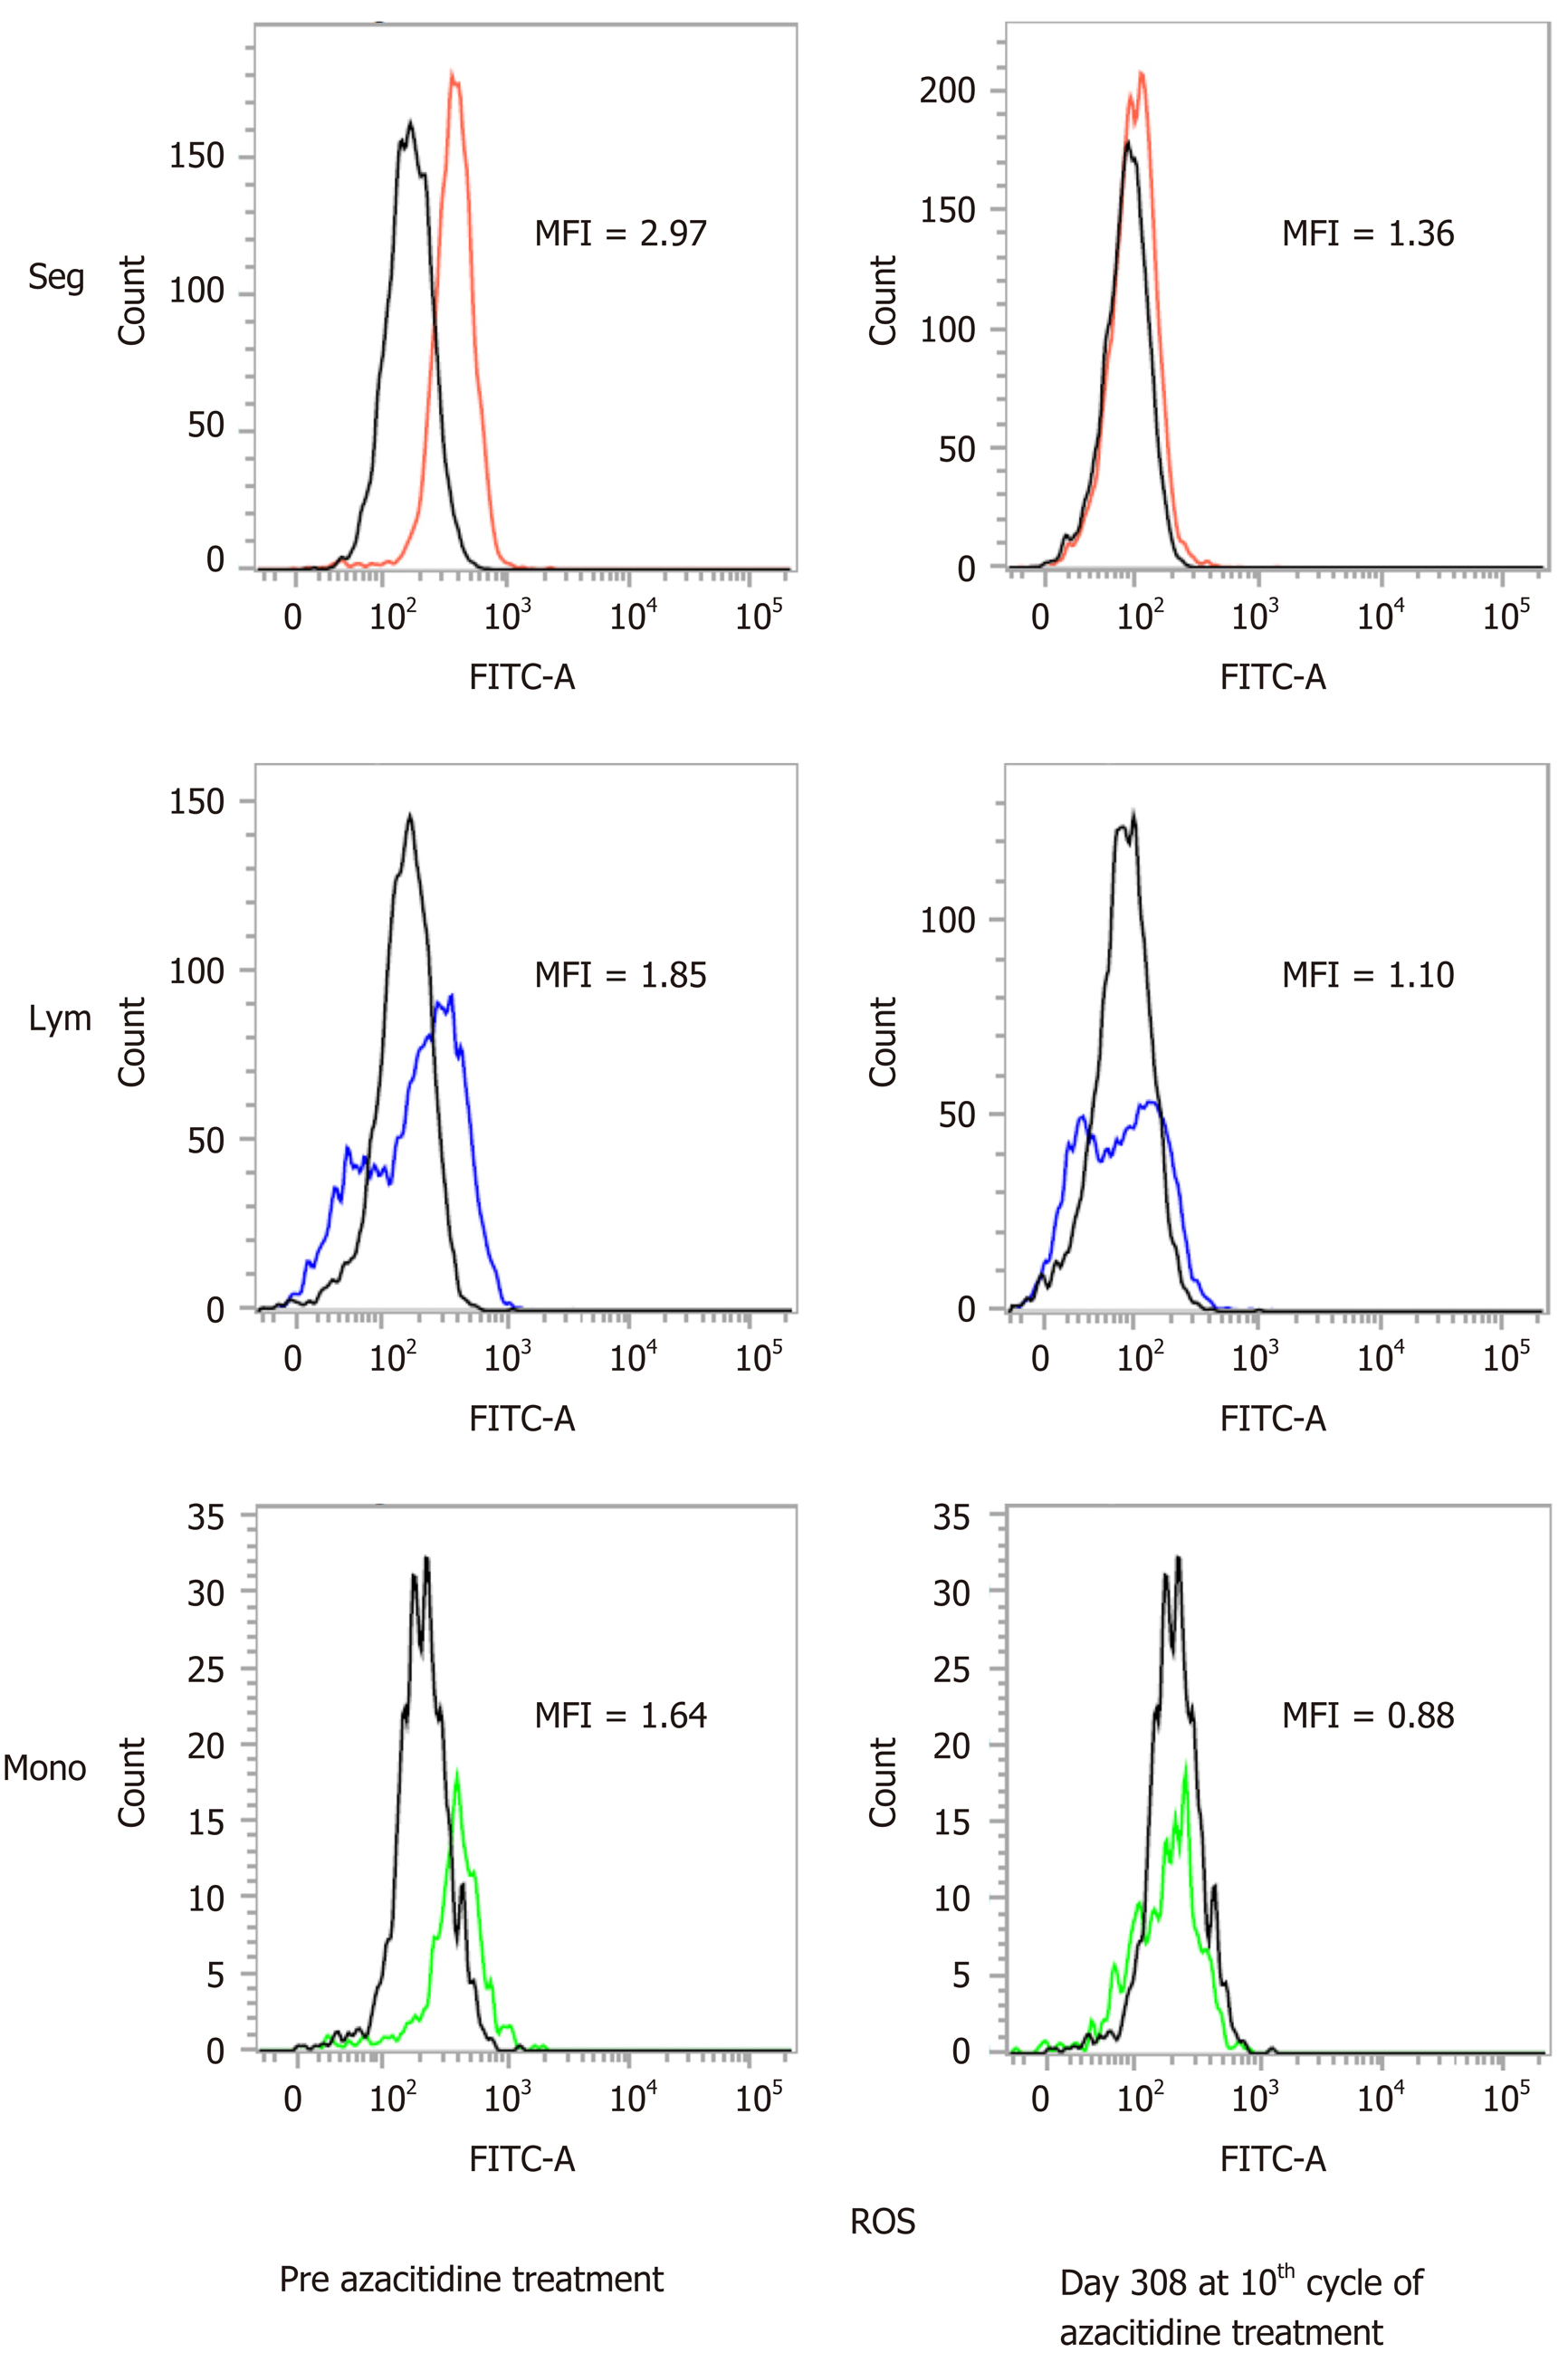
Figure 2 Flow cytometry analyses of reactive oxygen species in blood cells.
Each white blood cell was gated and its fluorescence distribution histogram and mean fluorescence intensity (MFI) are shown. MFI shows this patient value when the healthy control is 1. ROS: Reactive oxygen species; Seg: Segment; Ly: Lymphocyte; Mono: Monocyte.
- Citation: Hasunuma H, Shimizu N, Yokota H, Tatsuno I. Azacitidine decreases reactive oxygen species production in peripheral white blood cells: A case report. World J Clin Cases 2020; 8(22): 5657-5662
- URL: https://www.wjgnet.com/2307-8960/full/v8/i22/5657.htm
- DOI: https://dx.doi.org/10.12998/wjcc.v8.i22.5657


