Copyright
©The Author(s) 2020.
World J Clin Cases. Nov 26, 2020; 8(22): 5518-5528
Published online Nov 26, 2020. doi: 10.12998/wjcc.v8.i22.5518
Published online Nov 26, 2020. doi: 10.12998/wjcc.v8.i22.5518
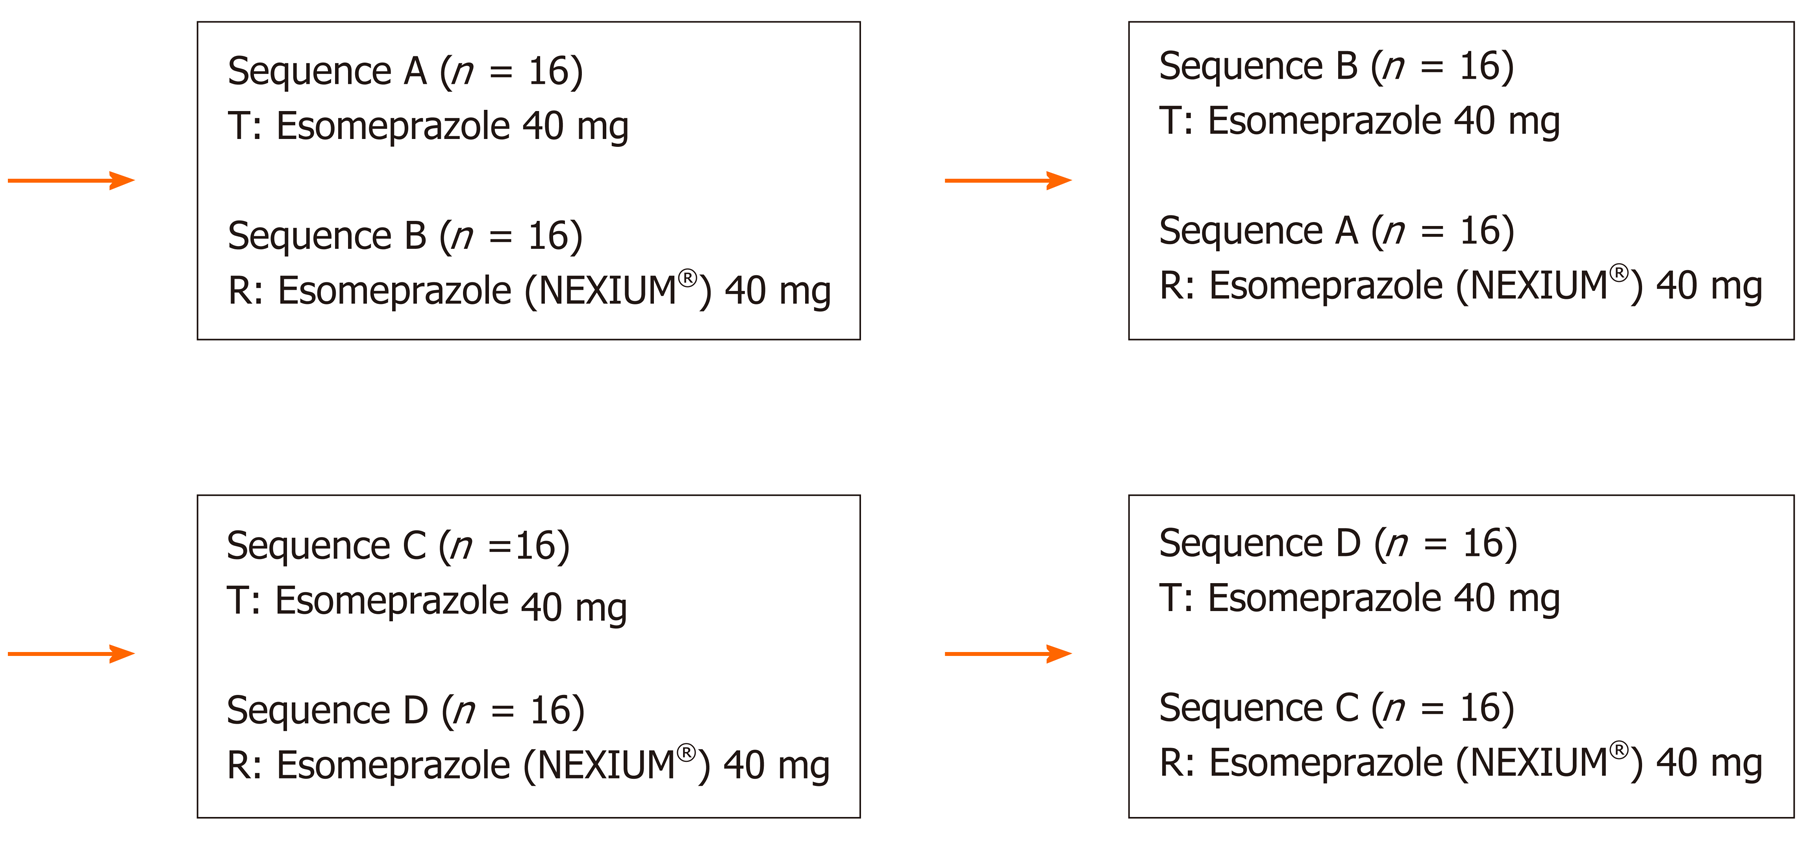
Figure 1 Sequence A (n = 16) and sequence B (n = 16) in fasting status; sequence C (n = 16) and sequence D (n = 16) in fed status.
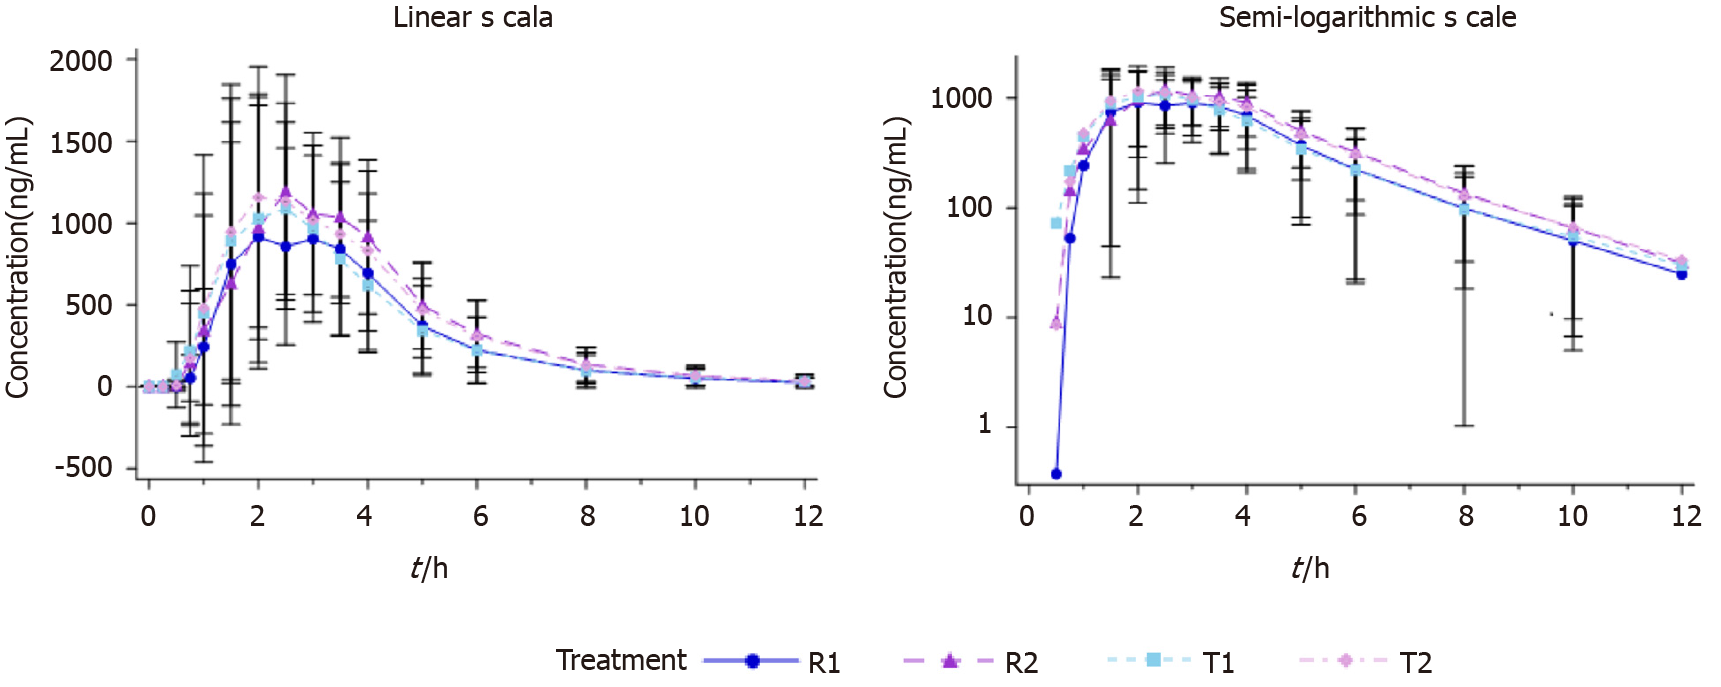
Figure 2 Plasma concentrations (mean ± standard deviation).
Time curve of esomeprazole in fasting status (linear and semi-logarithmic).
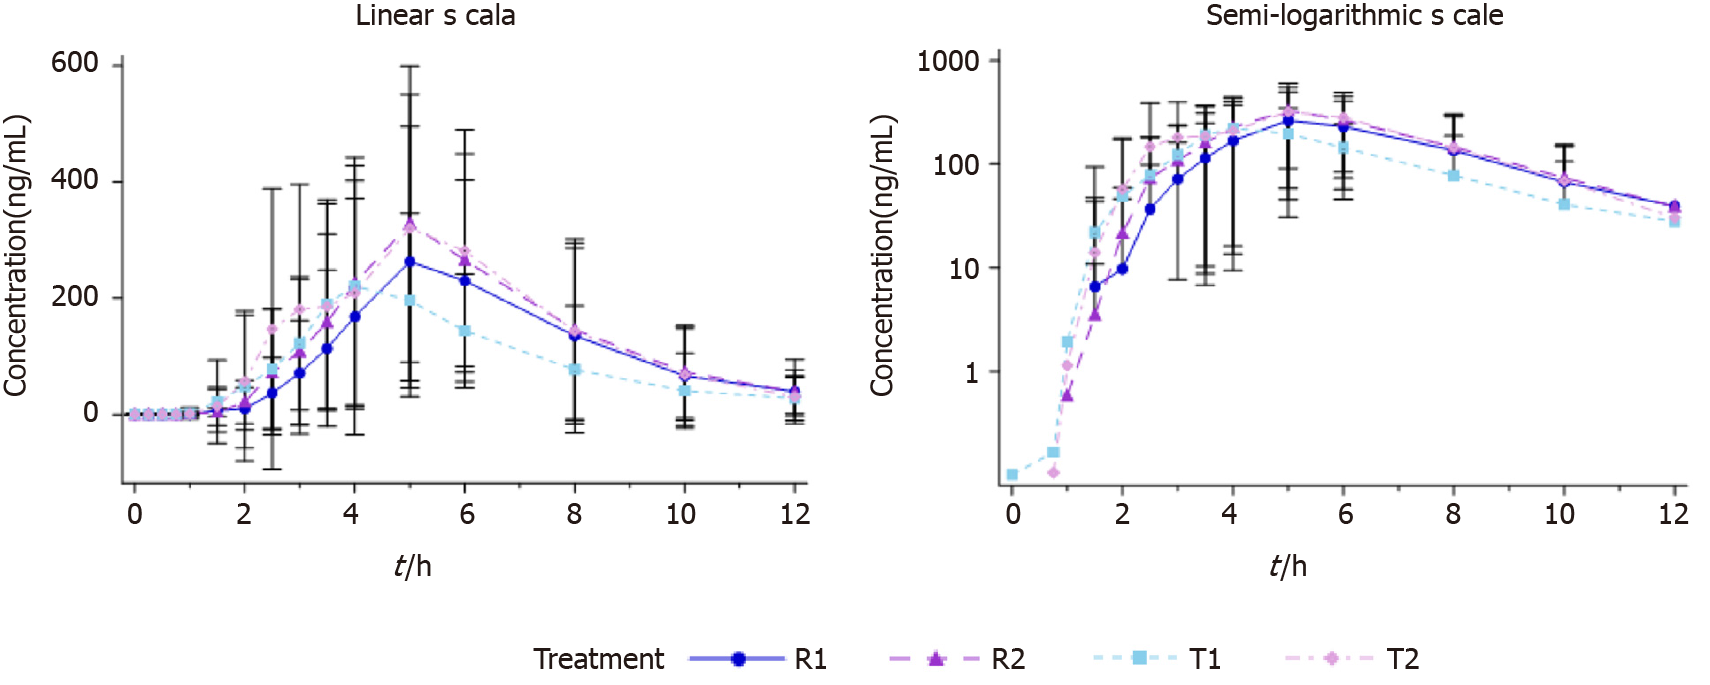
Figure 3 Plasma concentrations (mean ± standard deviation).
Time curve of esomeprazole in fed status (linear and semi-logarithmic).
- Citation: Liu ZZ, Ren Q, Zhou YN, Yang HM. Bioequivalence of two esomeprazole magnesium enteric-coated formulations in healthy Chinese subjects. World J Clin Cases 2020; 8(22): 5518-5528
- URL: https://www.wjgnet.com/2307-8960/full/v8/i22/5518.htm
- DOI: https://dx.doi.org/10.12998/wjcc.v8.i22.5518


