Copyright
©The Author(s) 2020.
World J Clin Cases. Nov 26, 2020; 8(22): 5501-5512
Published online Nov 26, 2020. doi: 10.12998/wjcc.v8.i22.5501
Published online Nov 26, 2020. doi: 10.12998/wjcc.v8.i22.5501
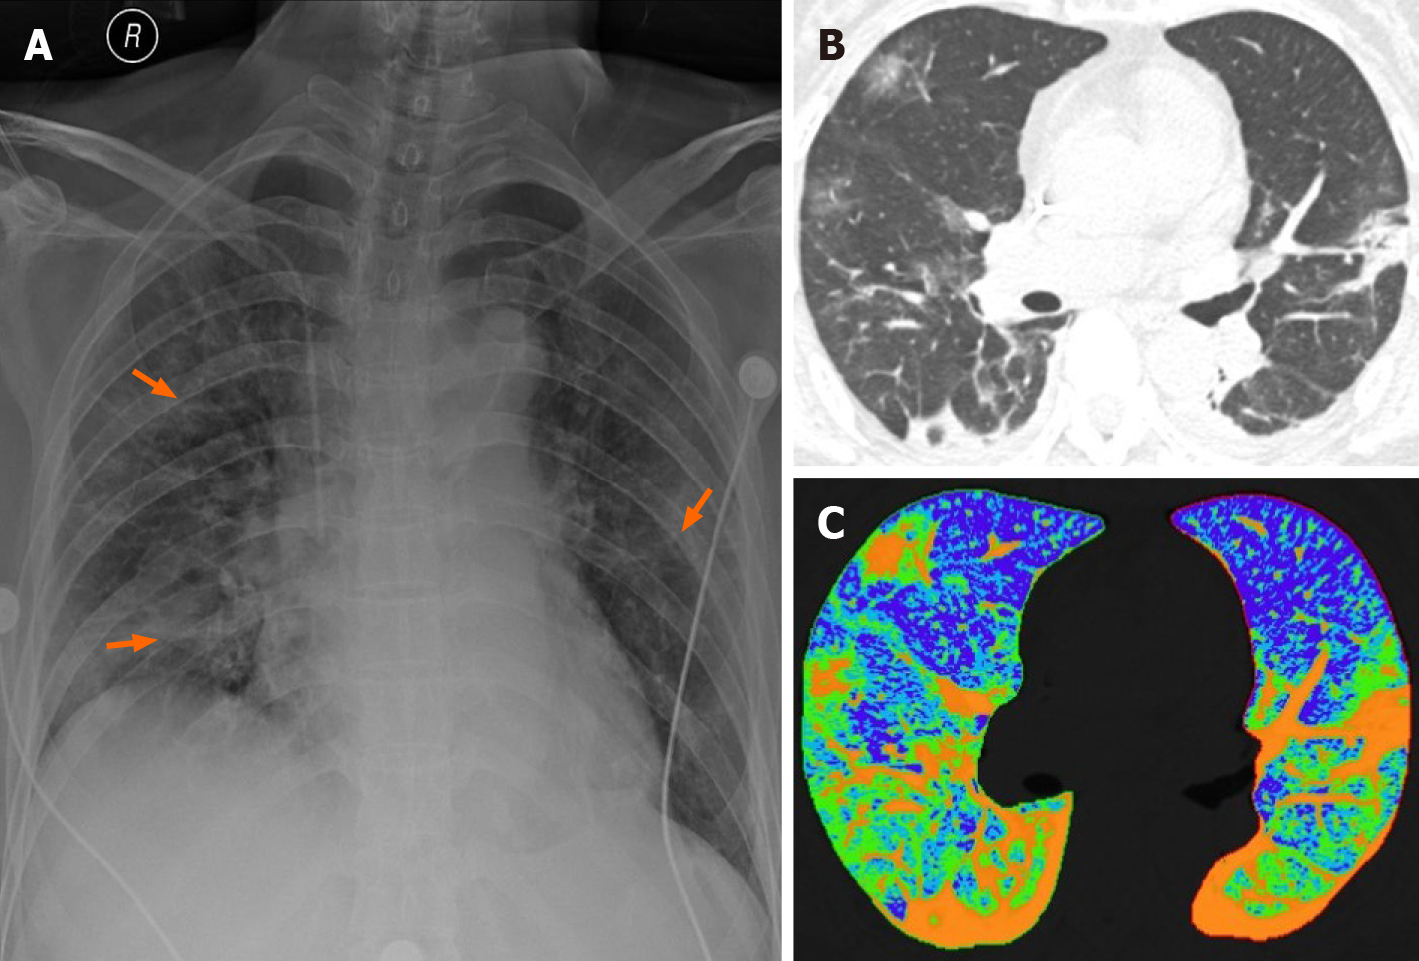
Figure 1 Chest radiography and computed tomography images of a 65-year-old coronavirus disease-2019 patient.
A: Posteroanterior chest radiography showed multiple patchy high density shadows (orange arrow) in the outer field of bilateral lungs; B: The thin-section transverse computed tomography image revealed multiple ground-glass opacities, consolidation, fibrosis and thickened pleura in the peripheral area of both lungs; C: The two-dimensional pseudocolor reconstruction image highlighted the distribution and range of pulmonary lesions (orange area).
Figure 2 Artificial intelligence for coronavirus disease-2019.
A 33-year-old female who lived in Wuhan presented with fever. She was confirmed to have coronavirus disease-2019 infection by real-time fluorescence PCR. A: Computed tomography image showed multiple ground-glass opacities patches; B: Using artificial intelligence software can obtain quantitative analysis results of lesion distribution, proportion, volume and density.
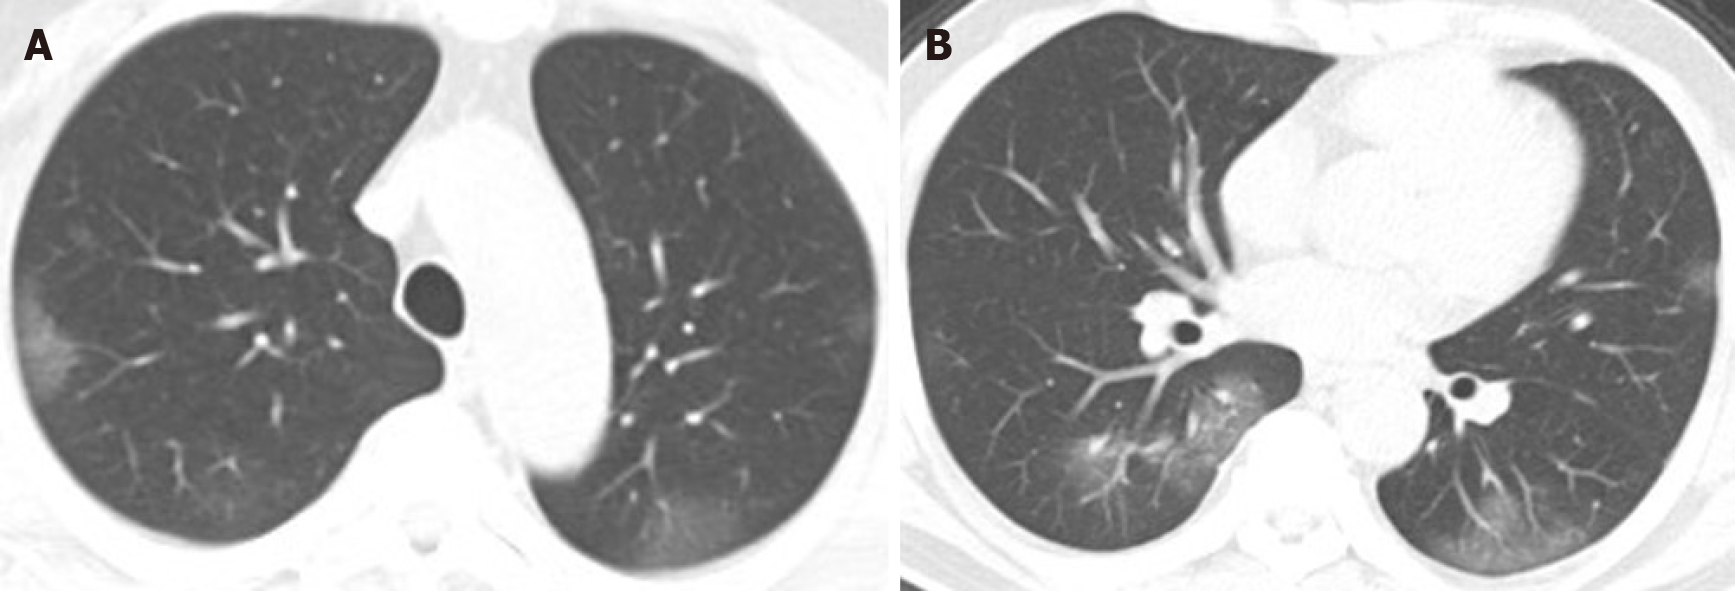
Figure 3 Typical computed tomography manifestations of coronavirus disease-2019: ground glass opacity.
A, B: Transverse computed tomography images displayed multiple peripherally distributed ground-glass opacities in bilateral lungs.
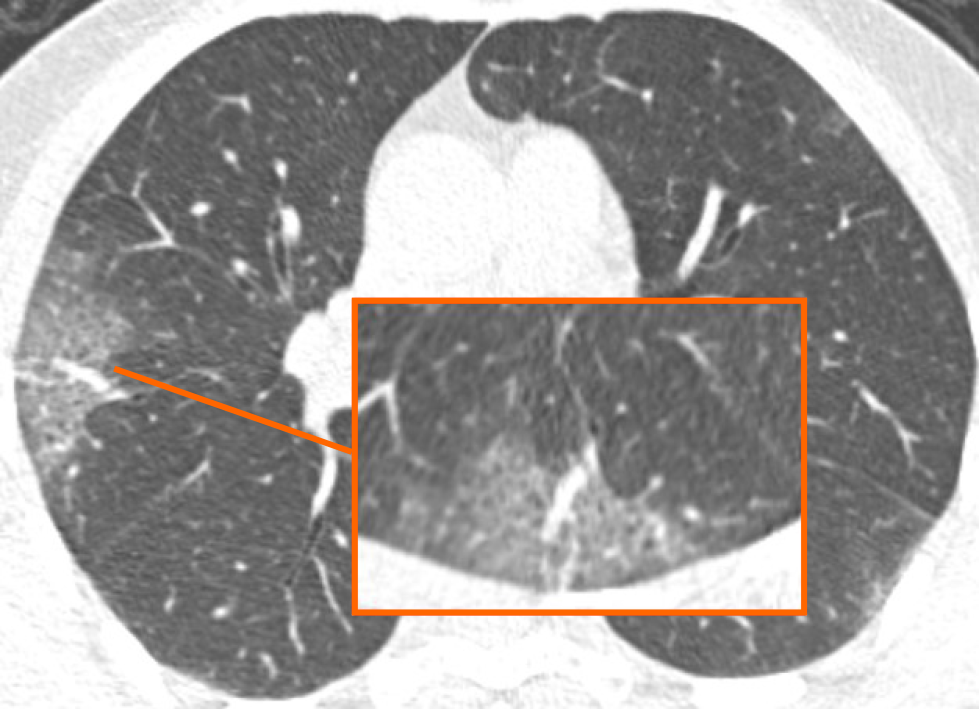
Figure 4 Typical computed tomography manifestations of coronavirus disease-2019: Reticular pattern.
Computed tomography imaging showed a ground-glass opacity in the right lung with the reticular pattern (orange frame) inside, which refers to the thickening of the interstitial structures such as interlobular septa.
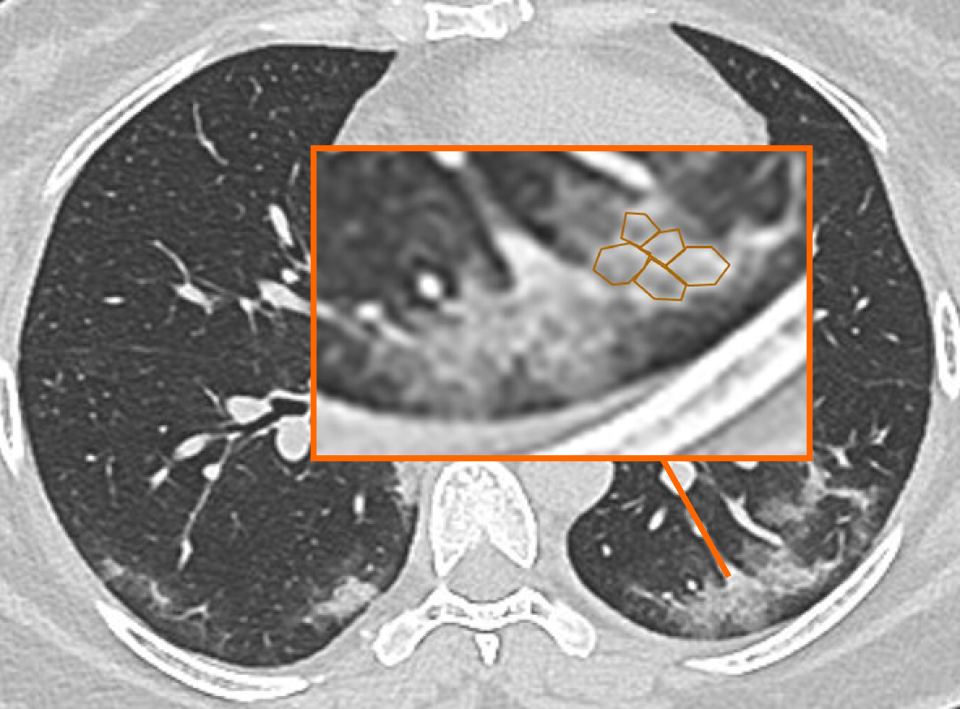
Figure 5 Typical computed tomography manifestations of coronavirus disease-2019: Crazy paving pattern.
Crazy paving pattern in which interlobular septa thicken and interlobular interior lines interwoven into a grid was seen in a ground-glass opacity background.
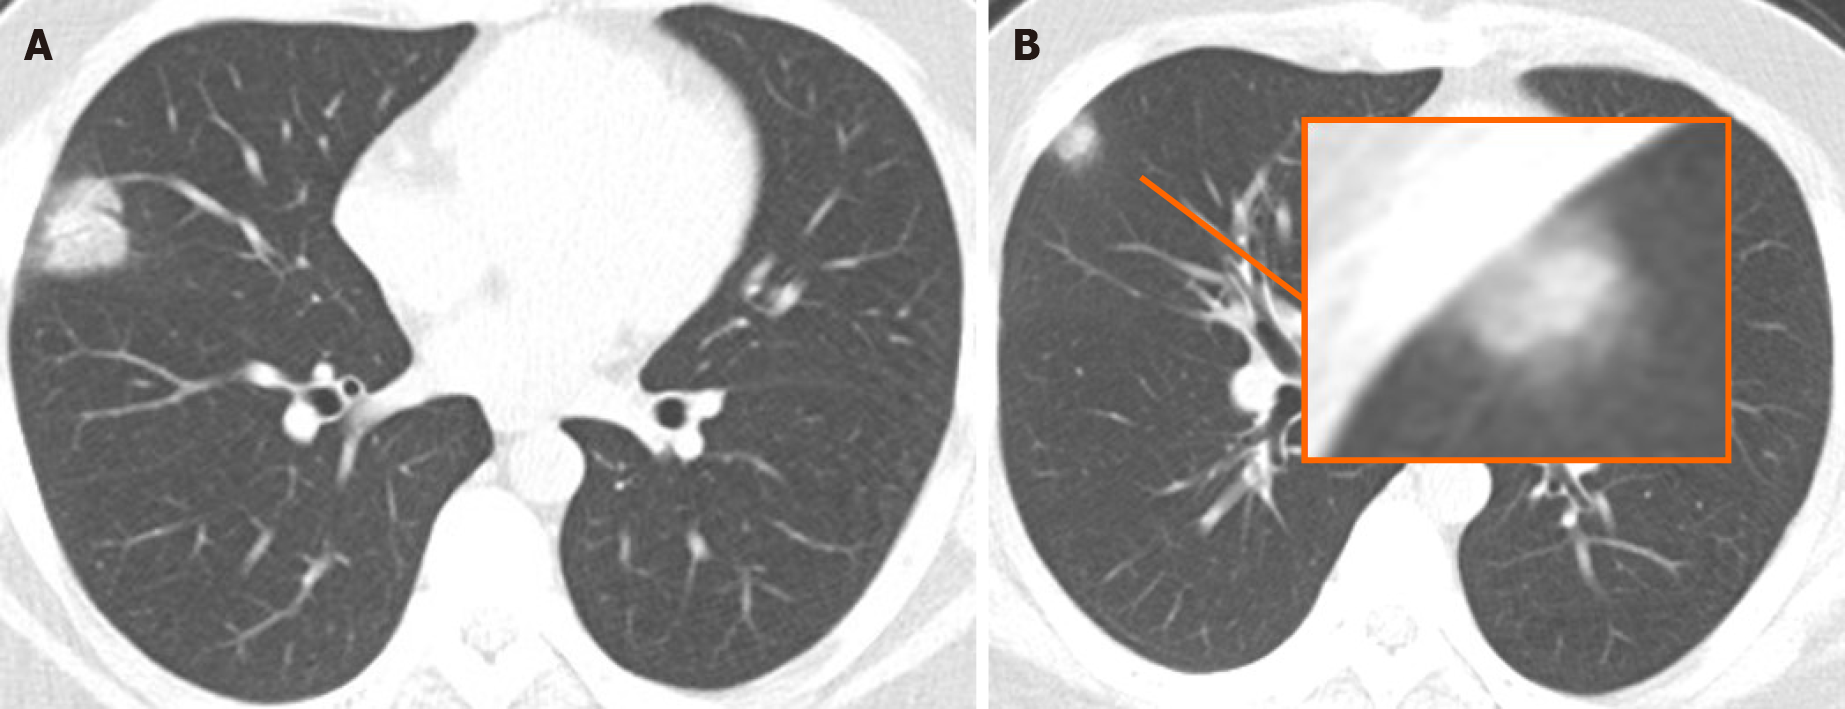
Figure 6 Typical computed tomography manifestations of coronavirus disease-2019: Consolidation.
A: Computed tomography imaging from a 30-year-old male with coronavirus disease-2019 displayed a single solid mass shadow in the middle lobe of the right lung; B: Consolidation combined with surrounding halo sign.
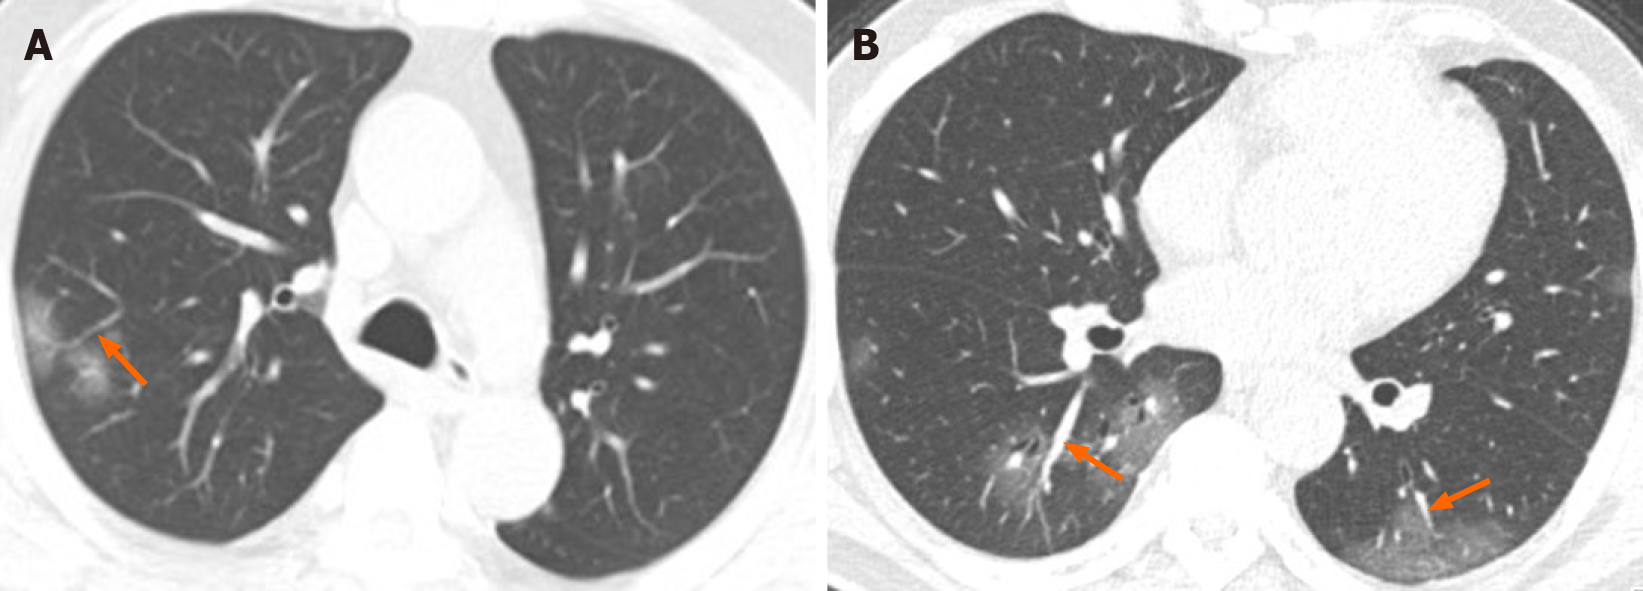
Figure 7 Typical computed tomography manifestations of coronavirus disease-2019: Vascular enlargement.
A: Ground-glass opacity combined with vascular enlargement sign (orange arrow); B: Computed tomography image showed patchy ground glass opacities in the lower lobe of bilateral lungs with dilated vessels inside. Bronchiolectasis was seen in the lesions of the right lower lung.
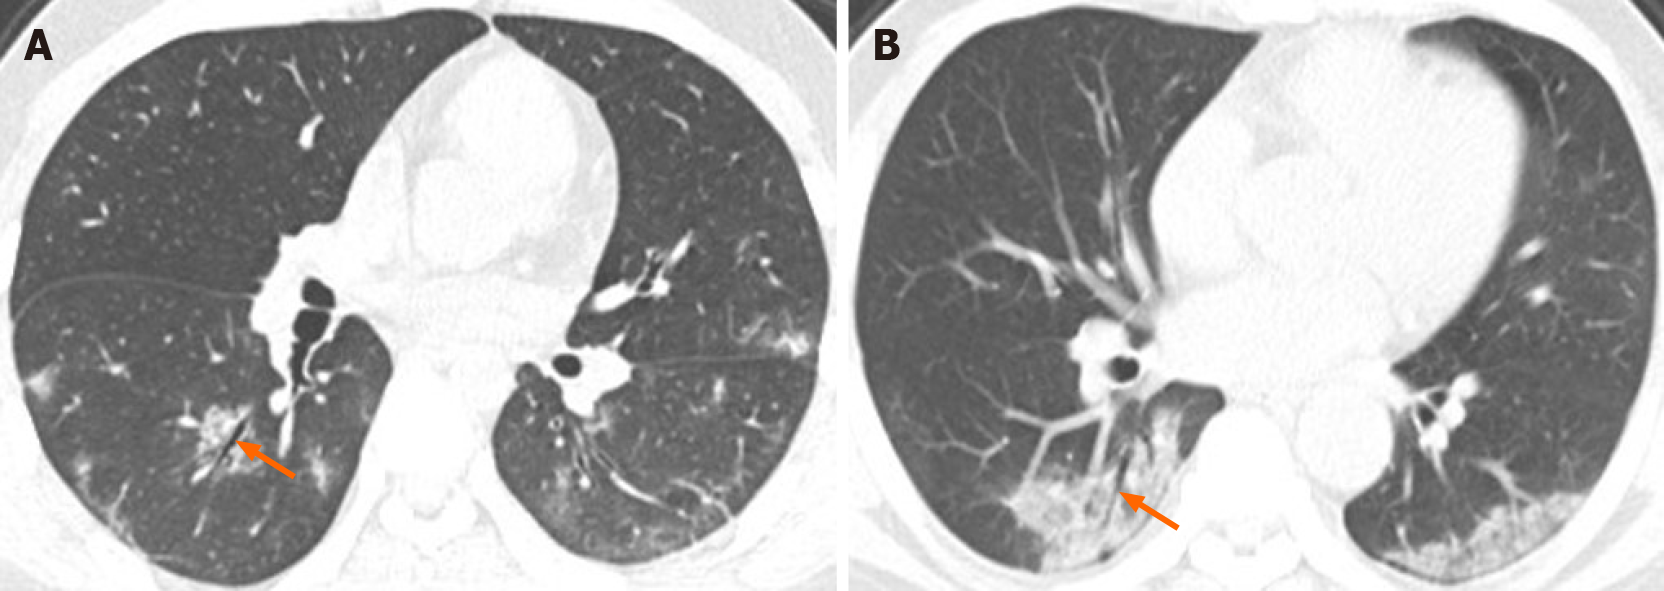
Figure 8 Typical computed tomography manifestations of coronavirus disease-2019: Bronchiolar dilation sign.
A: Bronchiolar dilation sign refers to the dilatation of the bronchioles (orange arrow) inside or at the margin of the lesions; B: Patchy consolidation of the right lower lung with bronchiectasis.
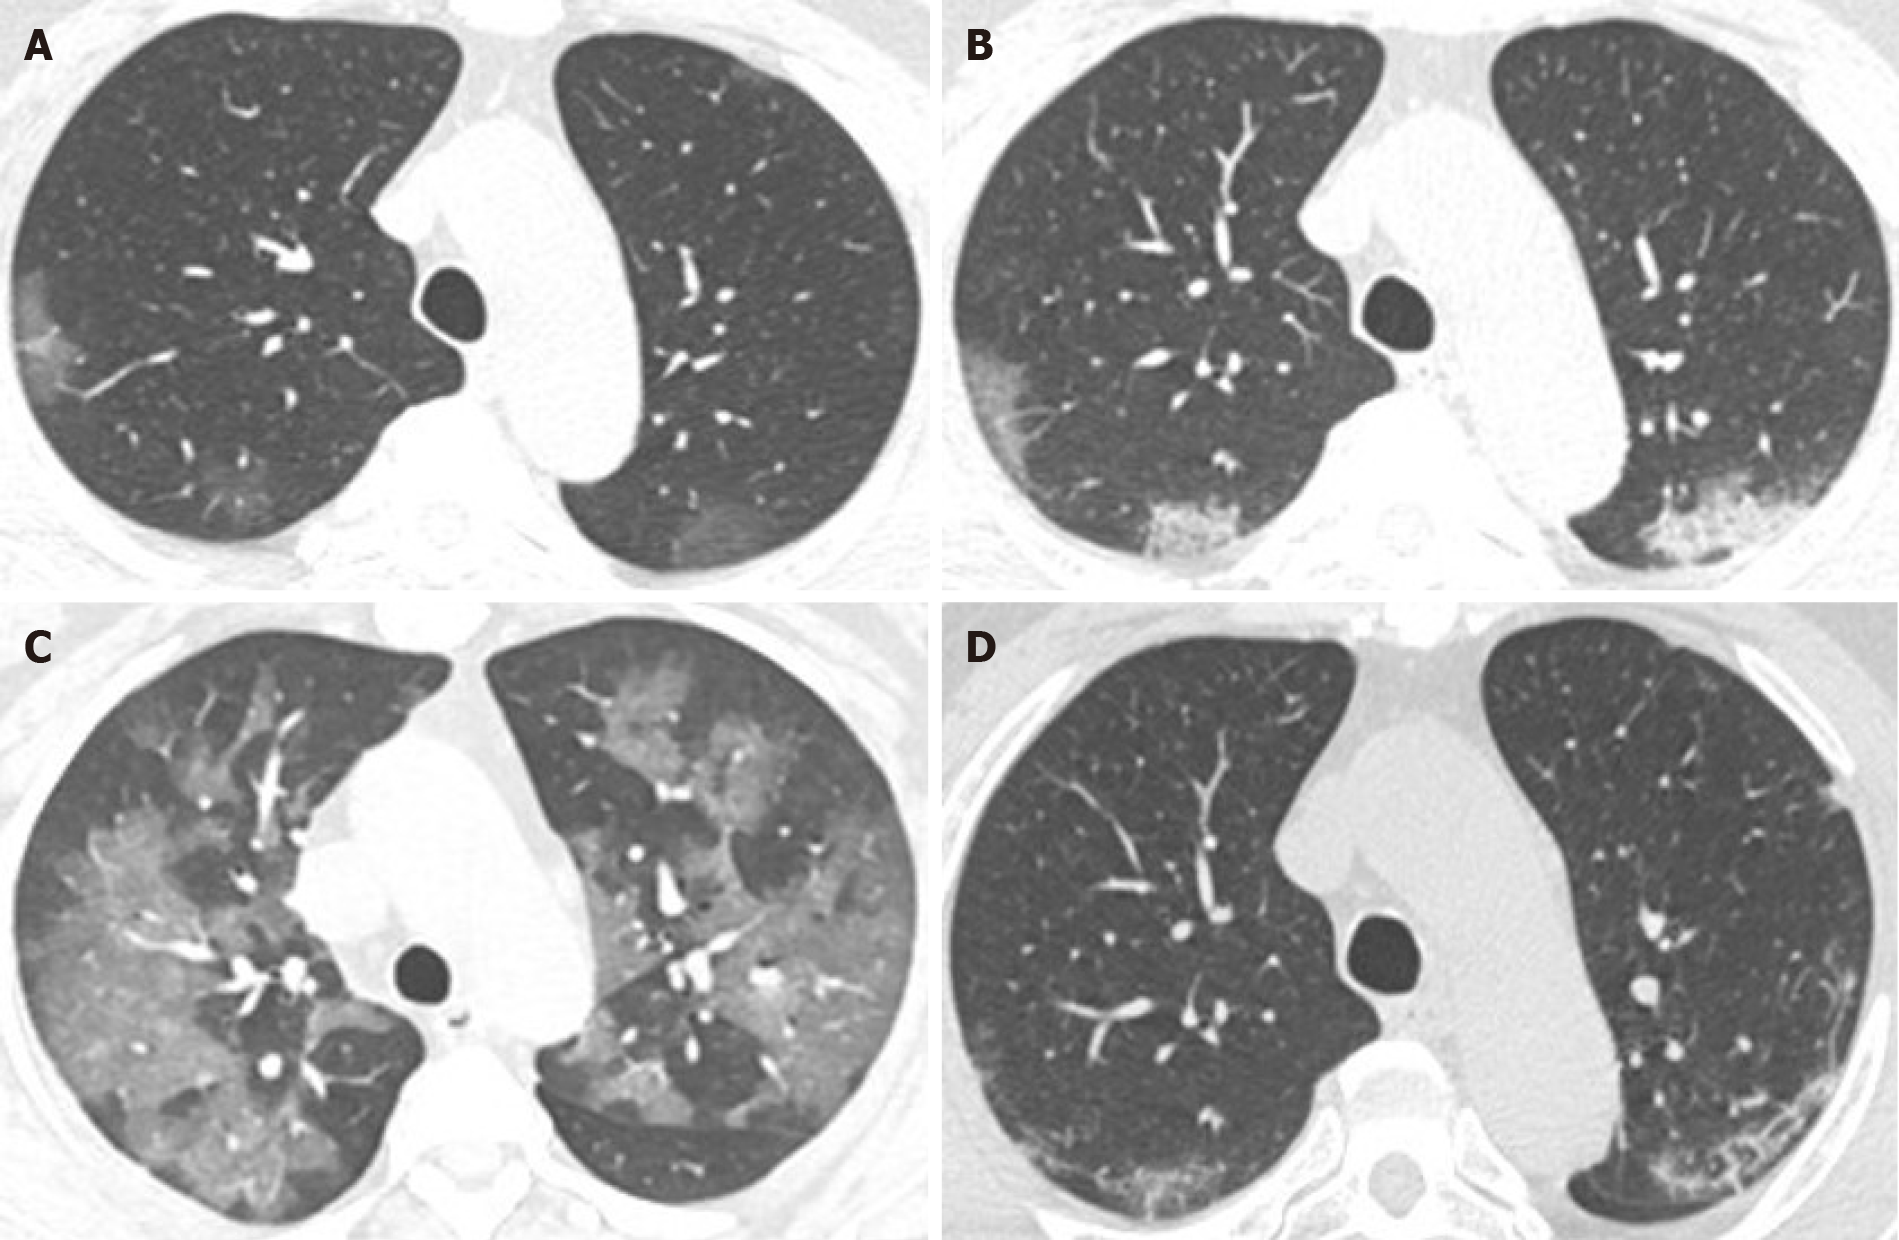
Figure 9 Time course of coronavirus disease-2019 pneumonia.
A: Early stage; B: Progressive stage; C: Severe stage; D: Absorption stage.
- Citation: Tang L, Wang Y, Zhang Y, Zhang XY, Zeng XC, Song B. COVID-19: A review of what radiologists need to know. World J Clin Cases 2020; 8(22): 5501-5512
- URL: https://www.wjgnet.com/2307-8960/full/v8/i22/5501.htm
- DOI: https://dx.doi.org/10.12998/wjcc.v8.i22.5501


