Copyright
©The Author(s) 2020.
World J Clin Cases. Nov 6, 2020; 8(21): 5313-5319
Published online Nov 6, 2020. doi: 10.12998/wjcc.v8.i21.5313
Published online Nov 6, 2020. doi: 10.12998/wjcc.v8.i21.5313
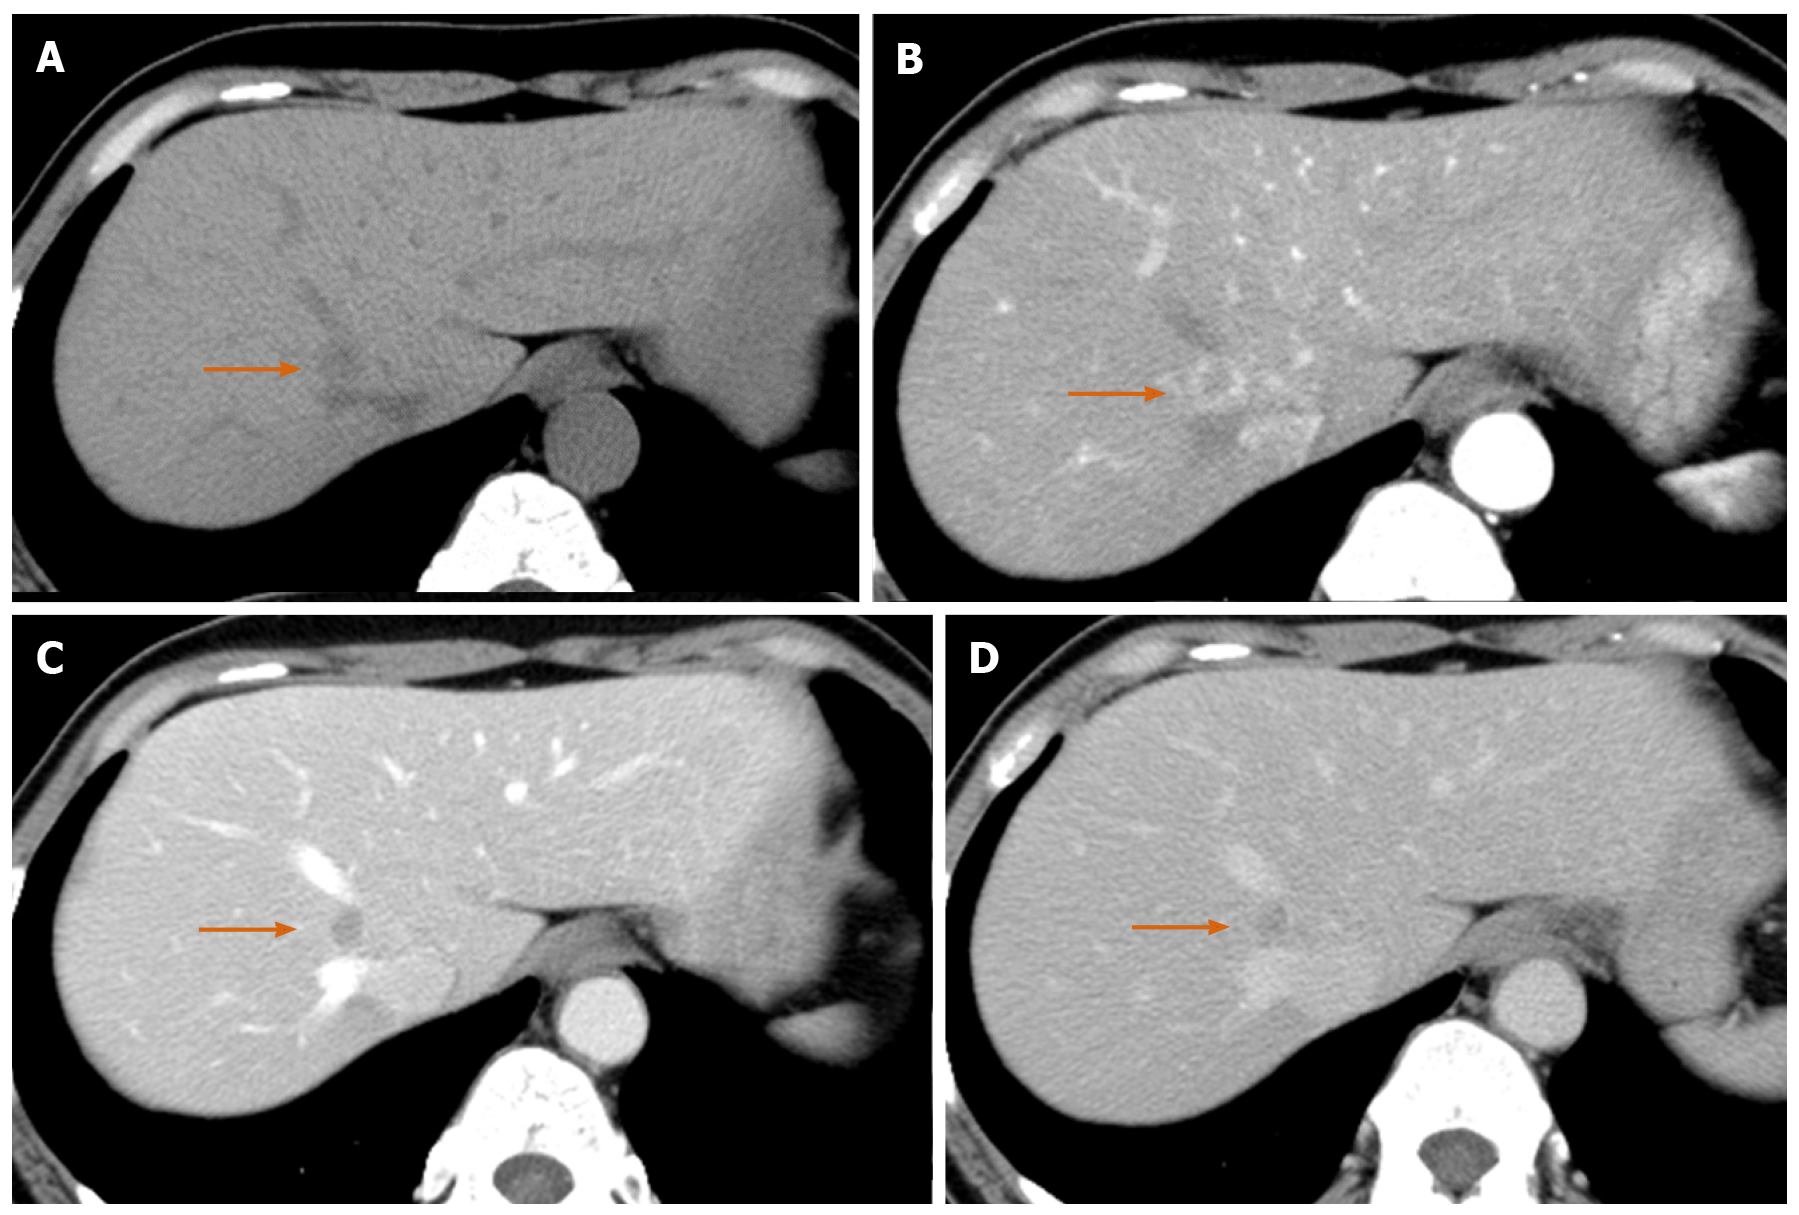
Figure 1 Computed tomography scan of a 54-year-old woman with reactive lymphoid hyperplasia (arrow).
A: Precontrast computed tomography showed a low density nodule in liver segment 1; B: The lesion showed perinodular enhancement in the arterial phase; C: The lesion showed washout in the portal phase; D: Although the lesion remained in low density in the equilibrium phase, the slight enhancement was observed in the lesion compared with the portal phase.
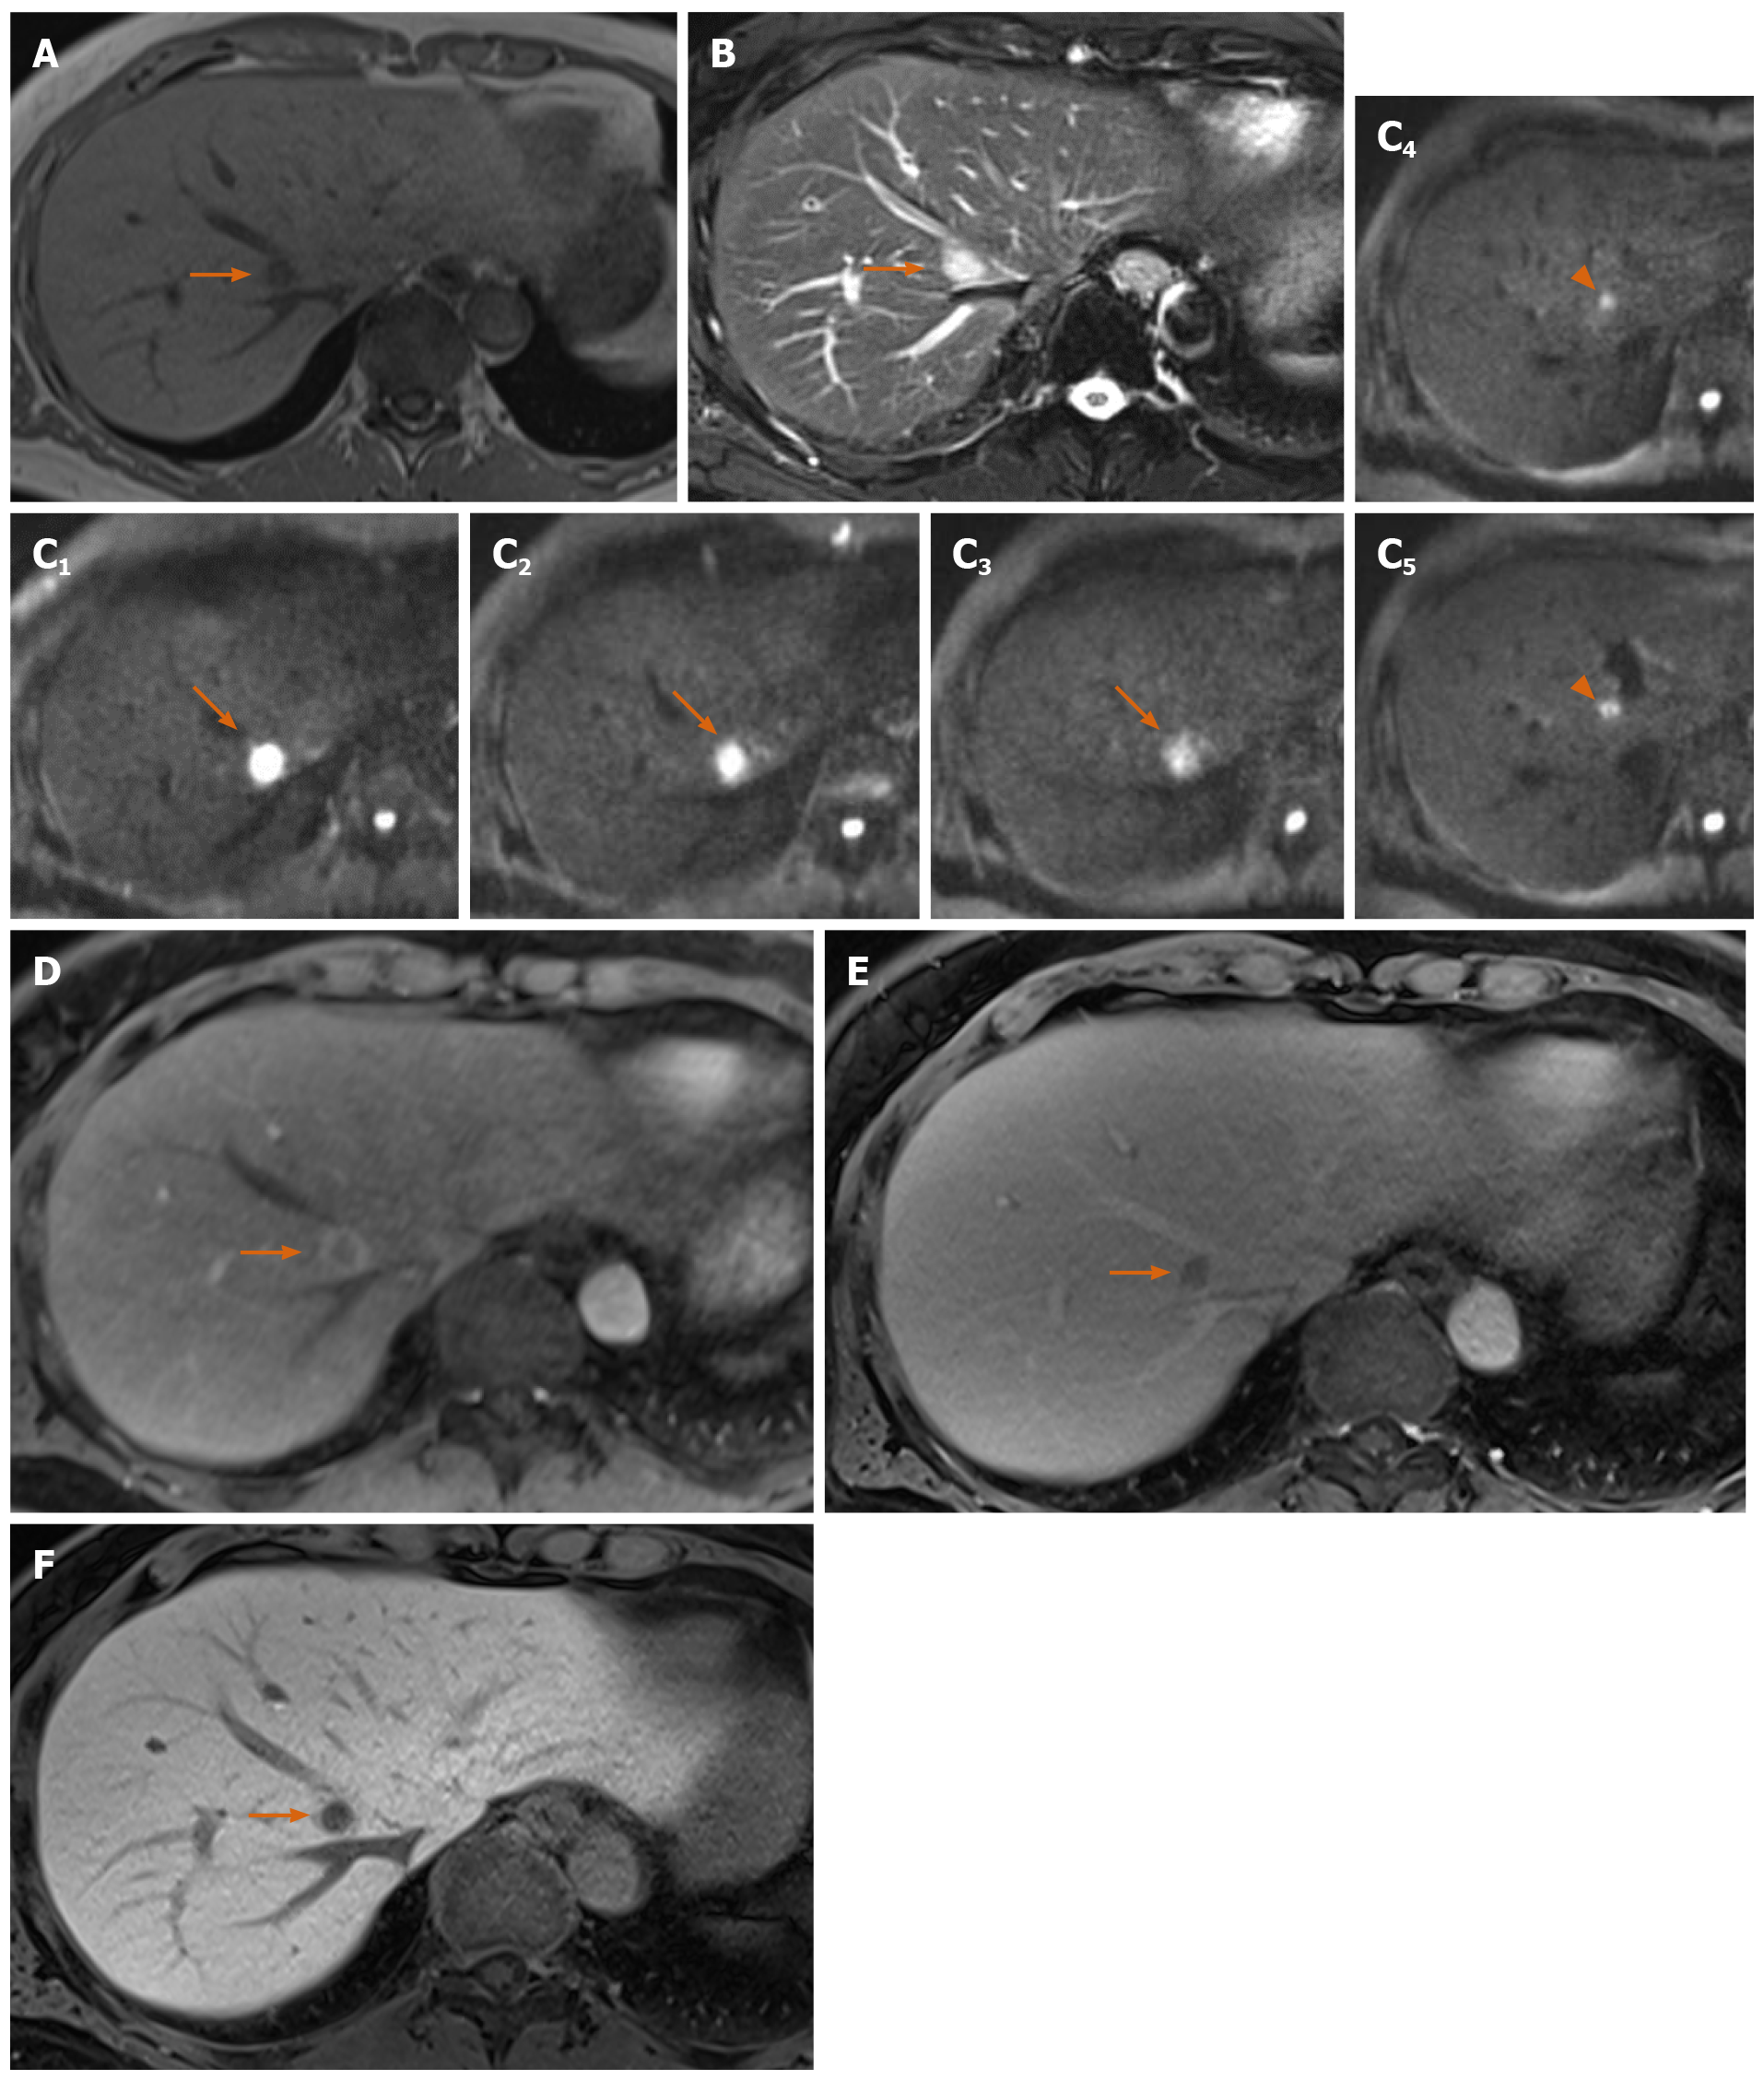
Figure 2 Magnetic resonance imaging of a 54-year-old woman with reactive lymphoid hyperplasia (arrow).
A: T1-weighted in-phase image showed the hypointense lesion on liver segment 1; B: The lesion was a hyperintensity on fat-saturated T2-weighted image; C: The lesion had obvious hyperintensity on diffusion-weighted imaging. On serial imaging in diffusion-weighted imaging (numbered in order from the head direction), there was linear hyperintensity along the portal tract (arrowheads) consecutive to the liver lesion; D: The lesion showed perinodular enhancement in the arterial phase on gadoxetic acid–enhanced magnetic resonance imaging; E: The lesion showed washout in the portal phase; F: The lesion showed low signal intensity in the hepatobiliary phase.
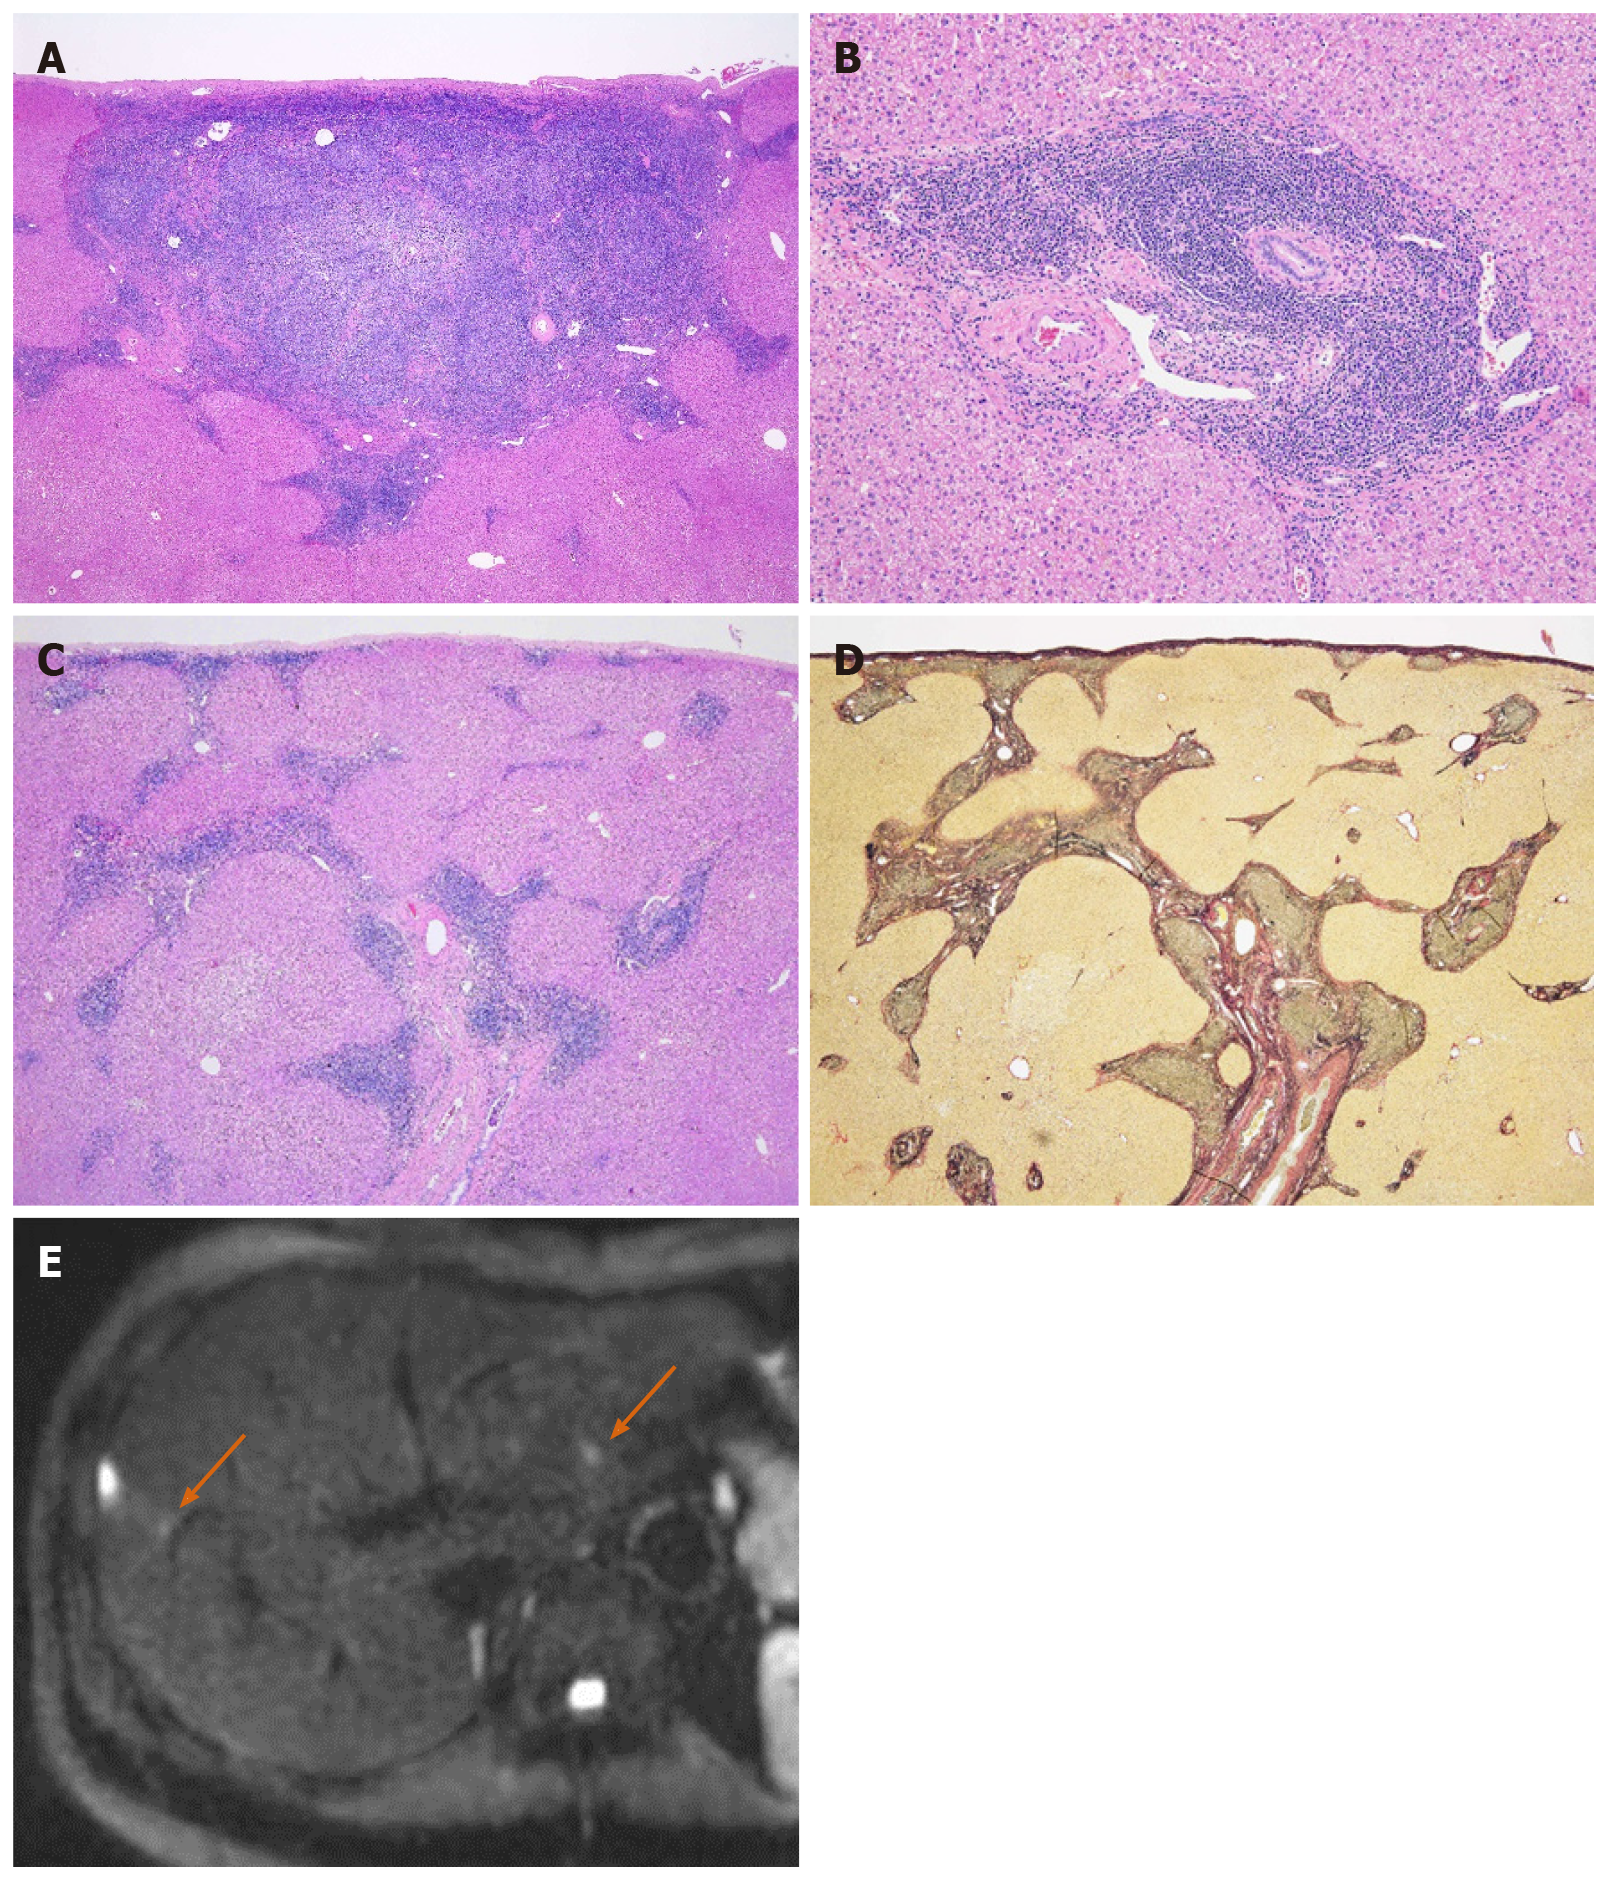
Figure 3 Pathological findings and diffusion-weighted imaging of reactive lymphoid hyperplasia on liver segment 8.
A: Hematoxylin and eosin stain (20 ×). Histologically, there was dense lymphoplasmacytic infiltration in the subserosa region of the liver (segment 8), forming various-sized lymphoid follicles with enlarged germinal centers; B: Hematoxylin and eosin stain (100 ×). These cells did not invade into the hepatic lobules, and the limiting plates were preserved; C: Hematoxylin and eosin stain (20 ×). At the peripheral site of the lesion, lymphoplasmacytic infiltration extended along the portal tracts in a radial pattern; D: Elastica van Gieson stain (20 ×). There was no definite evidence of portal venular stenosis or fibrosis; E: Diffusion-weighted imaging showed the lesion corresponding to this pathologically presented lesion. There was linear hyperintensity along the portal tract close to the liver lesions (arrow).
- Citation: Tanaka T, Saito K, Yunaiyama D, Matsubayashi J, Nagakawa Y, Tanigawa M, Nagao T. Diffusion-weighted imaging might be useful for reactive lymphoid hyperplasia diagnosis of the liver: A case report. World J Clin Cases 2020; 8(21): 5313-5319
- URL: https://www.wjgnet.com/2307-8960/full/v8/i21/5313.htm
- DOI: https://dx.doi.org/10.12998/wjcc.v8.i21.5313


