Copyright
©The Author(s) 2020.
World J Clin Cases. Oct 26, 2020; 8(20): 5042-5048
Published online Oct 26, 2020. doi: 10.12998/wjcc.v8.i20.5042
Published online Oct 26, 2020. doi: 10.12998/wjcc.v8.i20.5042
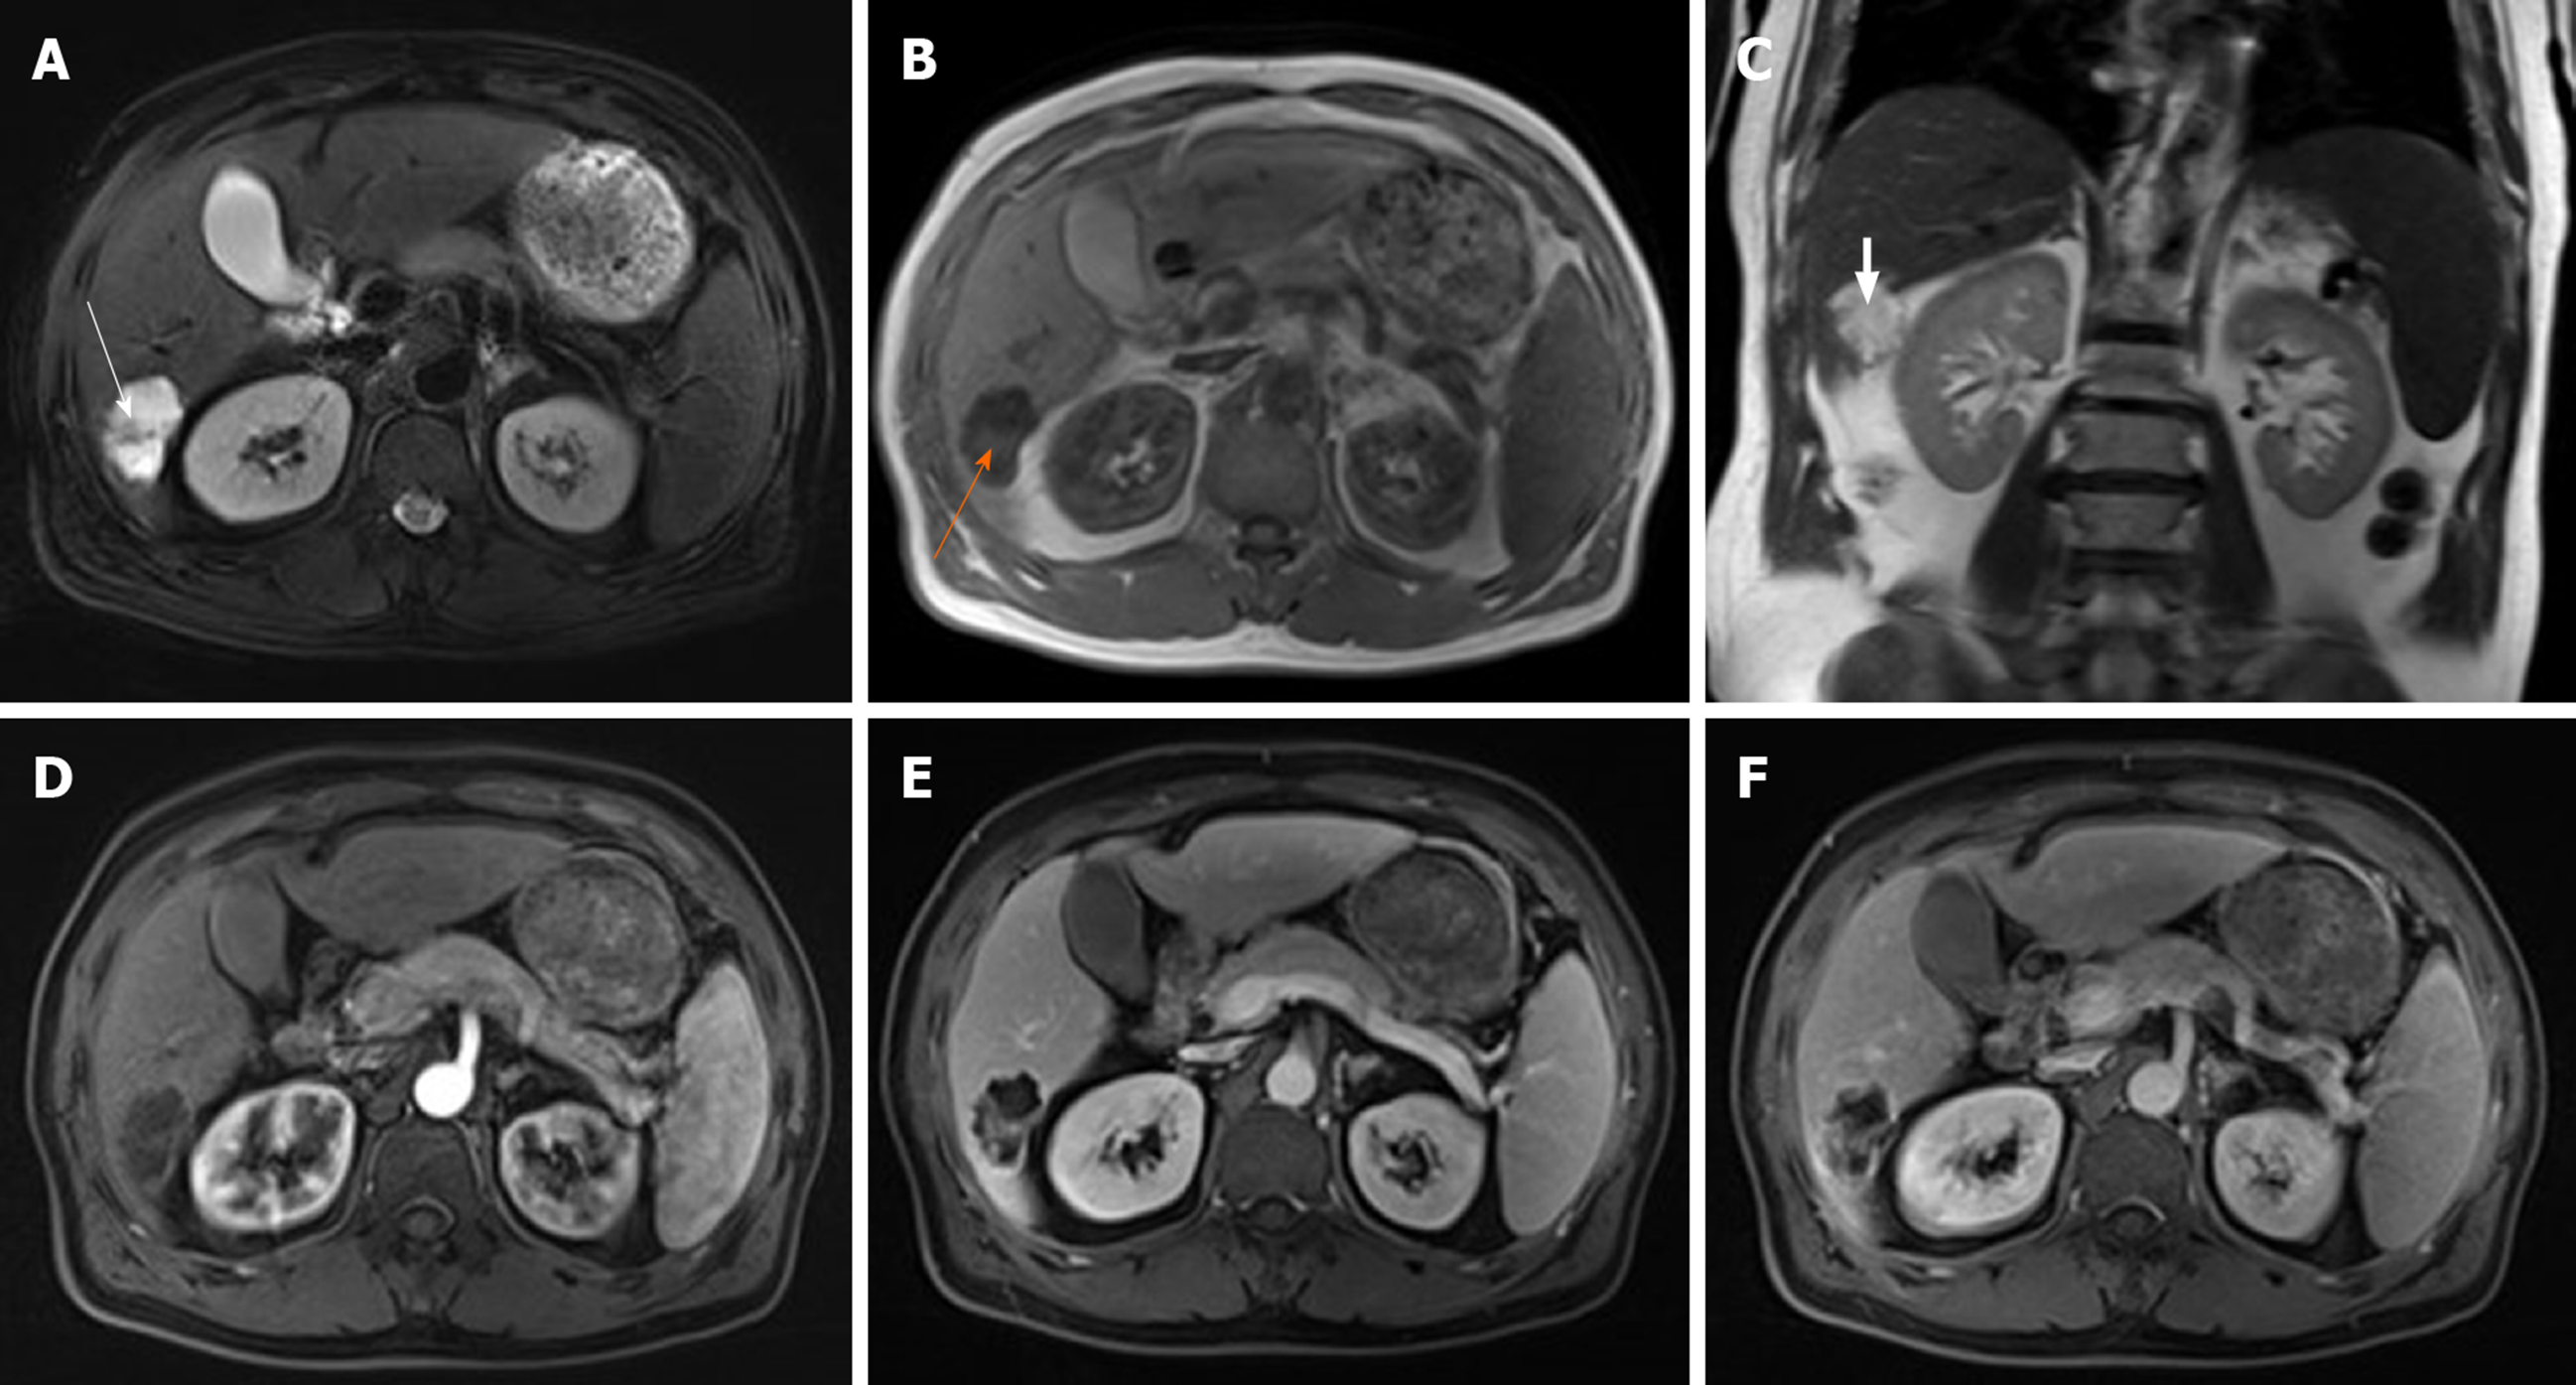
Figure 1 Magnetic resonance imaging at primary clinic visit.
A: A magnetic resonance (MR) T2 weighted image (T2WI) axis image showing lobular masses in the posterior lower lobe of the right lobe of the liver with clear borders, a high T2WI signal, intratumor separation with low signal and peripheral capsule with low signal (white arrow); B: An MR T1WI axis image showing the lesion was presented as low signal in T1WI with signals of patches and other (orange arrow); C: A coronal image of T2WI showing that the lesion protruded toward the lower edge of the liver (white arrowhead); D: MR enhanced arterial phase showed that the edge of the lesion and its internal separation are slightly enhanced; E: MR enhanced portal venous phase showed that the edge of the lesion and its internal separation are enhanced; F: MR enhanced delayed stage showed that the edge of the lesion and its internal separation are continually enhanced.
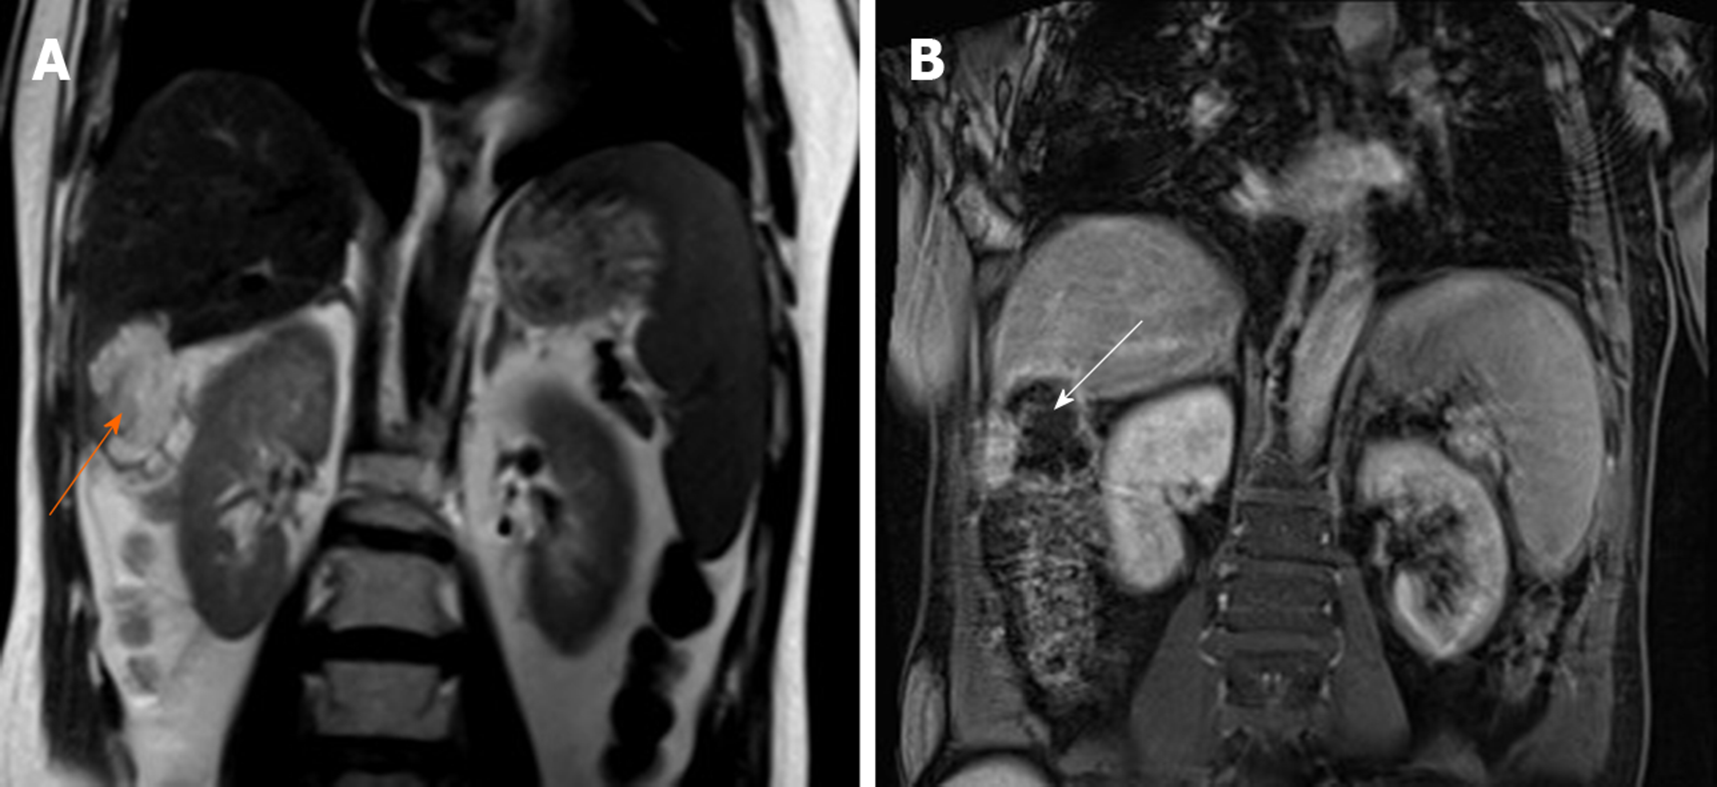
Figure 2 Magnetic resonance imaging after 3 mo.
A: A magnetic resonance T2 weighted image coronal image showed that the lesion was larger than before, and the border between the lesion and colonic liver curvature was unclear (orange arrow); B: A magnetic resonance T1 weight image coronal image (white arrow).
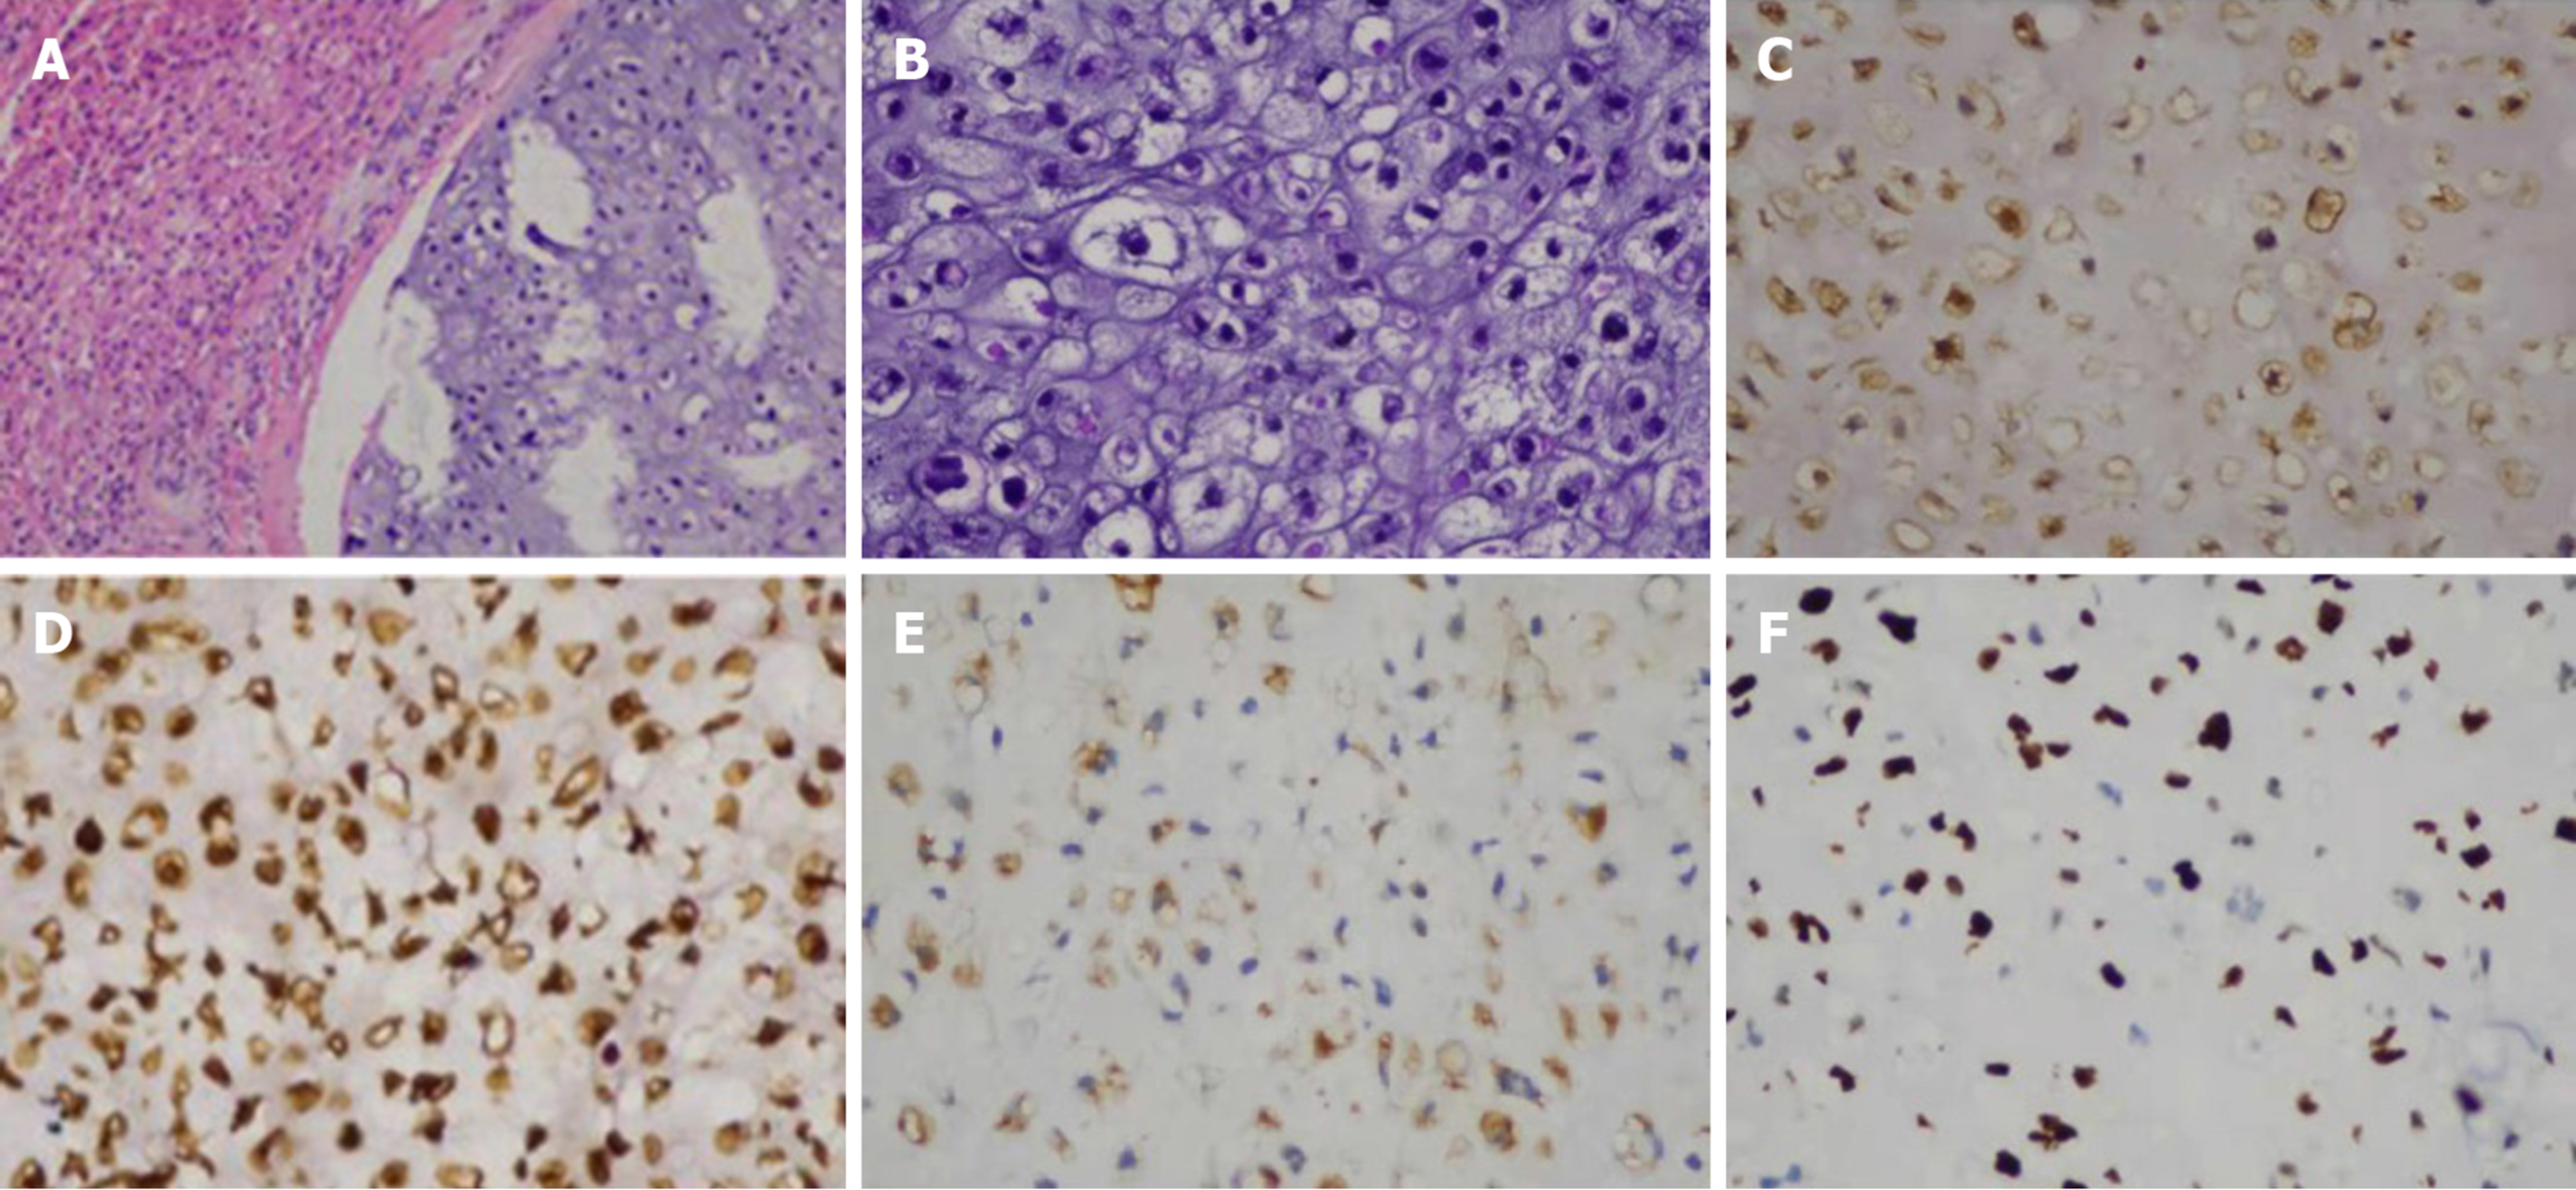
Figure 3 Histopathological evaluation.
A: Hematoxylin and eosin staining showed that tumor cells were unevenly distributed with cartilage pits, and the tumor was infiltrating and growing into surrounding liver tissue (magnifications 100 ×); B: Hematoxylin and eosin staining showed tumor cells with abnormal nuclei that were mostly mononuclear though occasionally binuclear (magnifications 200 ×); C: Tumor CK protein positive; D: Tumor vimentin protein positive; E: Tumor S-100 protein positive; F: Tumor Ki-67 immunostaining with 60% Ki-67 positive cells. (C-F immunohistochemistry, magnification 200 ×).
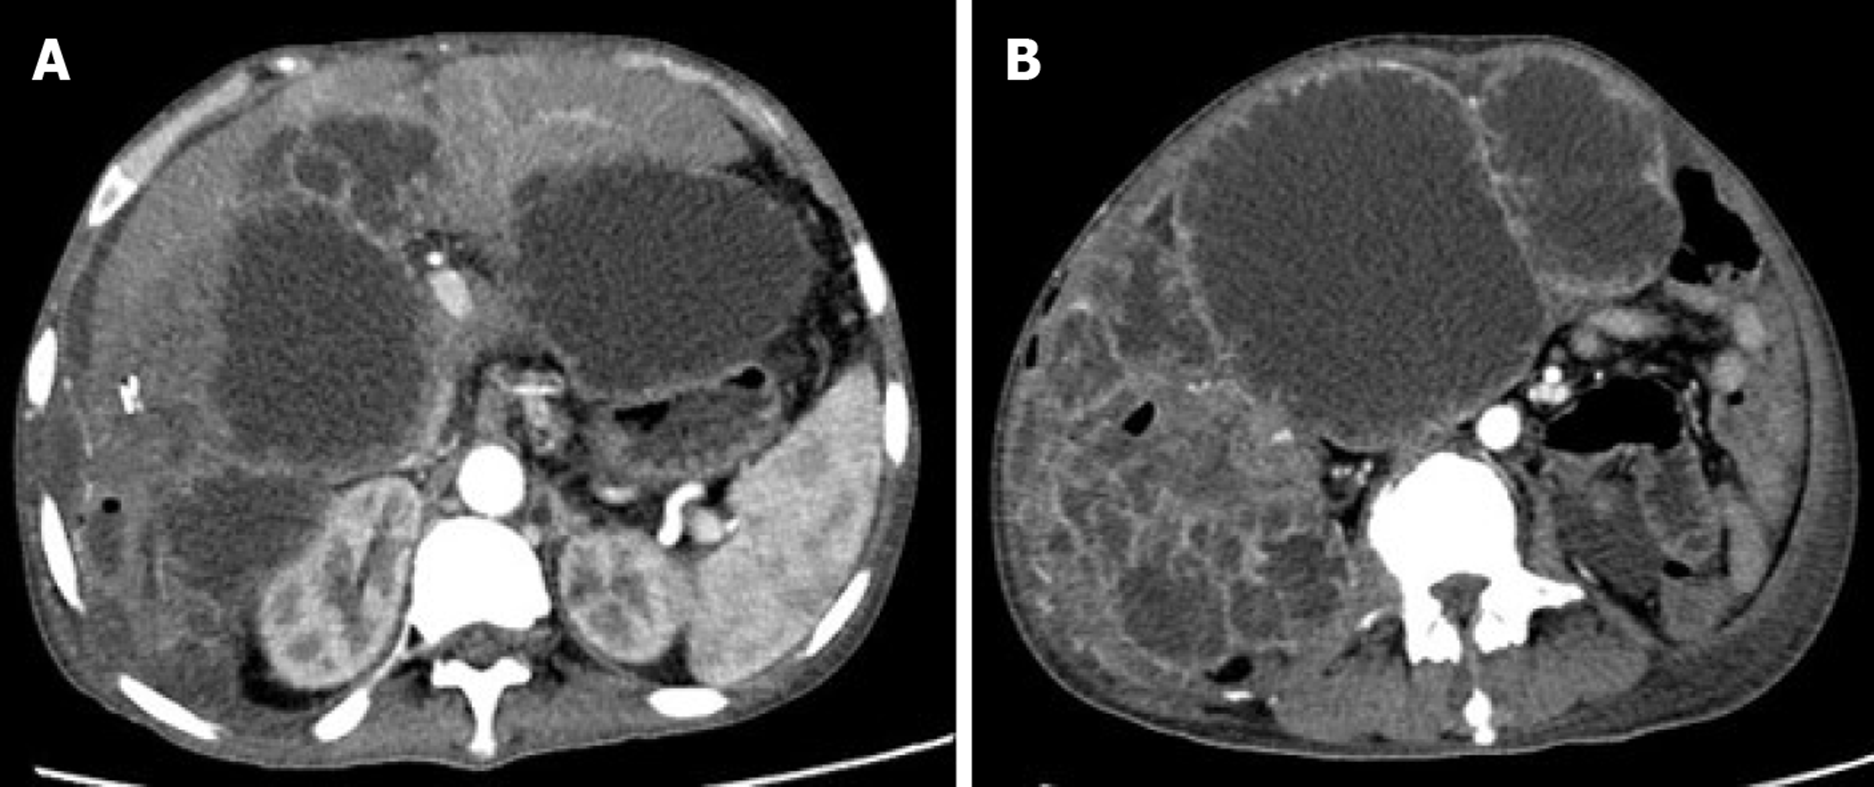
Figure 4 Magnetic resonance imaging at month 8 after the second surgery.
A: Computed tomography enhanced arterial phase image showing intrahepatic and abdominal metastases; B: Computed tomography enhanced arterial phase image showing metastatic lesions presenting as multiple cystic masses with enhanced edges.
- Citation: Liu ZY, Jin XM, Yan GH, Jin GY. Primary chondrosarcoma of the liver: A case report. World J Clin Cases 2020; 8(20): 5042-5048
- URL: https://www.wjgnet.com/2307-8960/full/v8/i20/5042.htm
- DOI: https://dx.doi.org/10.12998/wjcc.v8.i20.5042


