Copyright
©The Author(s) 2020.
World J Clin Cases. Oct 26, 2020; 8(20): 5036-5041
Published online Oct 26, 2020. doi: 10.12998/wjcc.v8.i20.5036
Published online Oct 26, 2020. doi: 10.12998/wjcc.v8.i20.5036
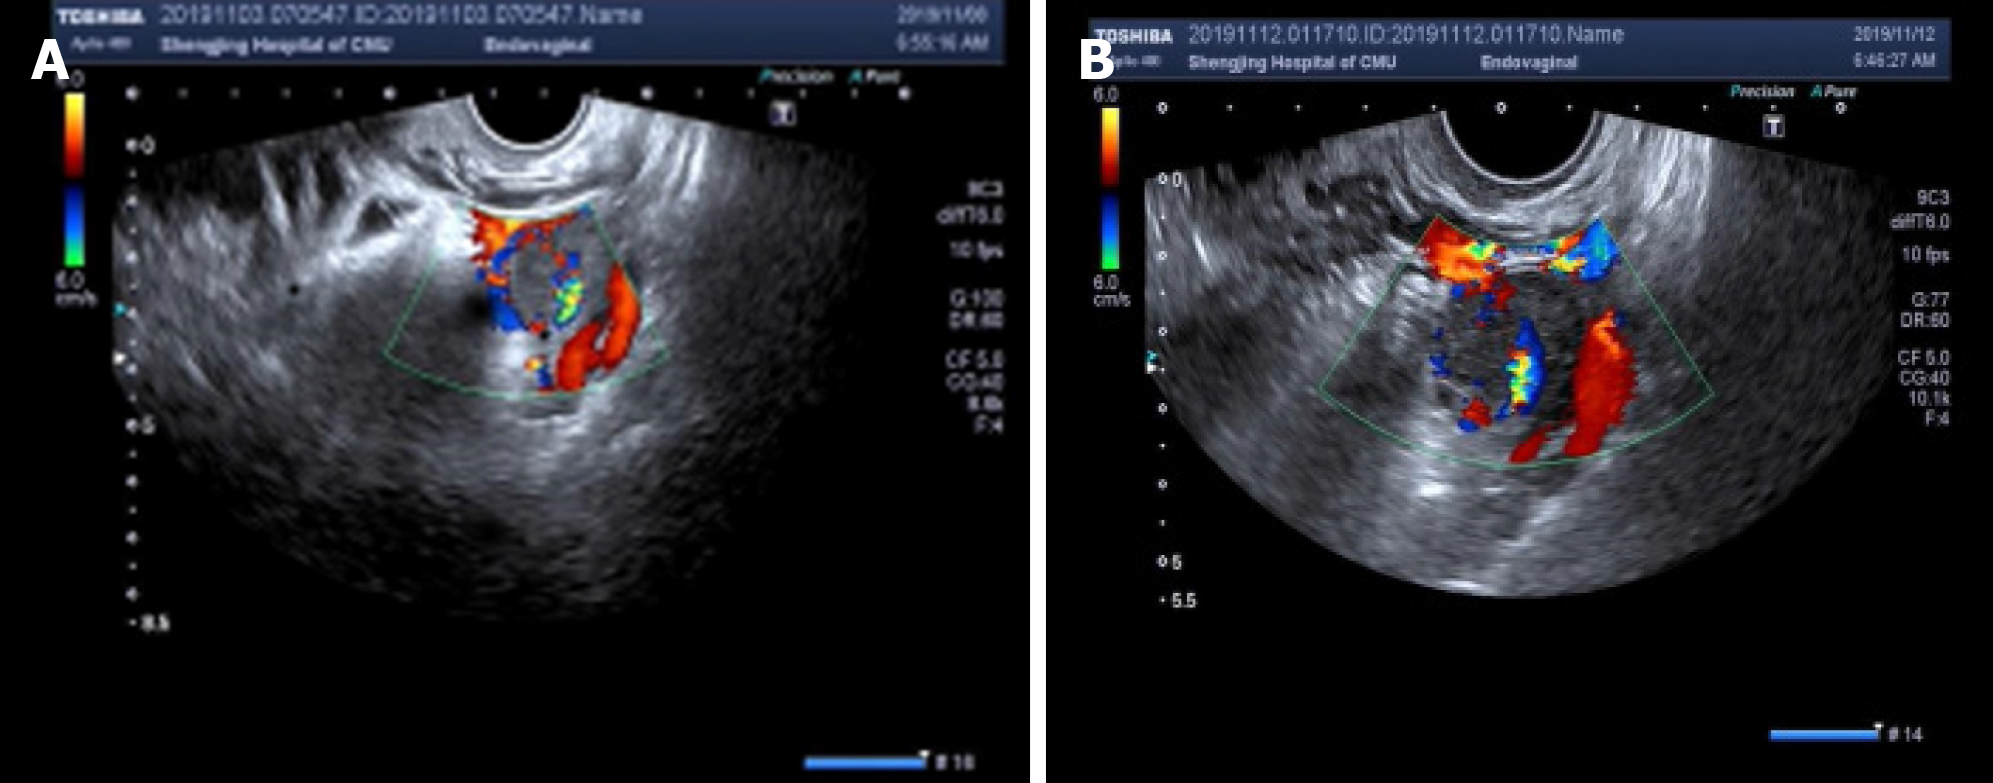
Figure 1 Ultrasonographic image of the lesion.
The uterine cavity and cervical canal were empty. Ultrasonography revealed that the mass was heterogeneous with a mixture of cystic and solid echogenicity. A: The left adnexa mass on the day of hospital admission; B: The left adnexa mass six days after admission.
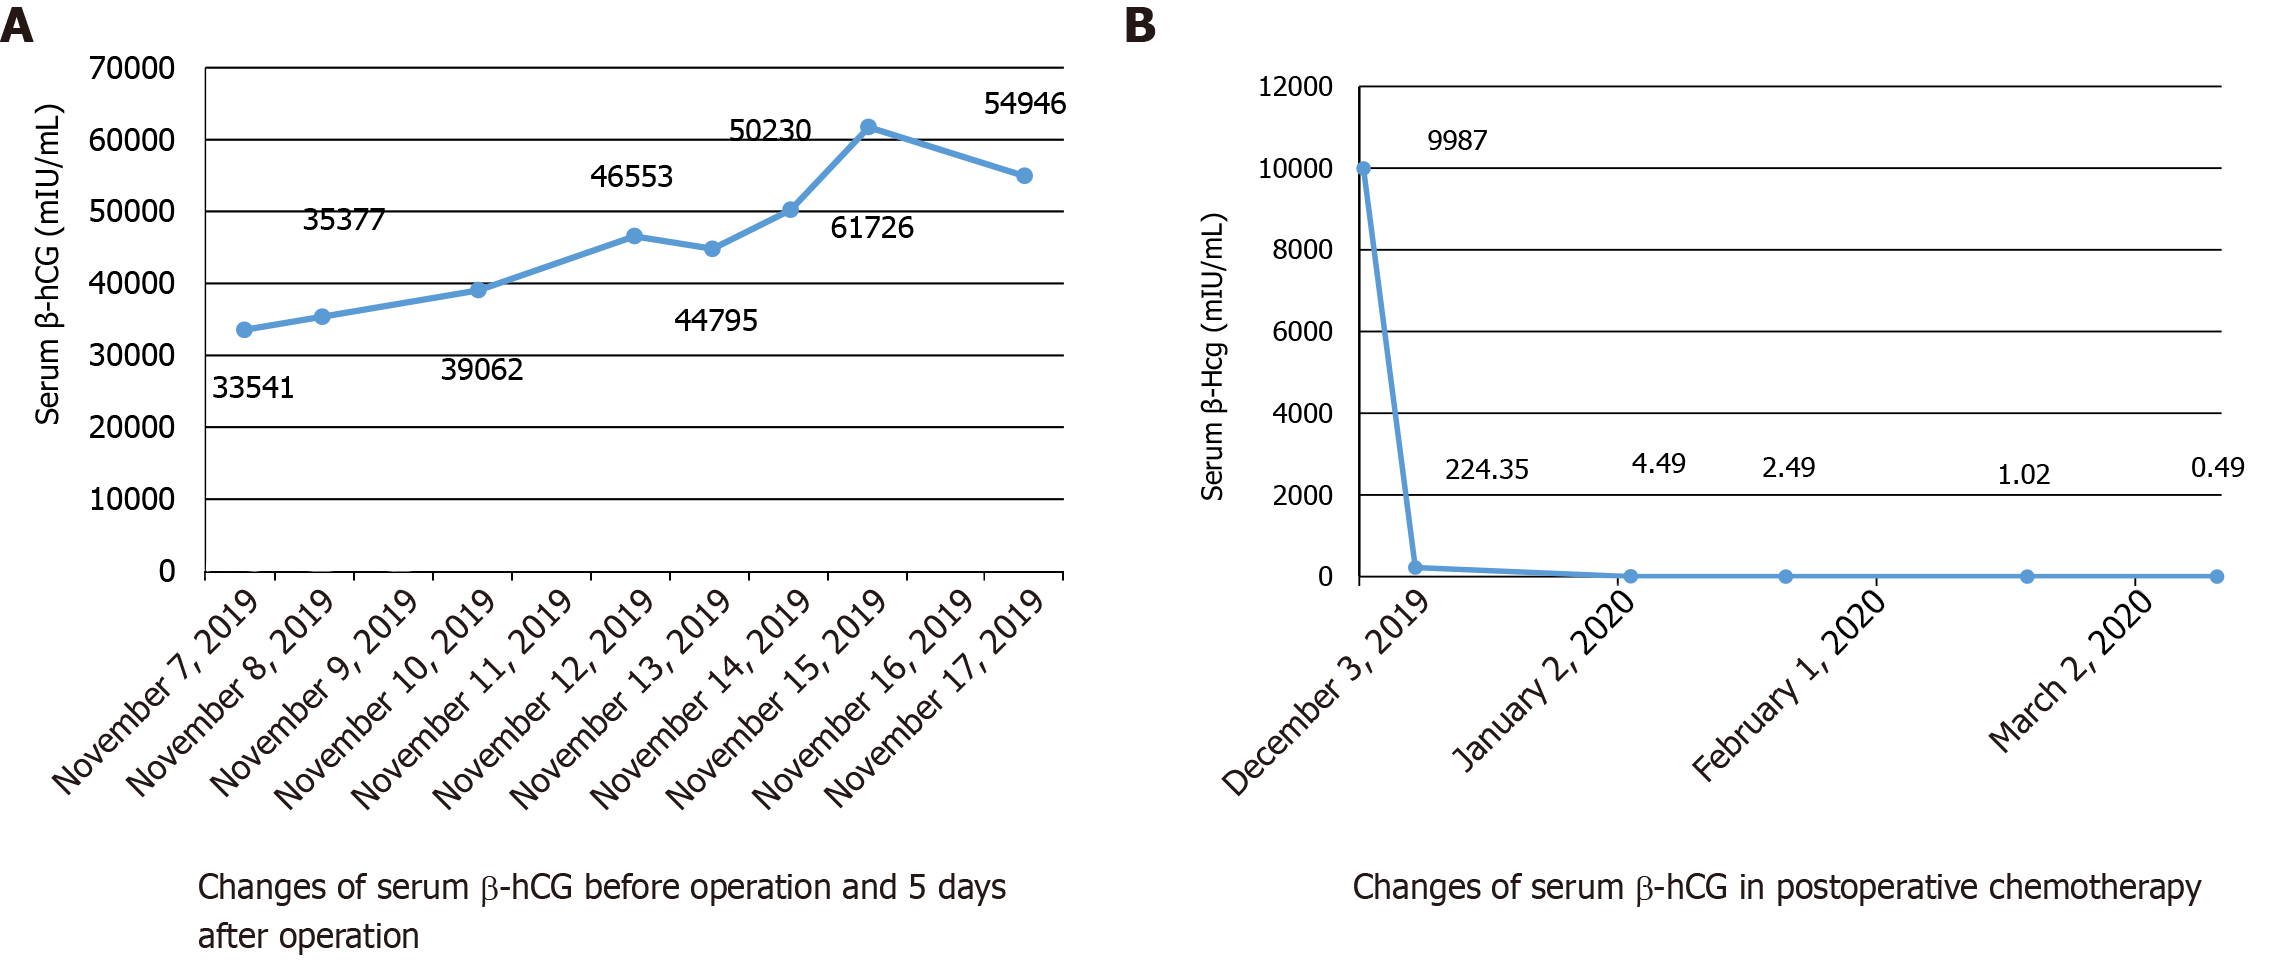
Figure 2 Patient serum β-human chorionic gonadotropin levels.
A: Increasing levels of serum β-human chorionic gonadotropin (β-hCG) levels before surgery; B: β-hCG dropped to normal levels after cycle 2 of chemotherapy. β-hCG: β-human chorionic gonadotropin.
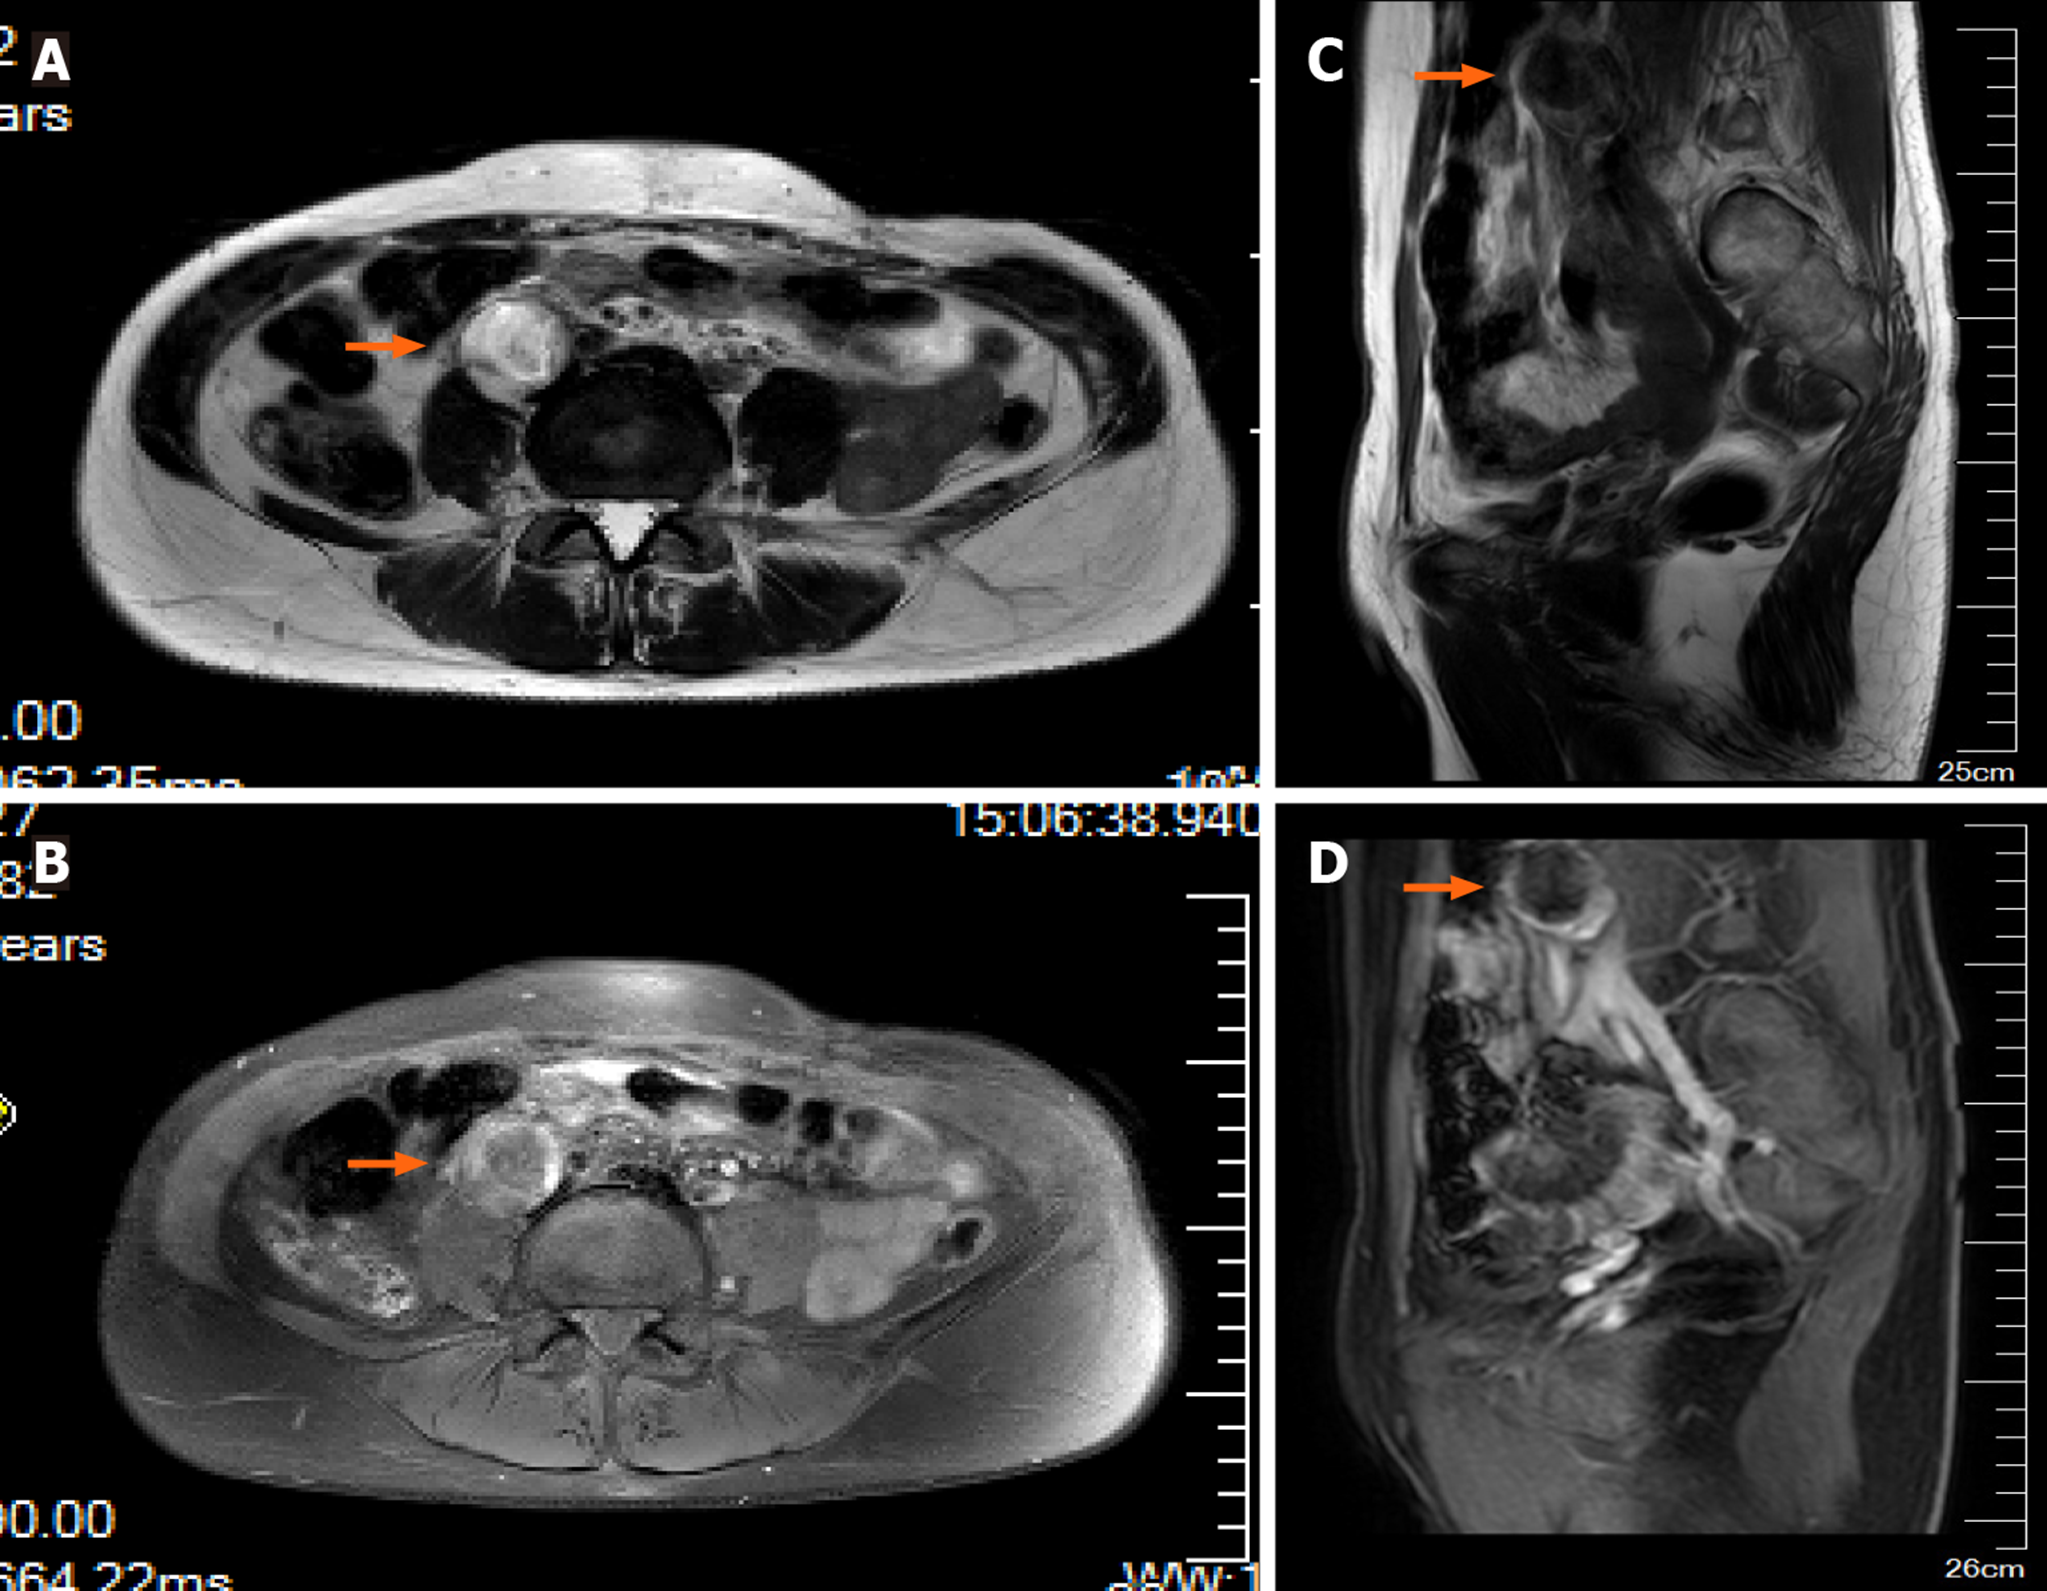
Figure 3 Magnetic resonance imaging of the lesion.
Low signal intensity on T2-weighted image (T2WI) (A) and high signal intensity on T1-weighted image (T1WI) (B); C: T2WI, coronal plane; D: T1WI, coronal plane. Orange arrows indicate the lesion.
- Citation: Pang L, Ma XX. Choriocarcinoma with lumbar muscle metastases: A case report. World J Clin Cases 2020; 8(20): 5036-5041
- URL: https://www.wjgnet.com/2307-8960/full/v8/i20/5036.htm
- DOI: https://dx.doi.org/10.12998/wjcc.v8.i20.5036


