Copyright
©The Author(s) 2020.
World J Clin Cases. Oct 26, 2020; 8(20): 4883-4894
Published online Oct 26, 2020. doi: 10.12998/wjcc.v8.i20.4883
Published online Oct 26, 2020. doi: 10.12998/wjcc.v8.i20.4883
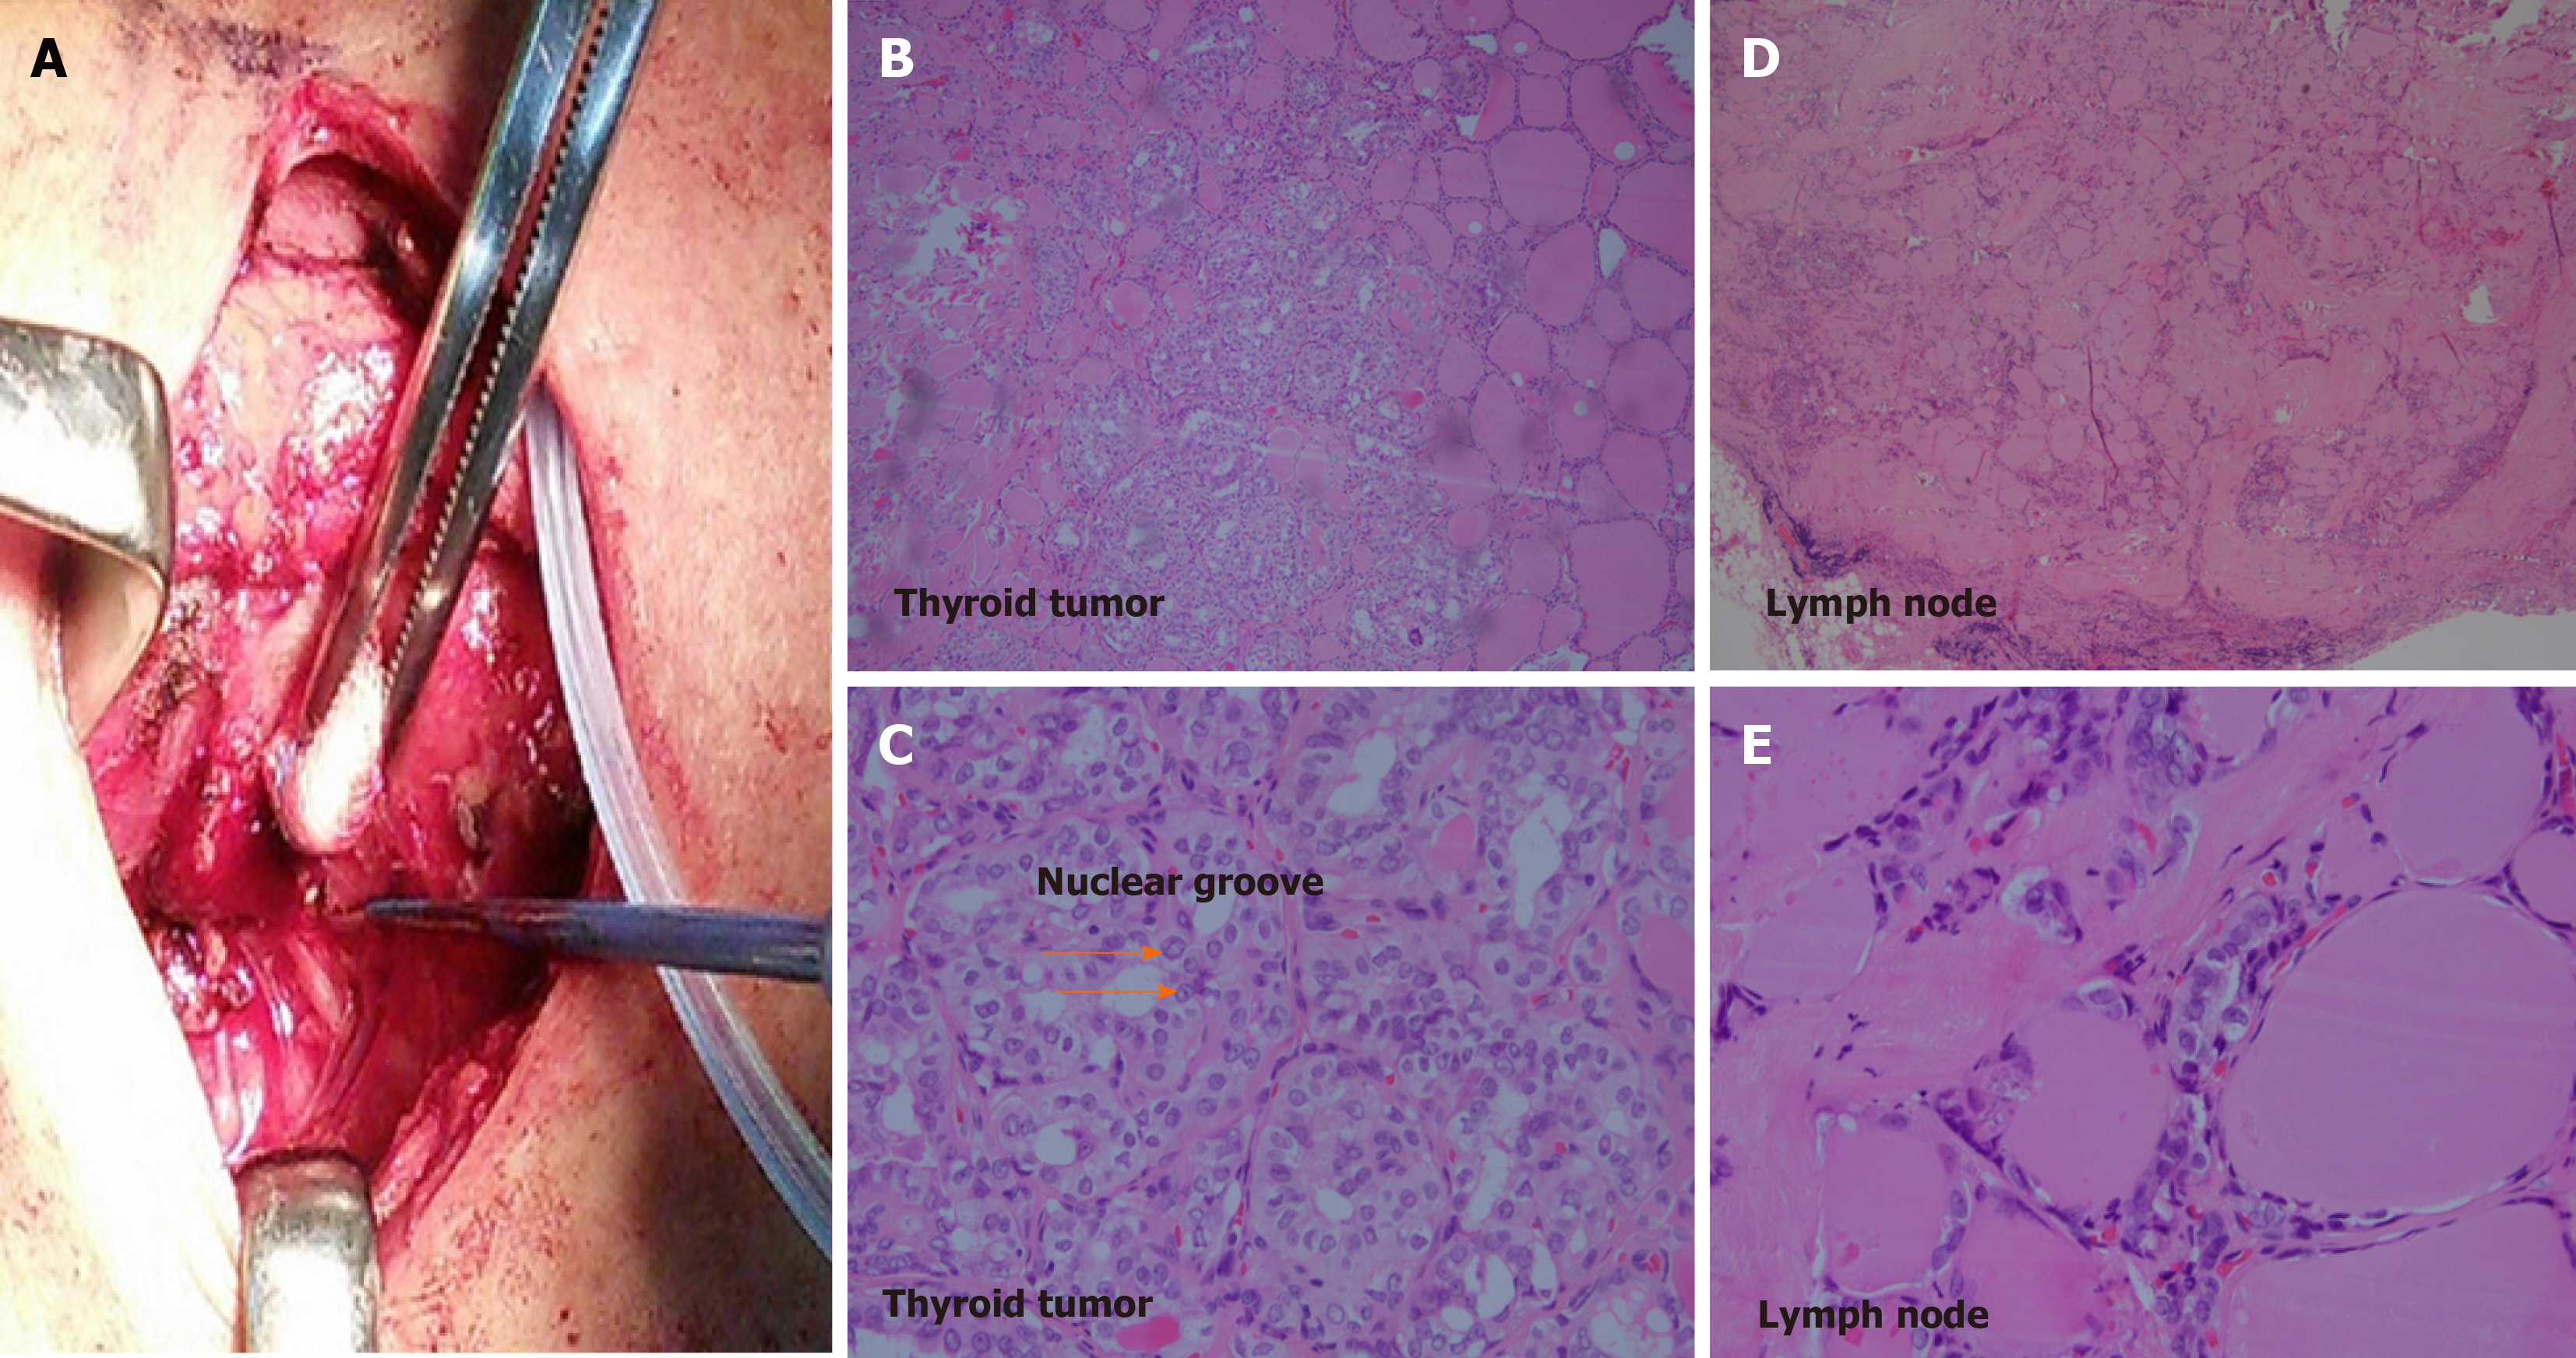
Figure 1 Surgical illustration and hematoxylin and eosin staining results.
A: Bilateral thyroid glands were totally removed; B: The tumor cells were large and seen with round or polygonal vesicular nuclei with ground glass change; C: Intra-nuclear inclusion and nuclear grooves were observed; D and E: Lymph nodes were identified as metastatic papillary carcinoma.
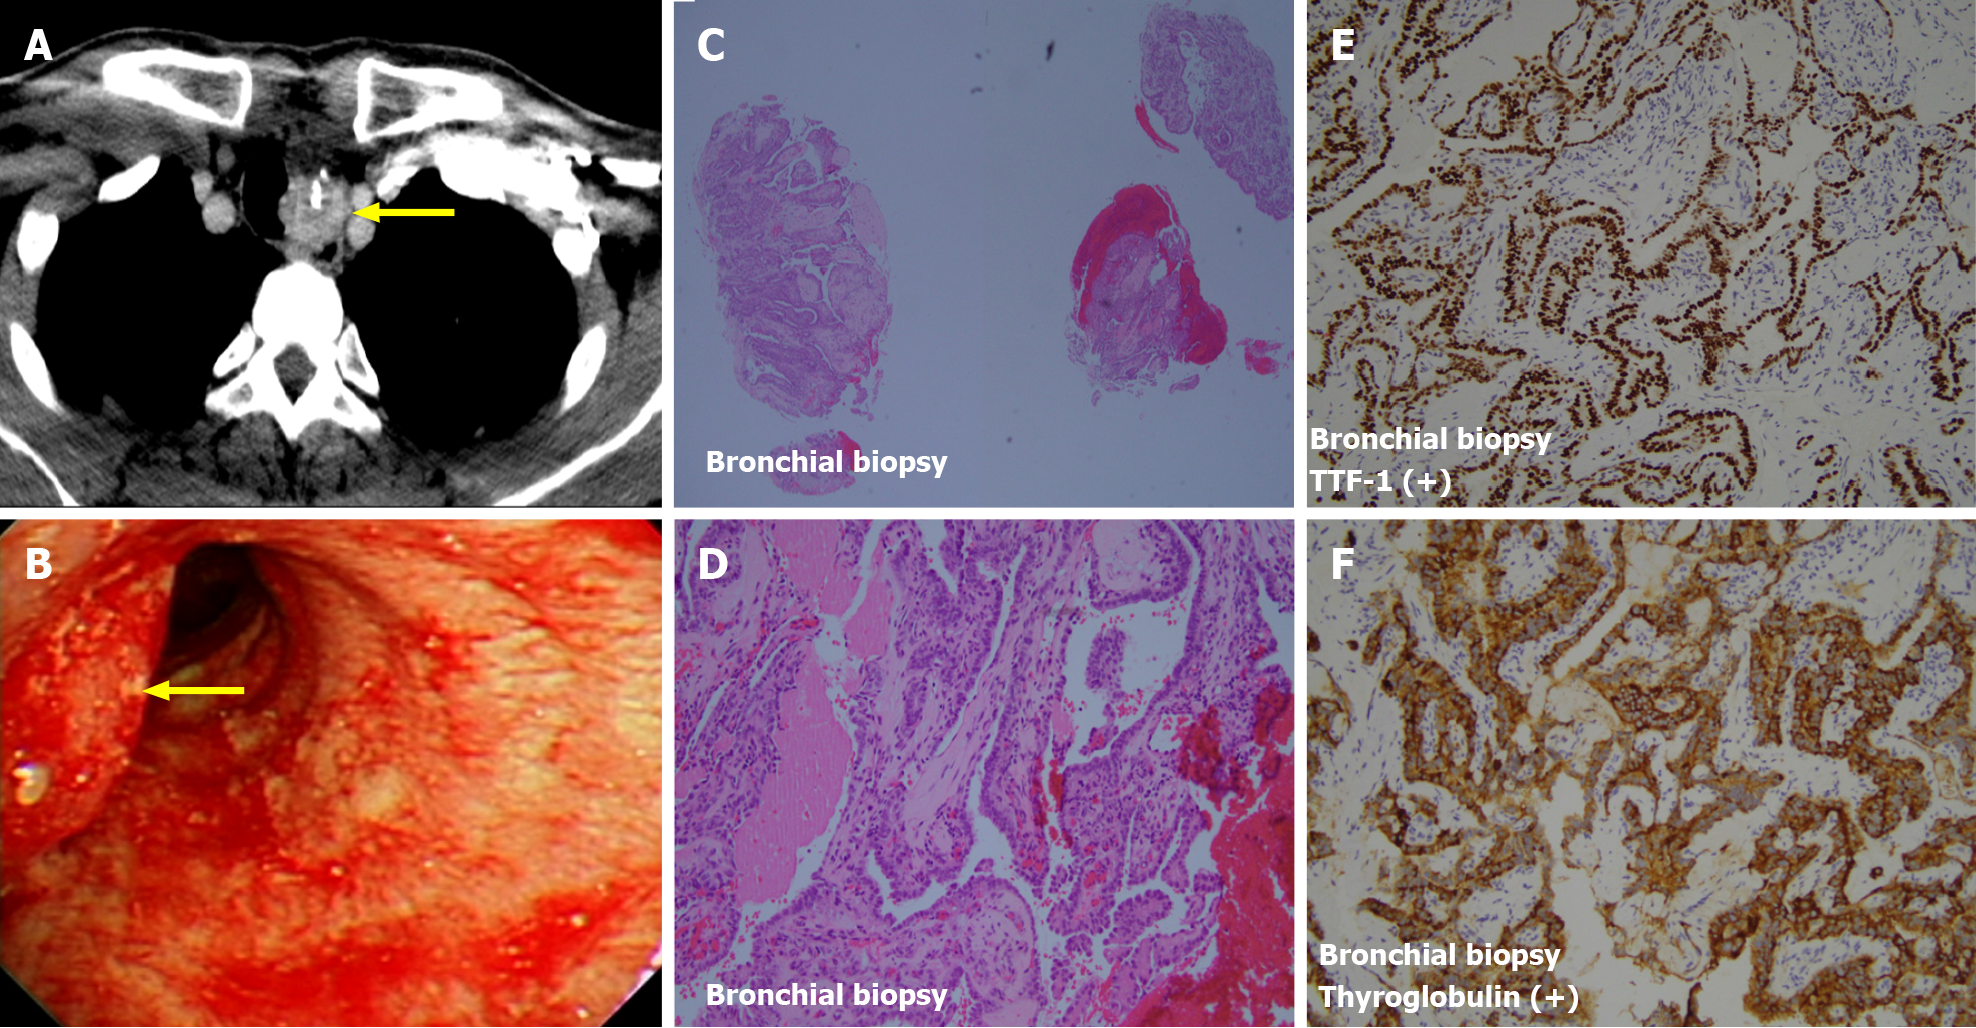
Figure 2 Computed tomography images and staining results.
A and B: Left para-tracheal lesion was first observed on computed tomography (A) and directly visualized under bronchoscopy (B); C and D: Biopsy was conducted, and it showed pictures of neoplastic cells growth in papillary pattern with atypical large vesicular and pale nuclei with obvious nuclear groove; E and F: It was stained with TTF-1 100% (E) and thyroglobulin 100% (F).
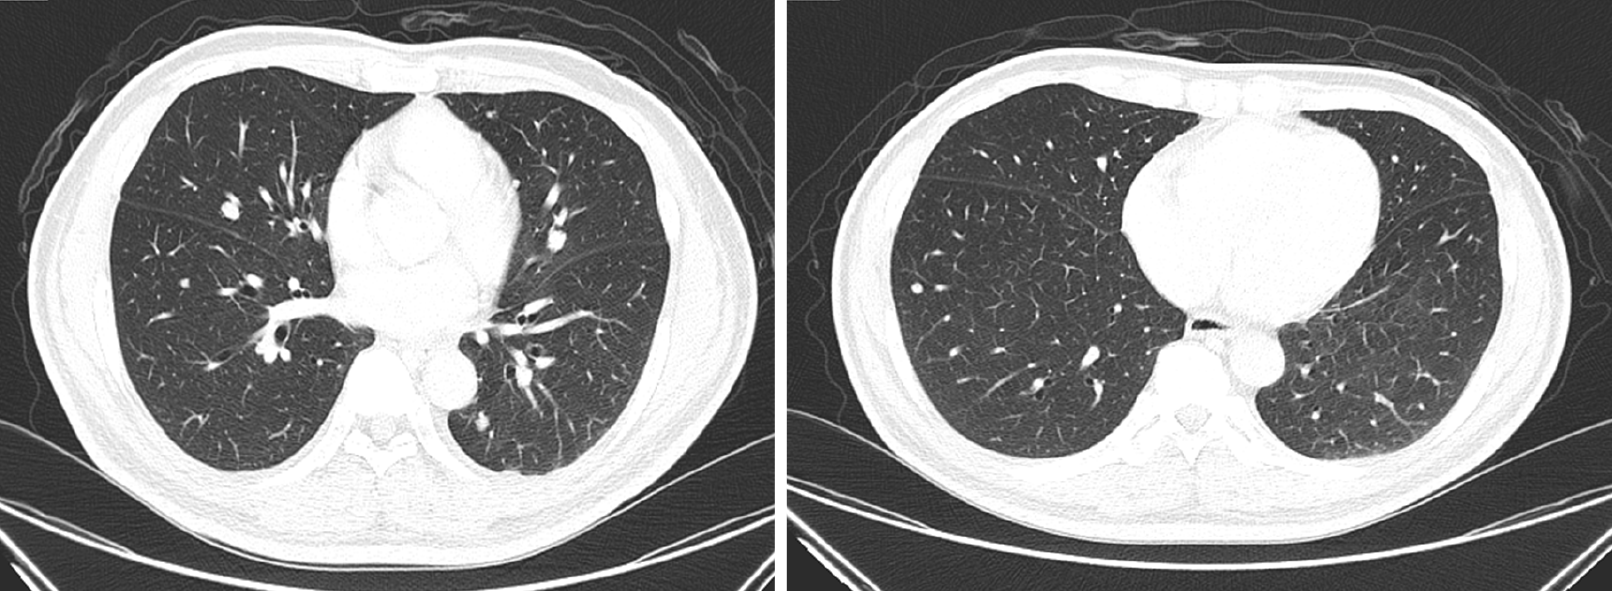
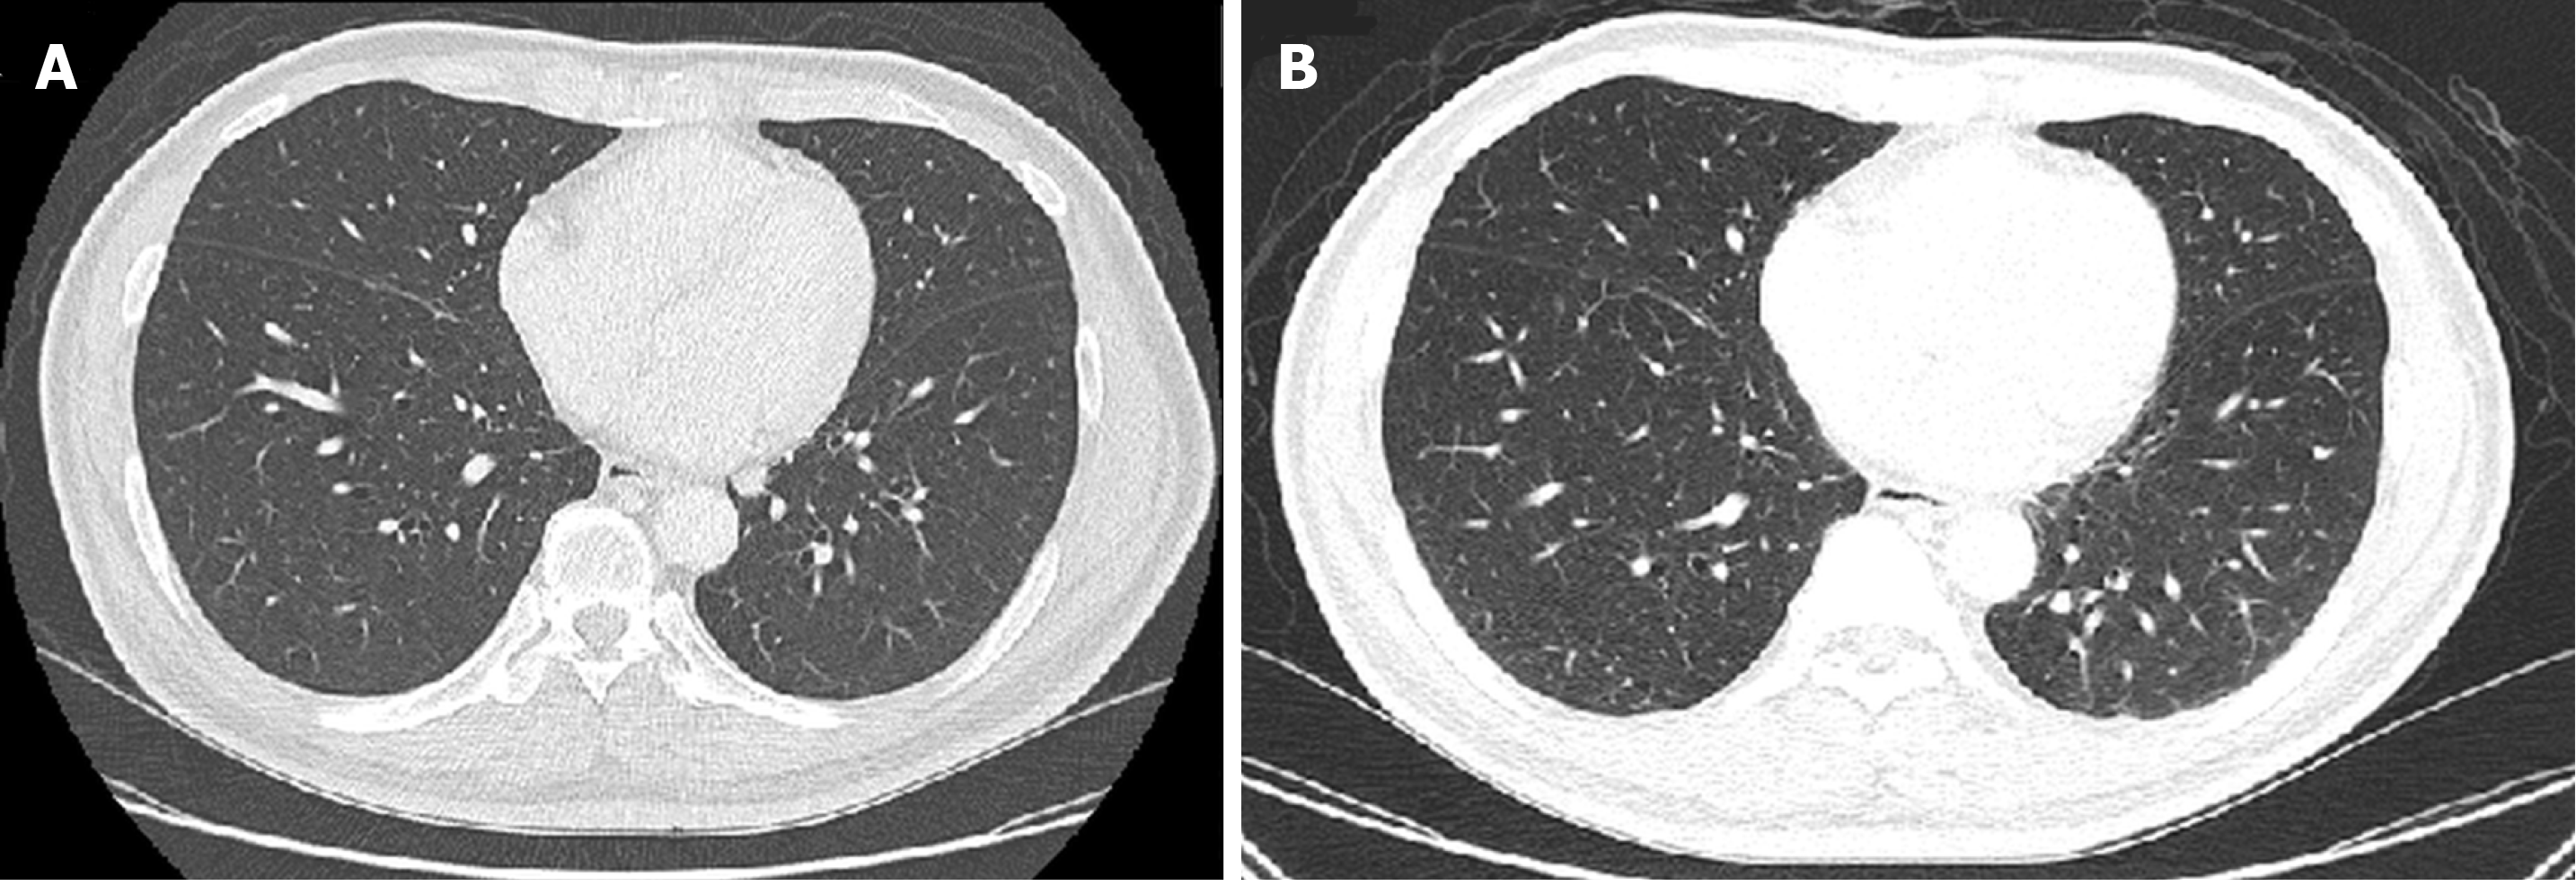
Figure 3 Computed tomography images following biopsy from bronchoscopy.
Computed tomography revealed diffusion in metastatic lesions at both lobes.
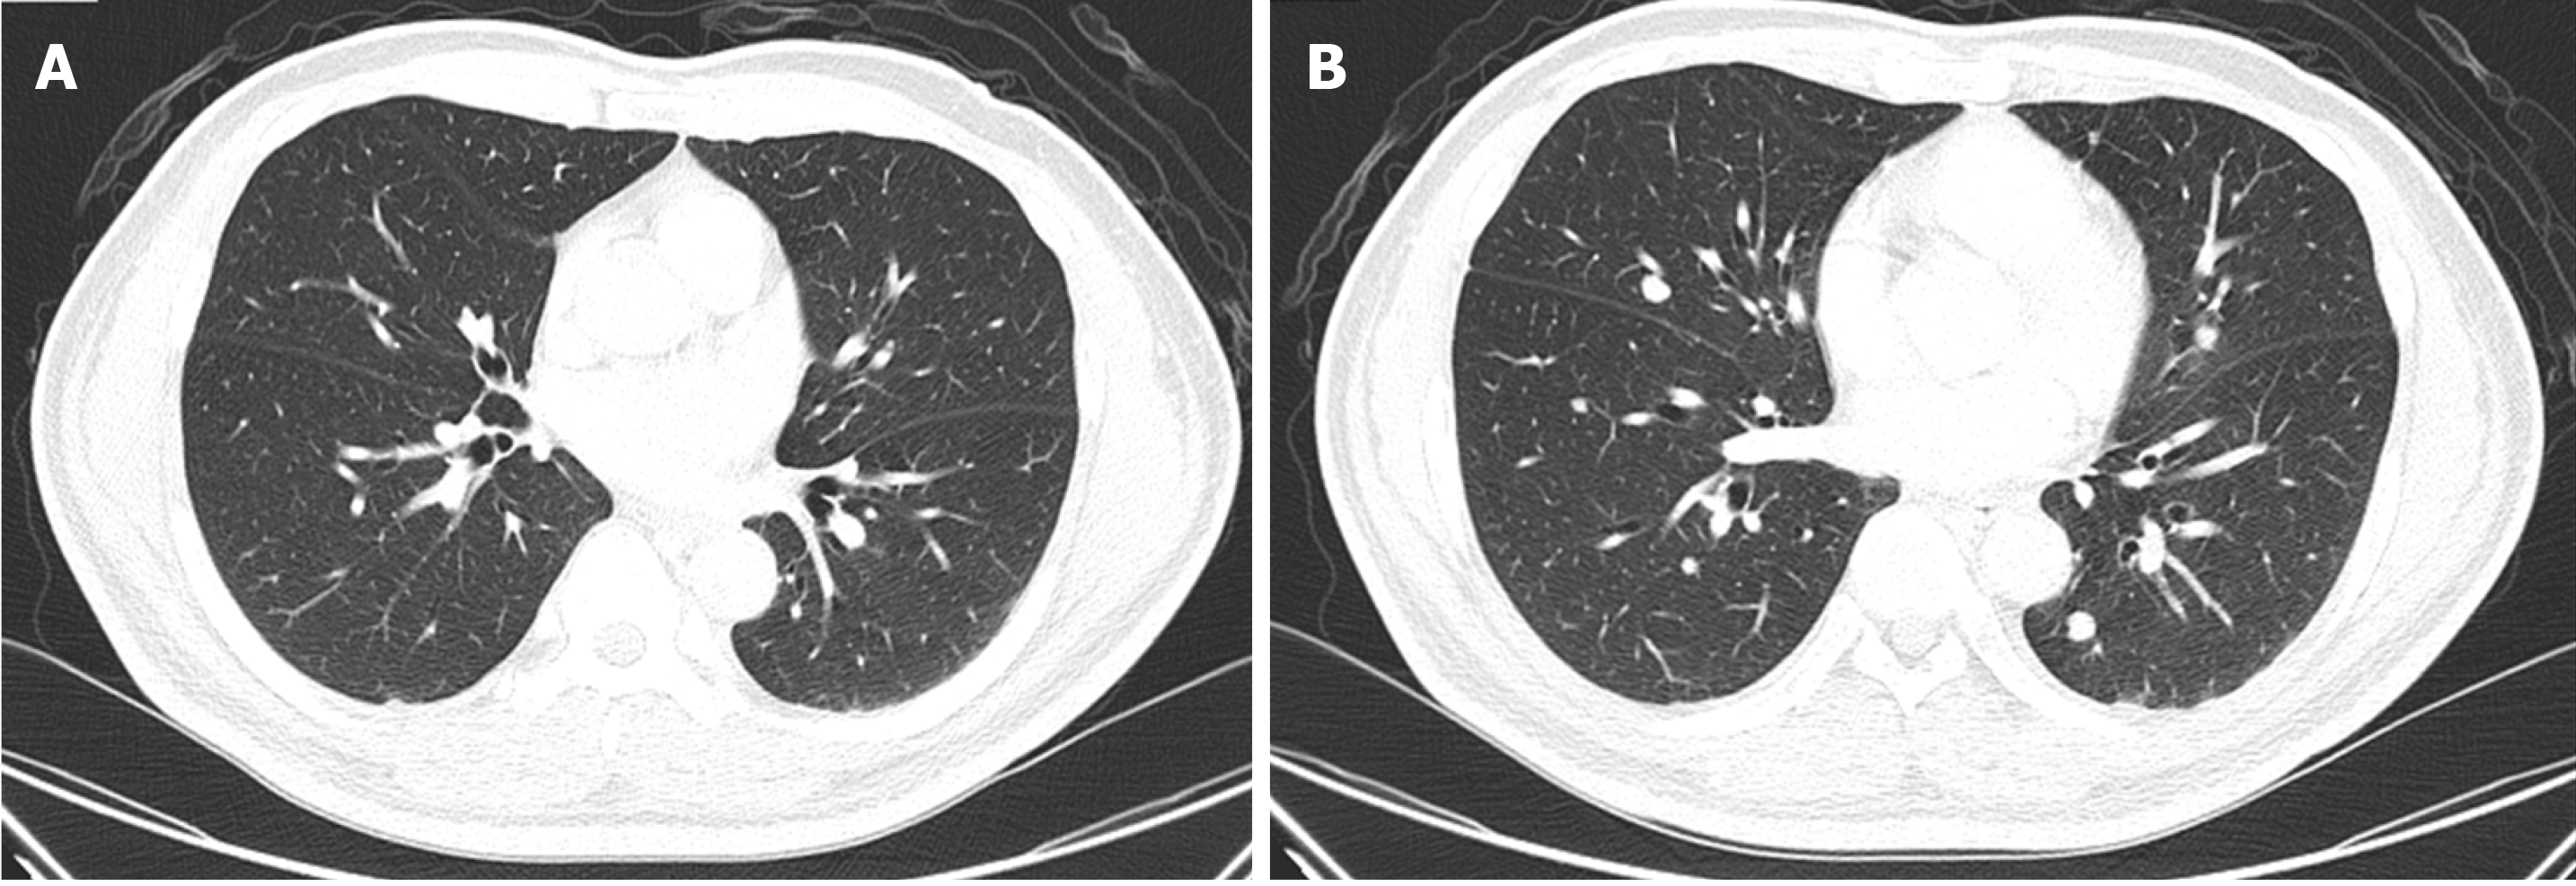
Figure 4 Computed tomography images showing limited improvement with 1-mo lenvatinib (20 mg/d).
A: Before lenvatinib; B: After lenvatinib.
Figure 5 Computed tomography images showing limited improvement after tapering lenvatinib to 10 mg/d.
A: Lenvatinib, 20 mg/d; B: Lenvatinib, 10 mg/d.
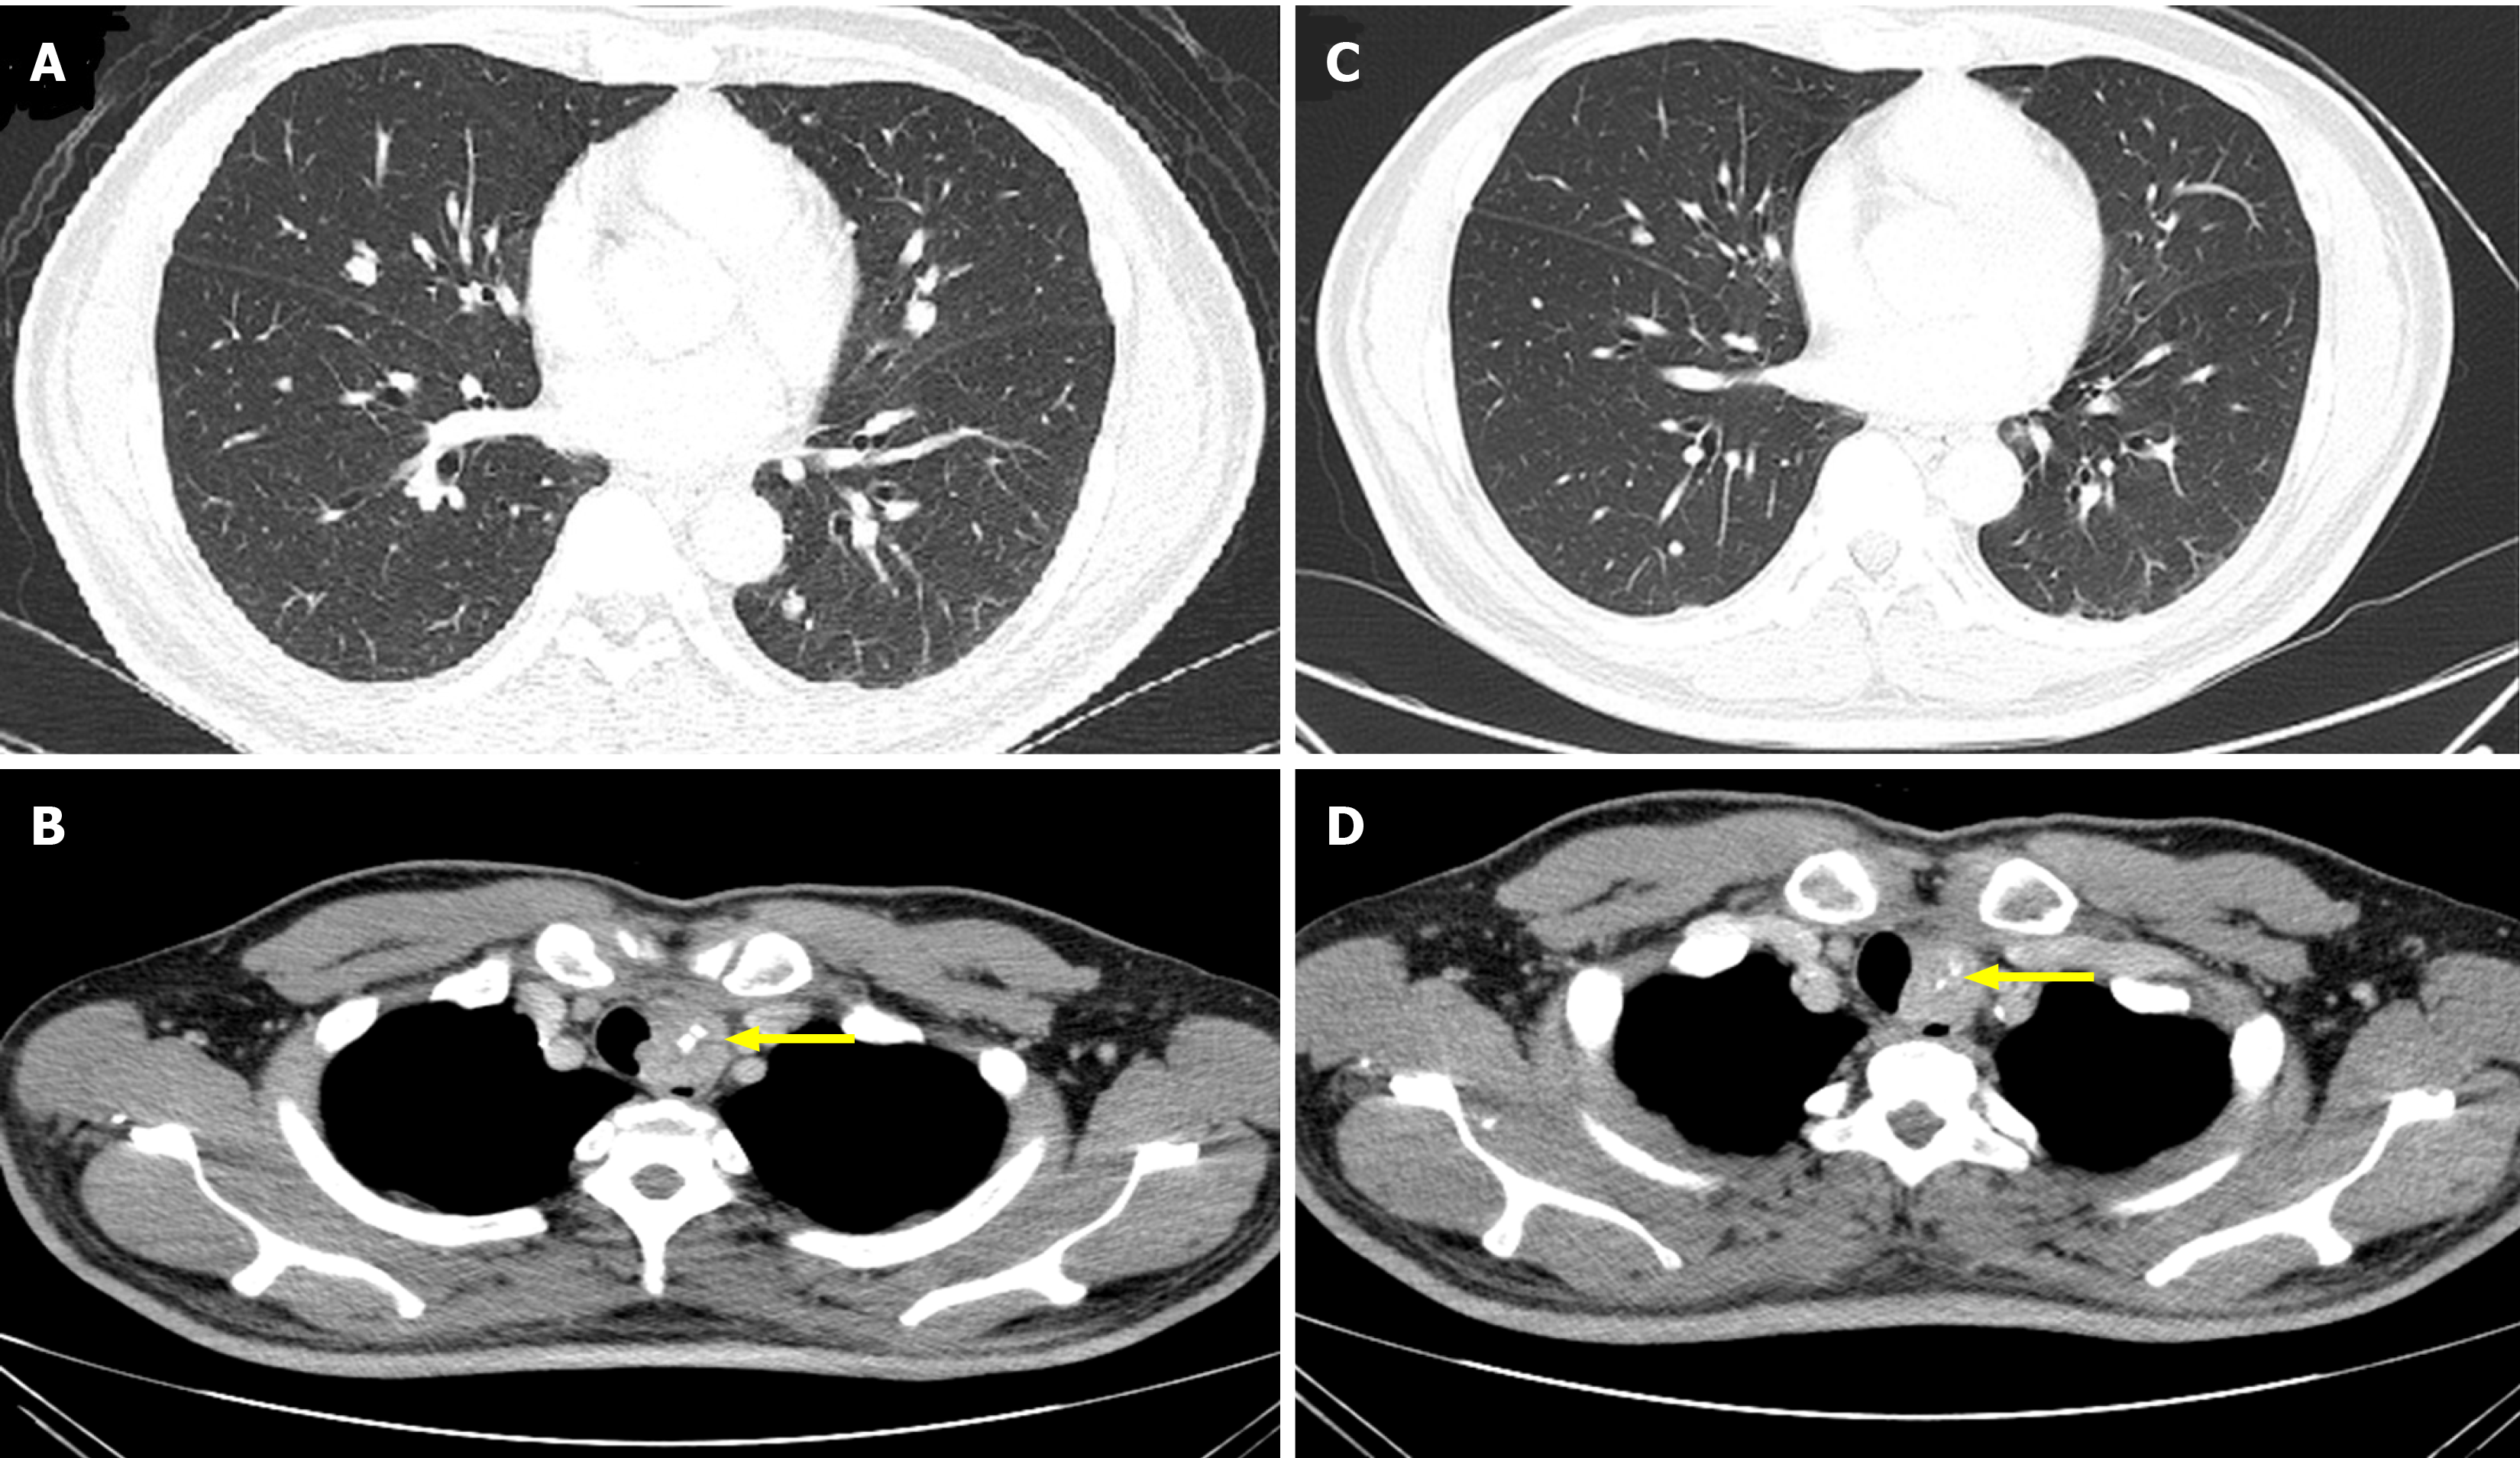
Figure 6 Computed tomography images showing mild improvement of the metastatic lesions and mild shrinkage of the para-tracheal tumor after 5-mo sorafenib (400 mg/d), compared to that with Lenvatinib (10 mg/d).
A and B: Lenvatinib, 10 mg/d; C and D: Sorafenib, 400 mg/d.
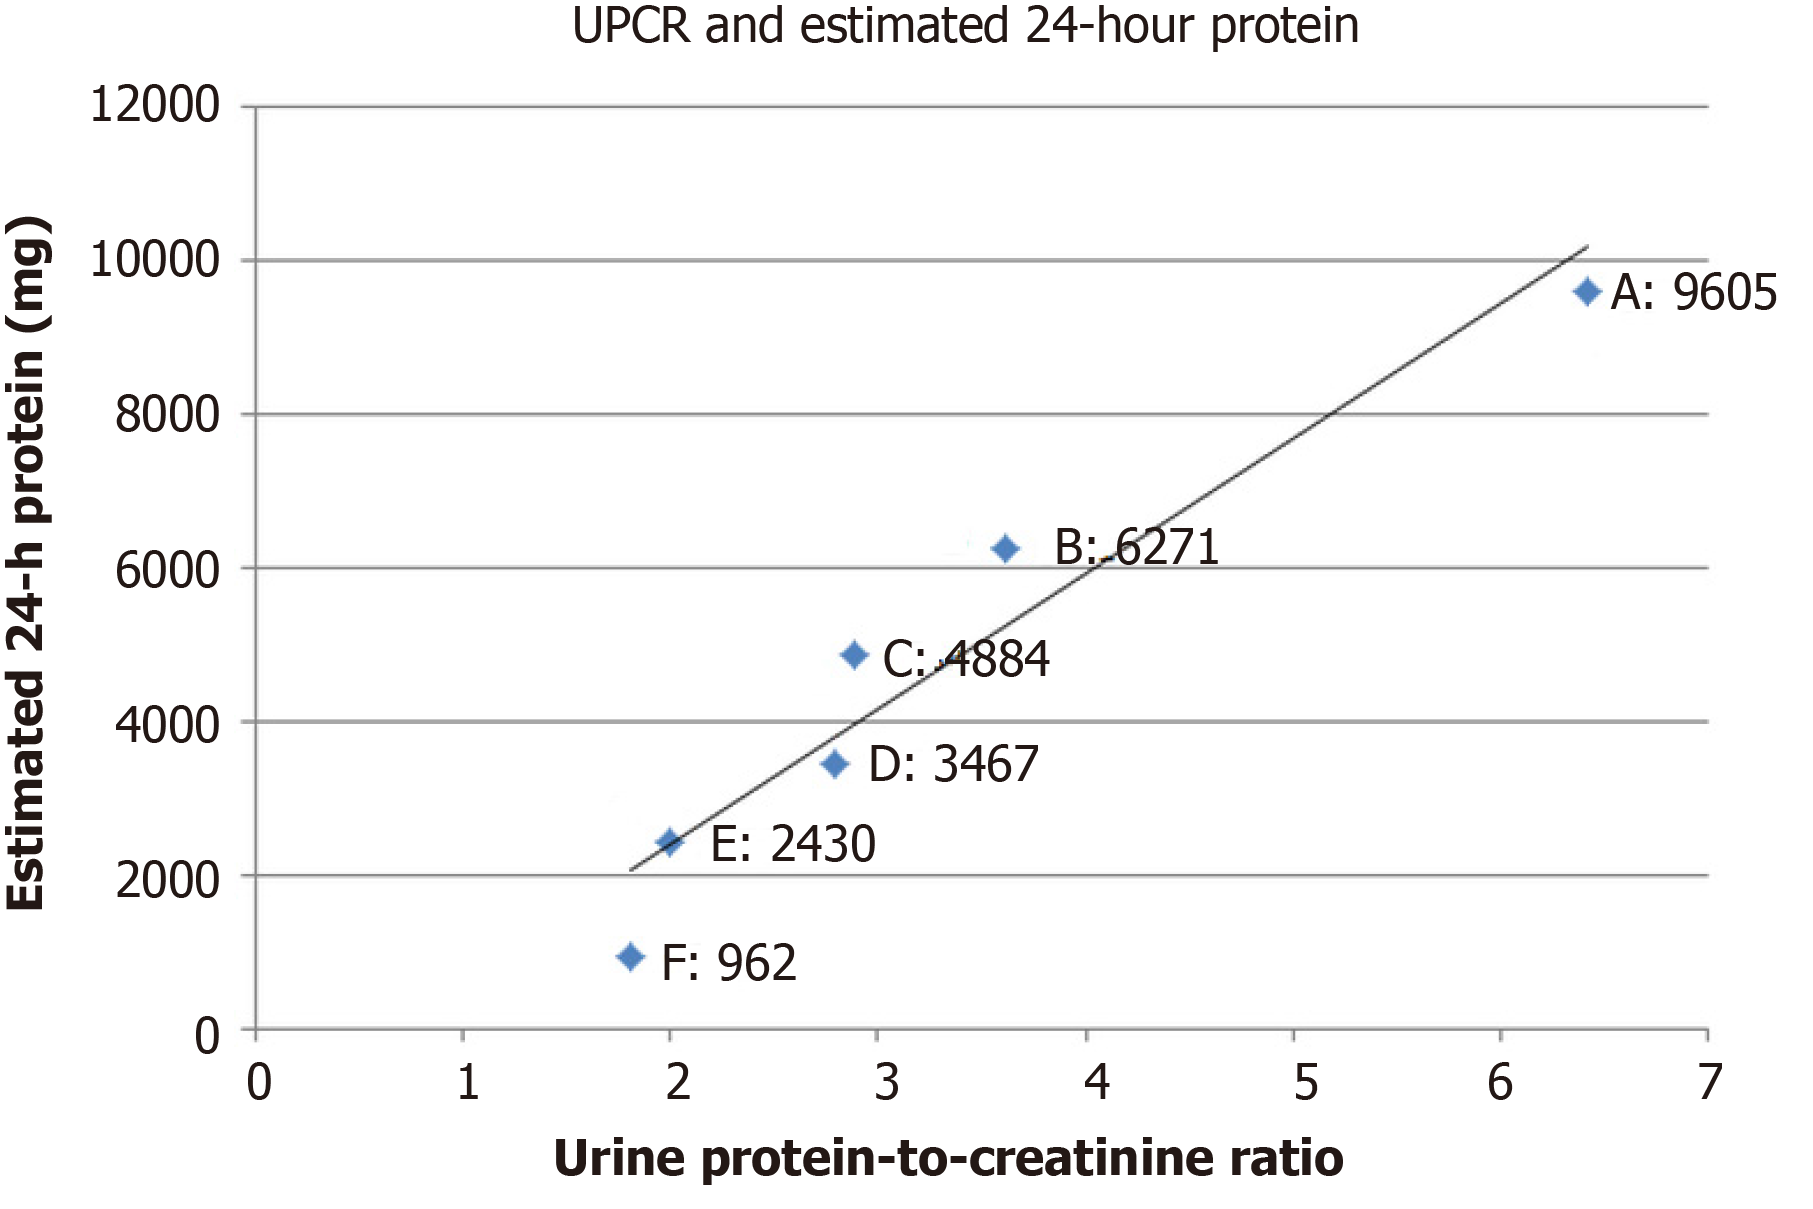
Figure 7 The serial changes of urine protein-to-creatinine ratio and estimated 24-h urine protein is pictured.
A: Lenvatinib, 10 mg/d; B: The first day of sorafenib; C: The second month of sorafenib; D: The third month of sorafenib; E: The fourth month of sorafenib; F: The fifth month of sorafenib; Proteinuria was changed from grade three to grade one after 5-mo sorafenib, and the level of estimated 24-h urine protein is strongly associated with urine protein-to-creatinine ratio (Pearson correlation coefficient: 0.96; R2: 0.92; adjusted R2: 0.91).
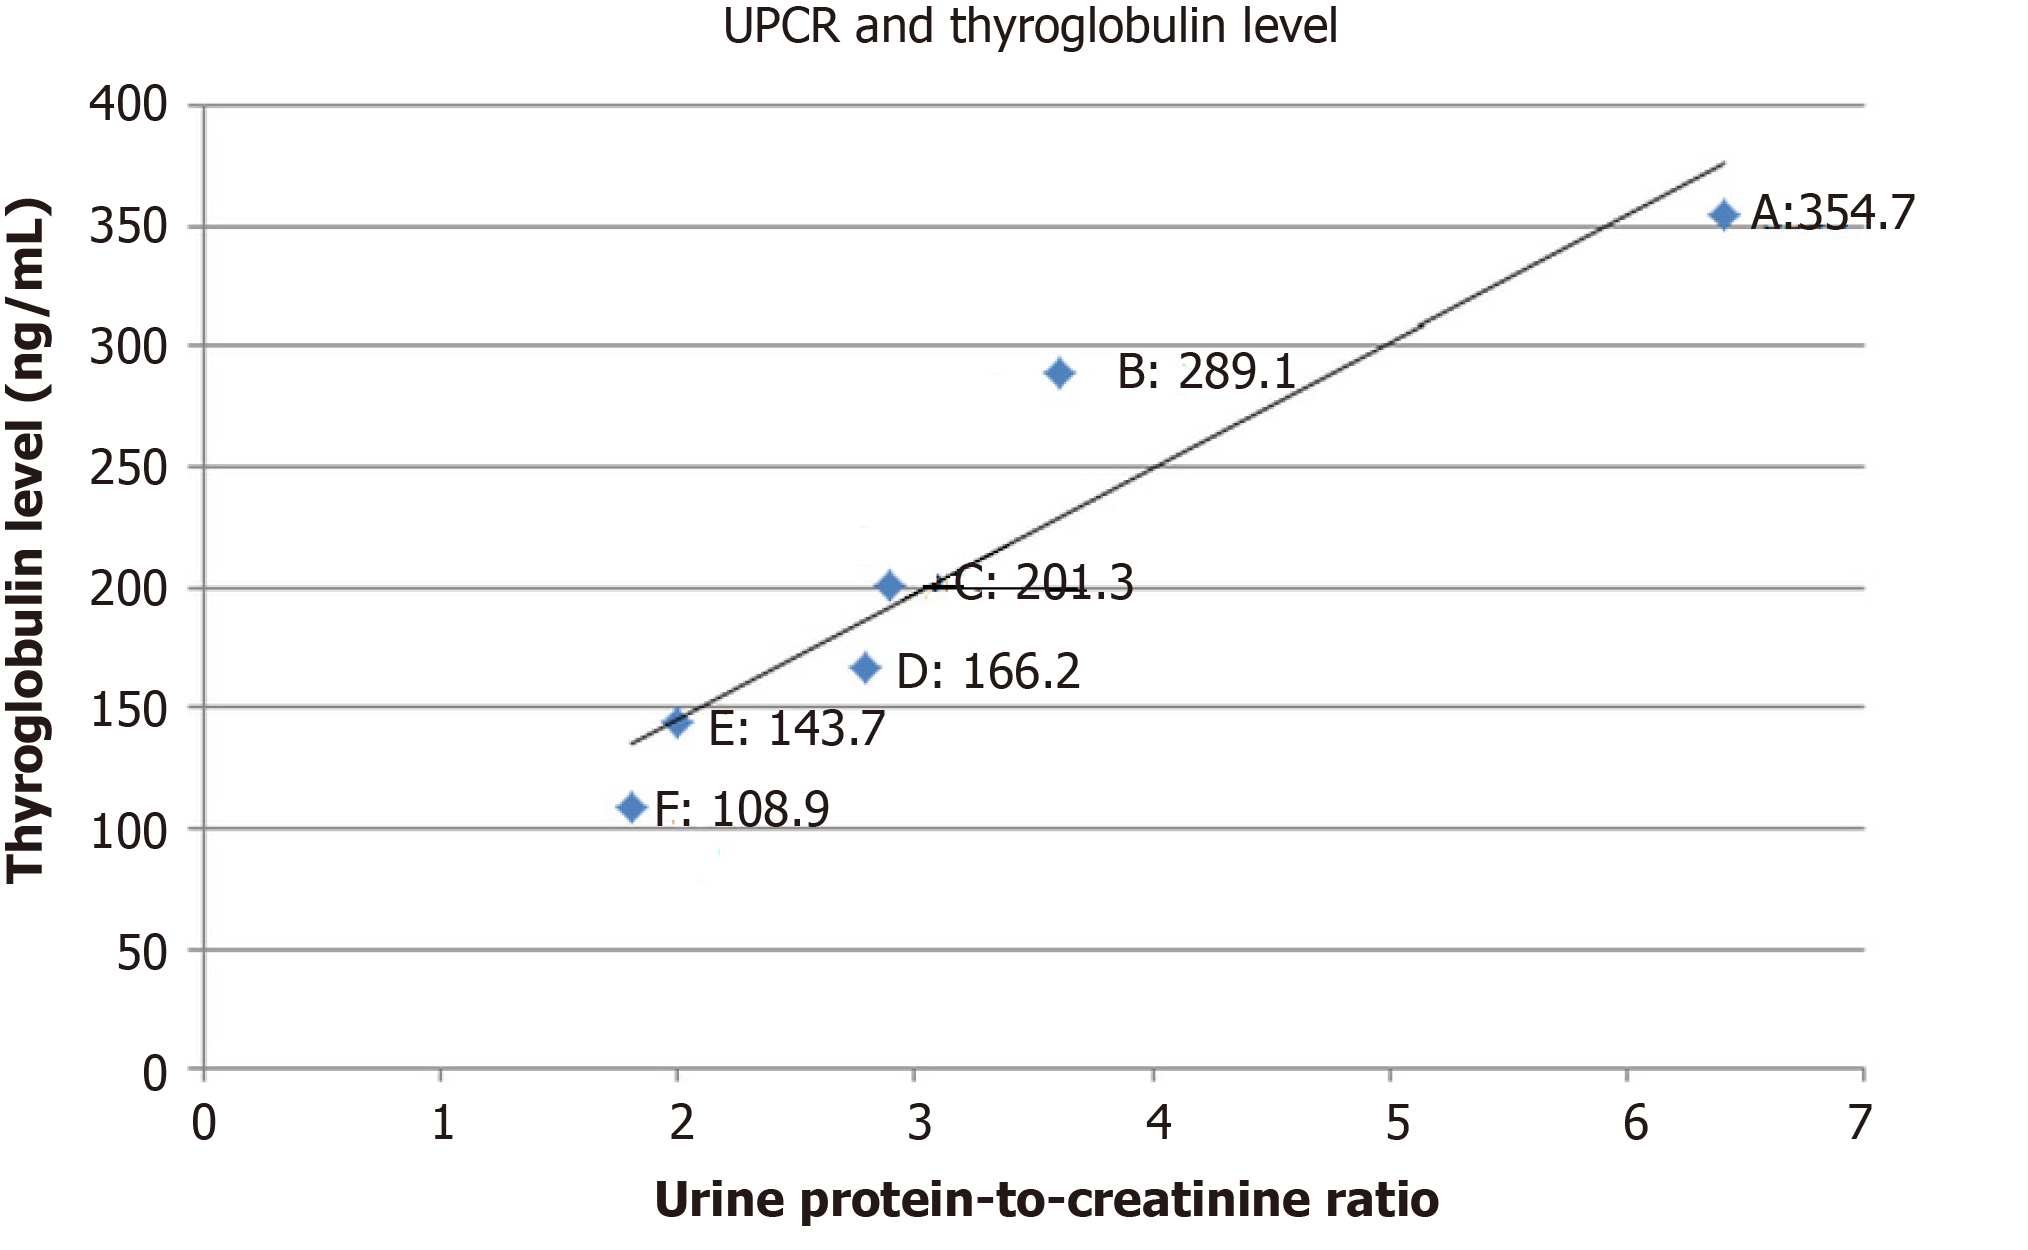
Figure 8 The serial changes of urine protein-to-creatinine ratio and thyroglobulin is pictured.
A: Lenvatinib, 10 mg/d; B: The first month of sorafenib; C: The second month of sorafenib; D: The third month of sorafenib; E: The fourth month of sorafenib; F: The fifth month of sorafenib; Therapeutic response is proved by drops of thyroglobulin, and urine protein-to-creatinine ratio is strongly relative to therapeutic response (Pearson correlation coefficient: 0.94; R2: 0.88; adjusted R2: 0.85).
- Citation: Yang CH, Chen KT, Lin YS, Hsu CY, Ou YC, Tung MC. Improvement of lenvatinib-induced nephrotic syndrome after adaptation to sorafenib in thyroid cancer: A case report. World J Clin Cases 2020; 8(20): 4883-4894
- URL: https://www.wjgnet.com/2307-8960/full/v8/i20/4883.htm
- DOI: https://dx.doi.org/10.12998/wjcc.v8.i20.4883


