Copyright
©The Author(s) 2020.
World J Clin Cases. Oct 26, 2020; 8(20): 4826-4837
Published online Oct 26, 2020. doi: 10.12998/wjcc.v8.i20.4826
Published online Oct 26, 2020. doi: 10.12998/wjcc.v8.i20.4826
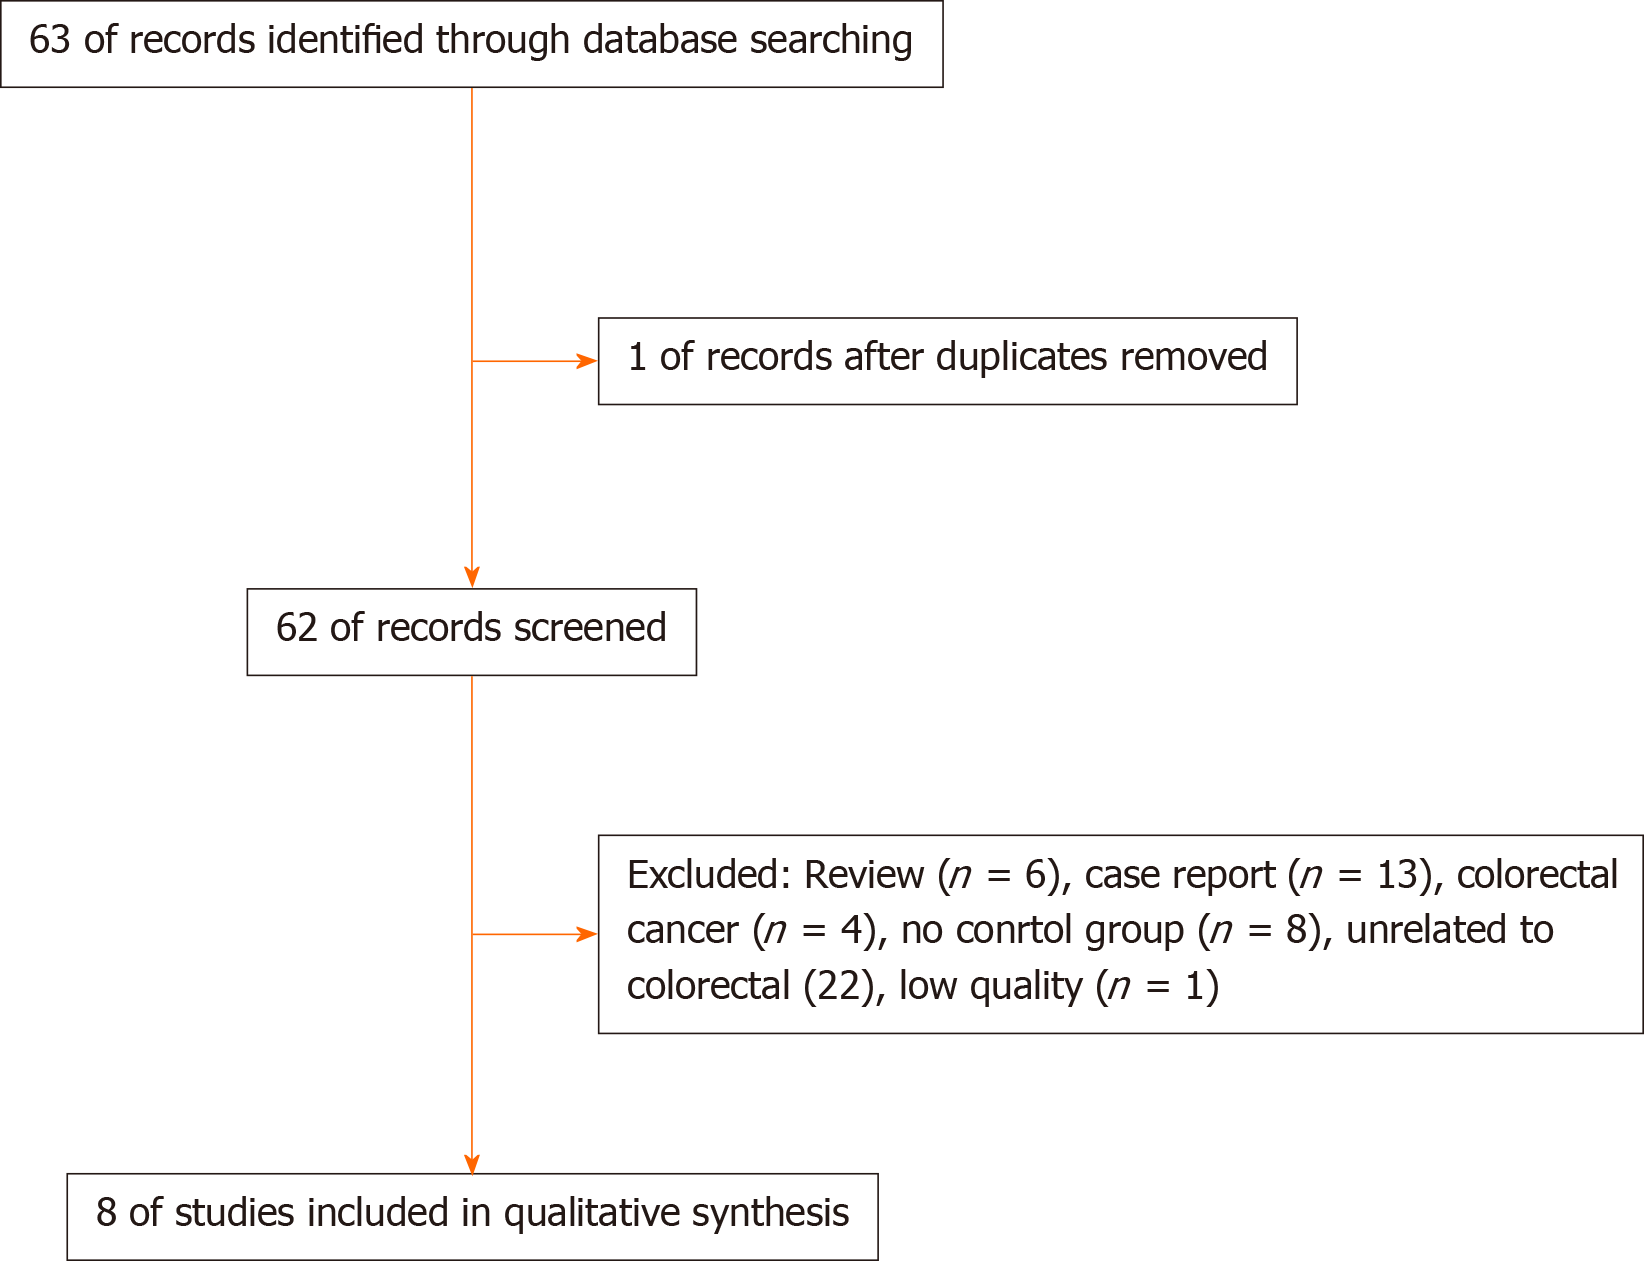
Figure 1 Retrieval flowchart of the articles.
Figure 2 Meta-analysis of the en bloc resections rate between underwater endoscopic mucosal resection group and endoscopic mucosal resection group.
UEMR: Underwater endoscopic mucosal resection; EMR: Endoscopic mucosal resection.
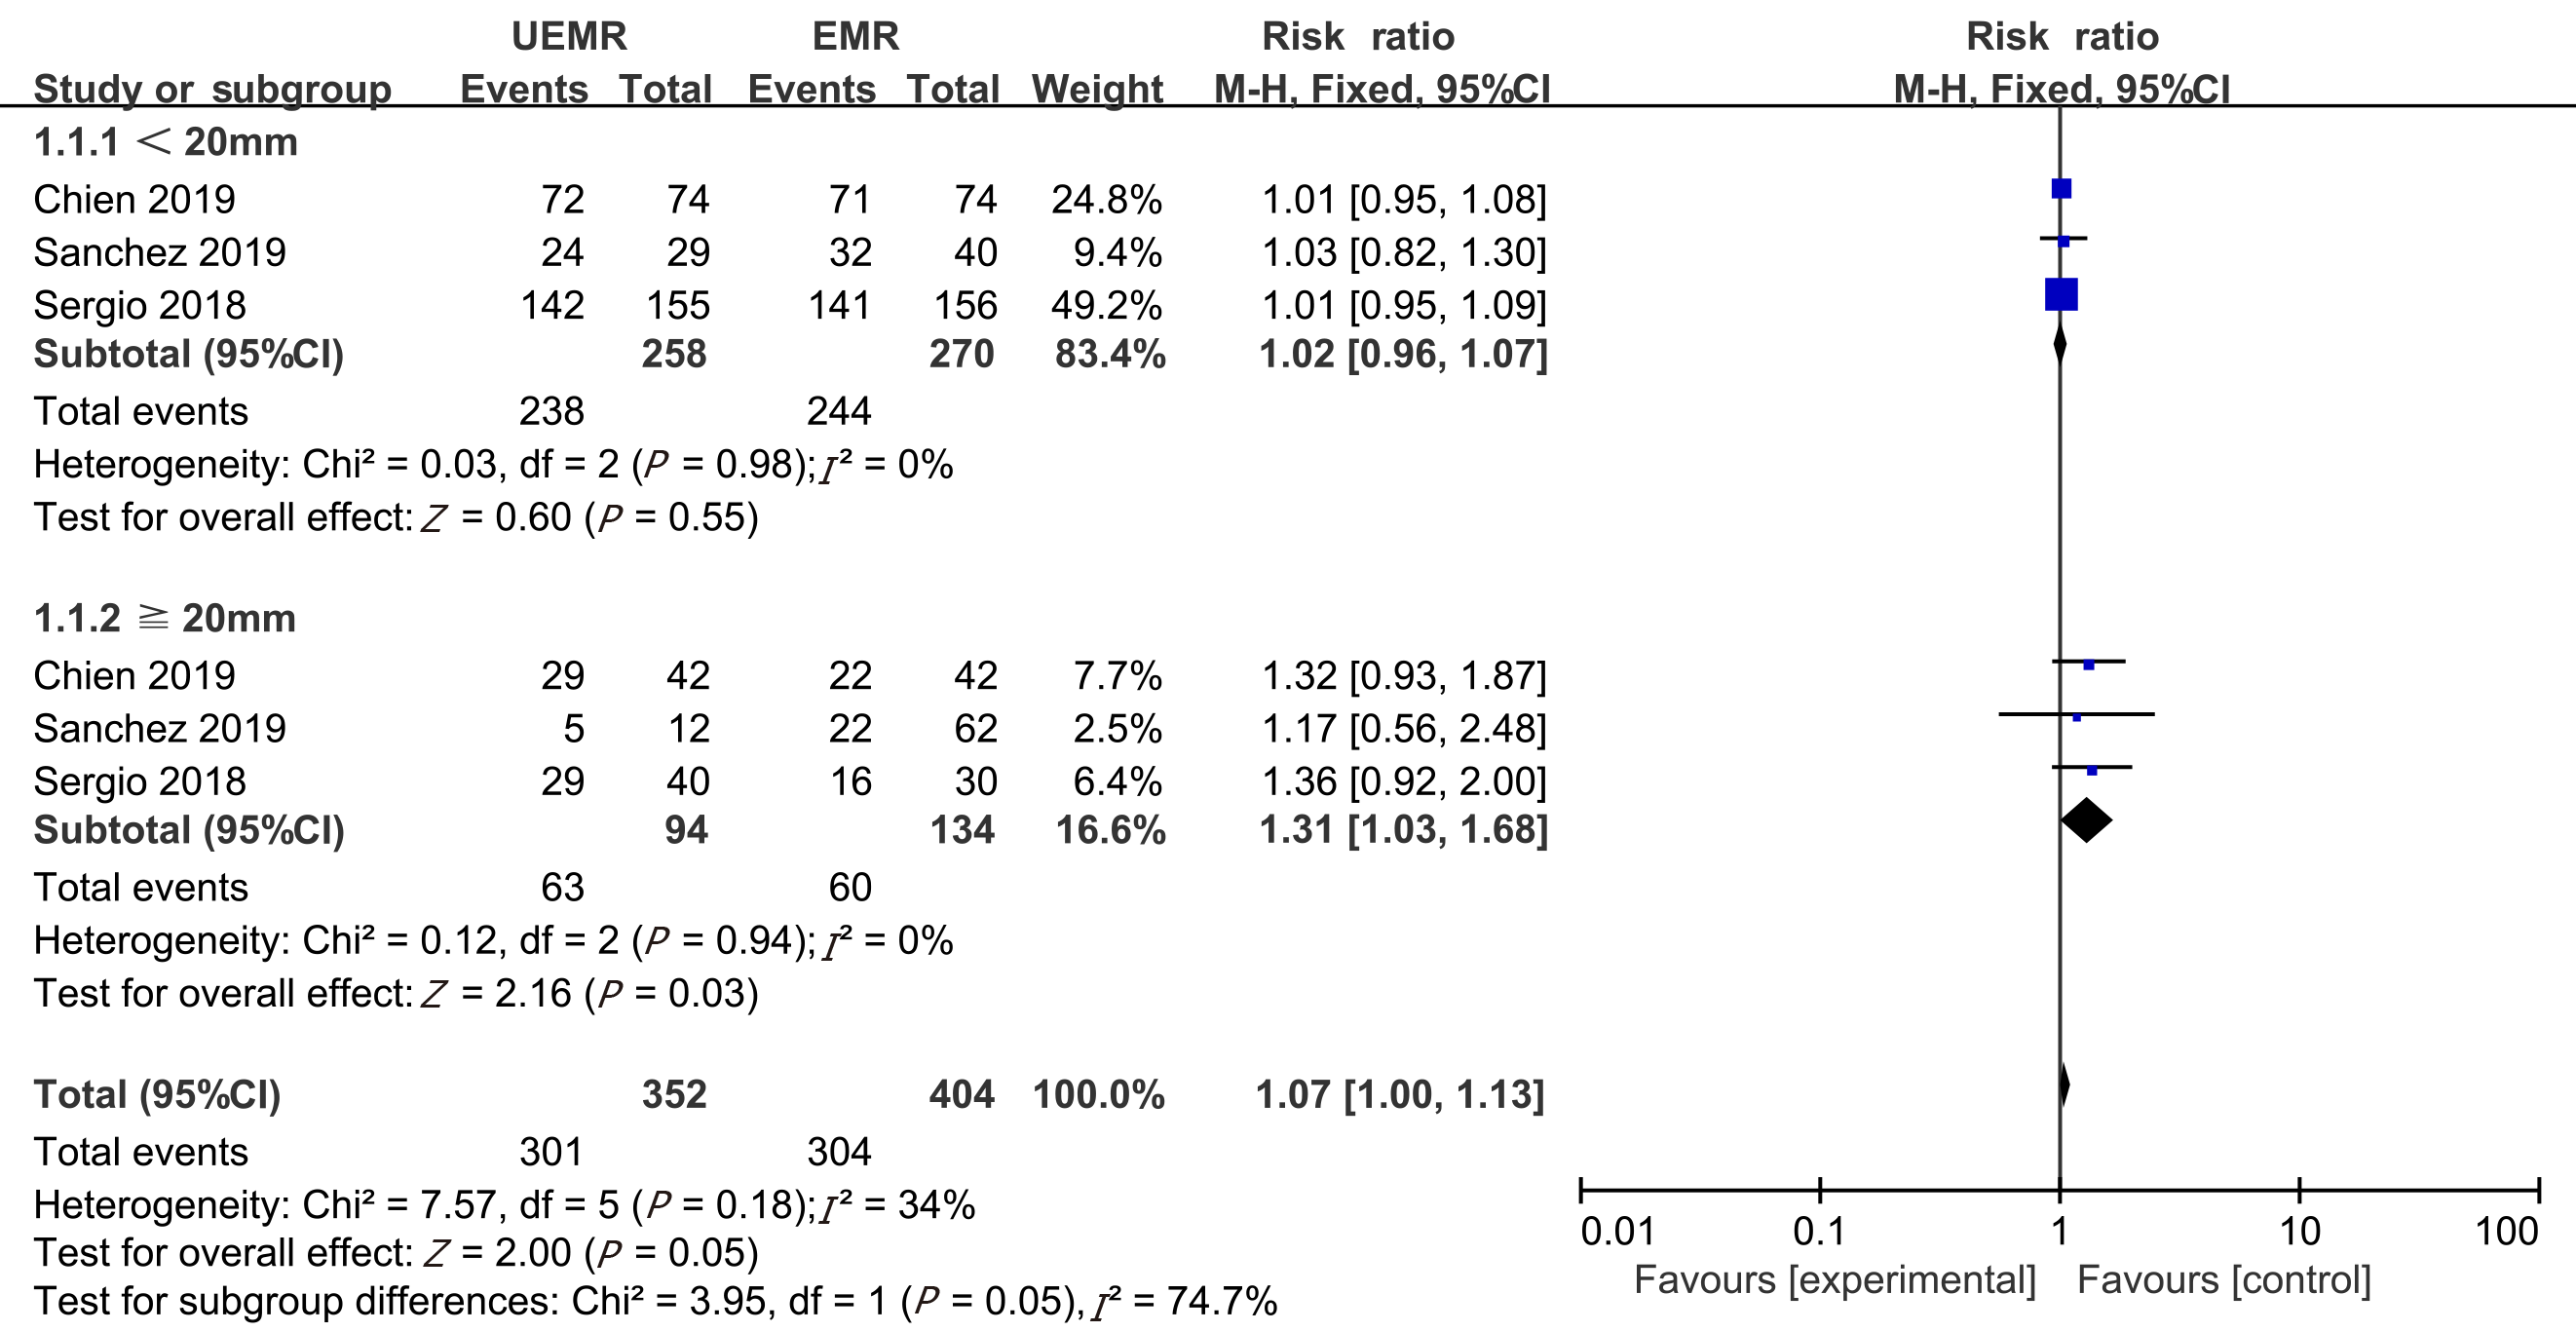
Figure 3 Sub-group analysis of the en bloc resections rate between underwater endoscopic mucosal resection group and endoscopic mucosal resection group.
UEMR: Underwater endoscopic mucosal resection; EMR: Endoscopic mucosal resection.
Figure 4 Meta-analysis of the incidence of adverse events between underwater endoscopic mucosal resection group and endoscopic mucosal resection group.
UEMR: Underwater endoscopic mucosal resection; EMR: Endoscopic mucosal resection.
Figure 5 Meta-analysis of the postoperative recurrence rate at 3-6 mo between underwater endoscopic mucosal resection group and endoscopic mucosal resection group.
UEMR: Underwater endoscopic mucosal resection; EMR: Endoscopic mucosal resection.
Figure 6 Meta-analysis of the postoperative recurrence rate at 12 mo between underwater endoscopic mucosal resection group and endoscopic mucosal resection group.
UEMR: Underwater endoscopic mucosal resection; EMR: Endoscopic mucosal resection.
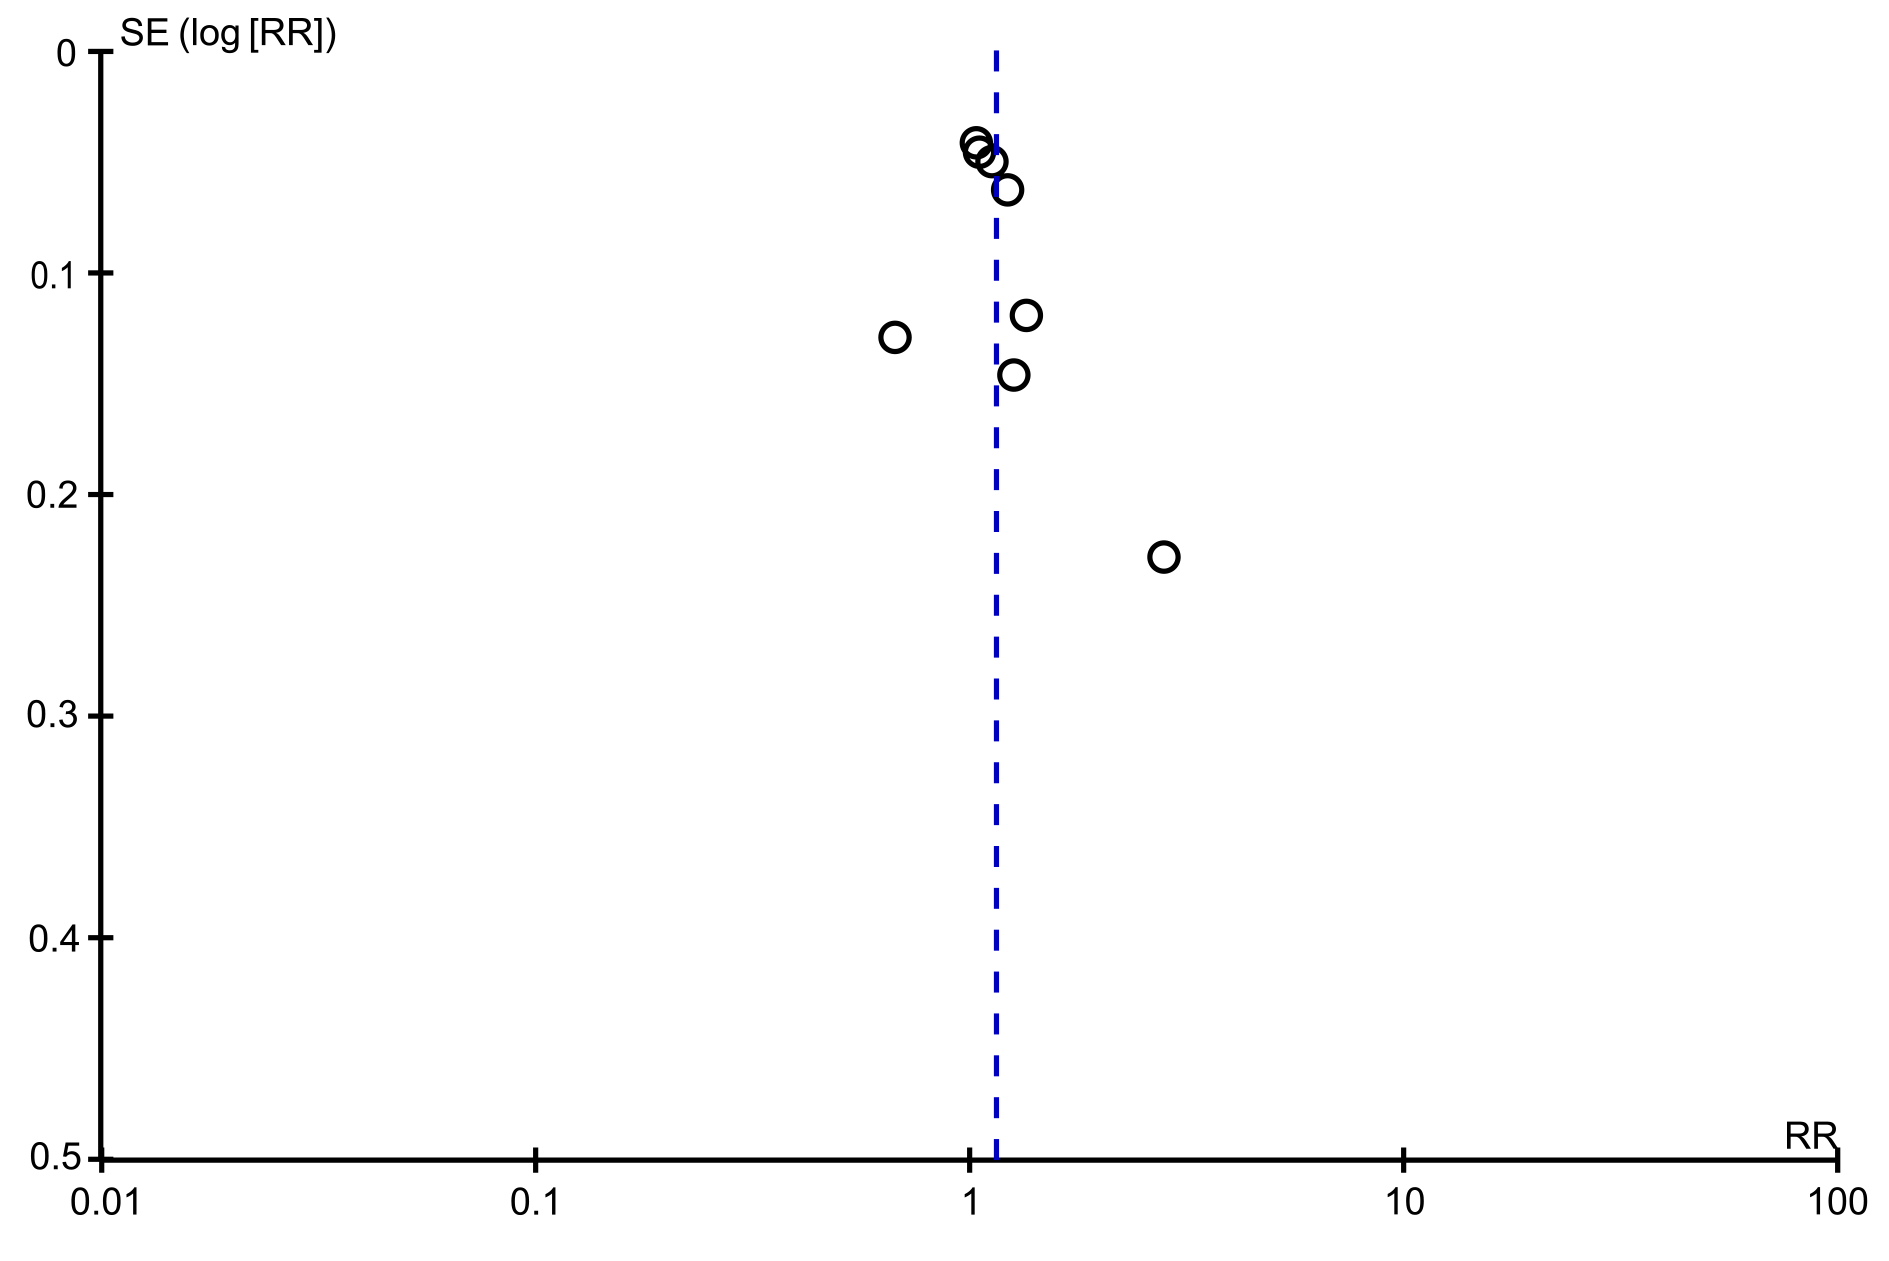
Figure 7 Funnel plot for en bloc resections rate.
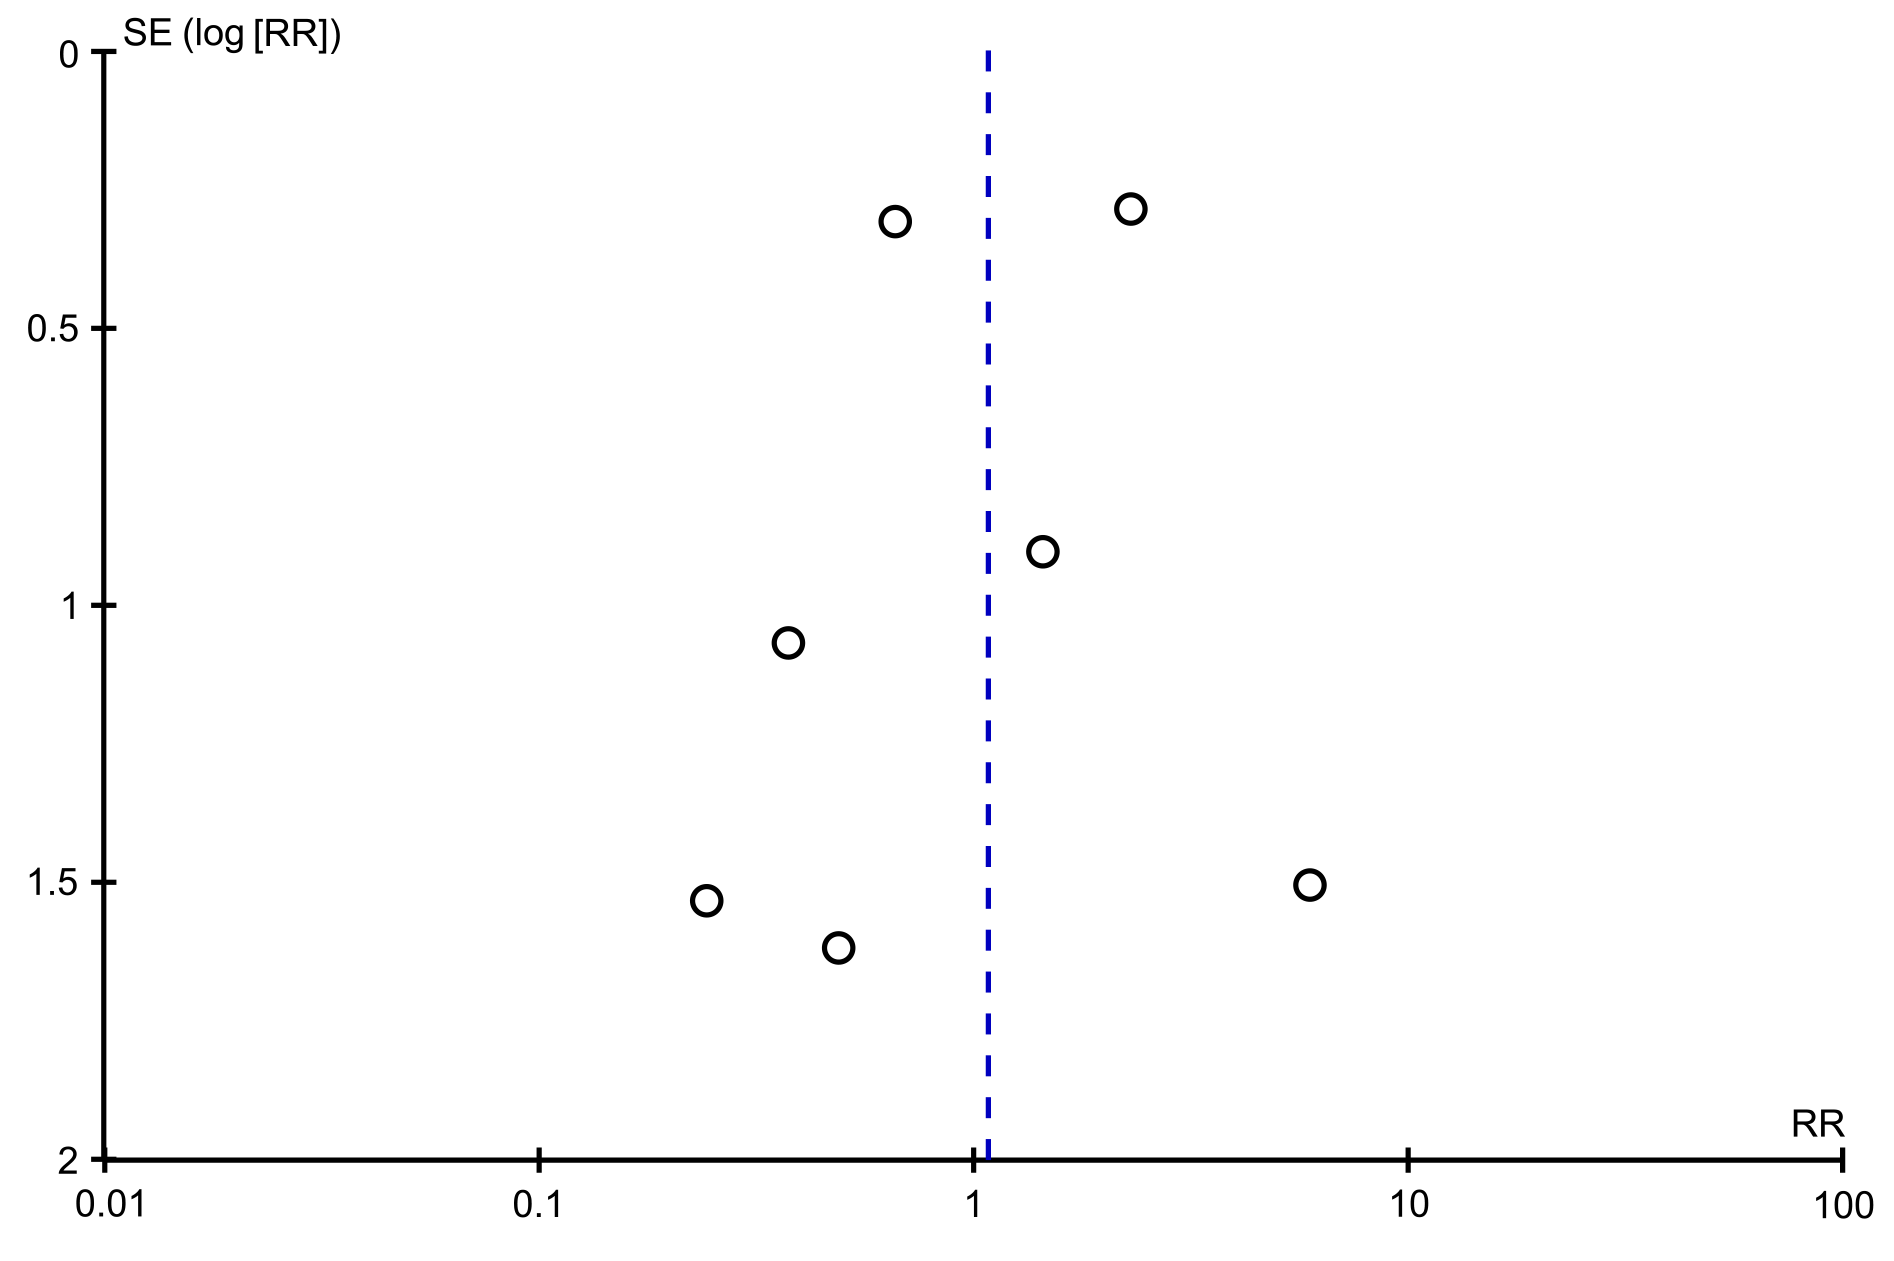
Figure 8 Funnel plot for incidence of adverse events.
- Citation: Ni DQ, Lu YP, Liu XQ, Gao LY, Huang X. Underwater vs conventional endoscopic mucosal resection in treatment of colorectal polyps: A meta-analysis. World J Clin Cases 2020; 8(20): 4826-4837
- URL: https://www.wjgnet.com/2307-8960/full/v8/i20/4826.htm
- DOI: https://dx.doi.org/10.12998/wjcc.v8.i20.4826


