Copyright
©The Author(s) 2020.
World J Clin Cases. Oct 6, 2020; 8(19): 4416-4430
Published online Oct 6, 2020. doi: 10.12998/wjcc.v8.i19.4416
Published online Oct 6, 2020. doi: 10.12998/wjcc.v8.i19.4416
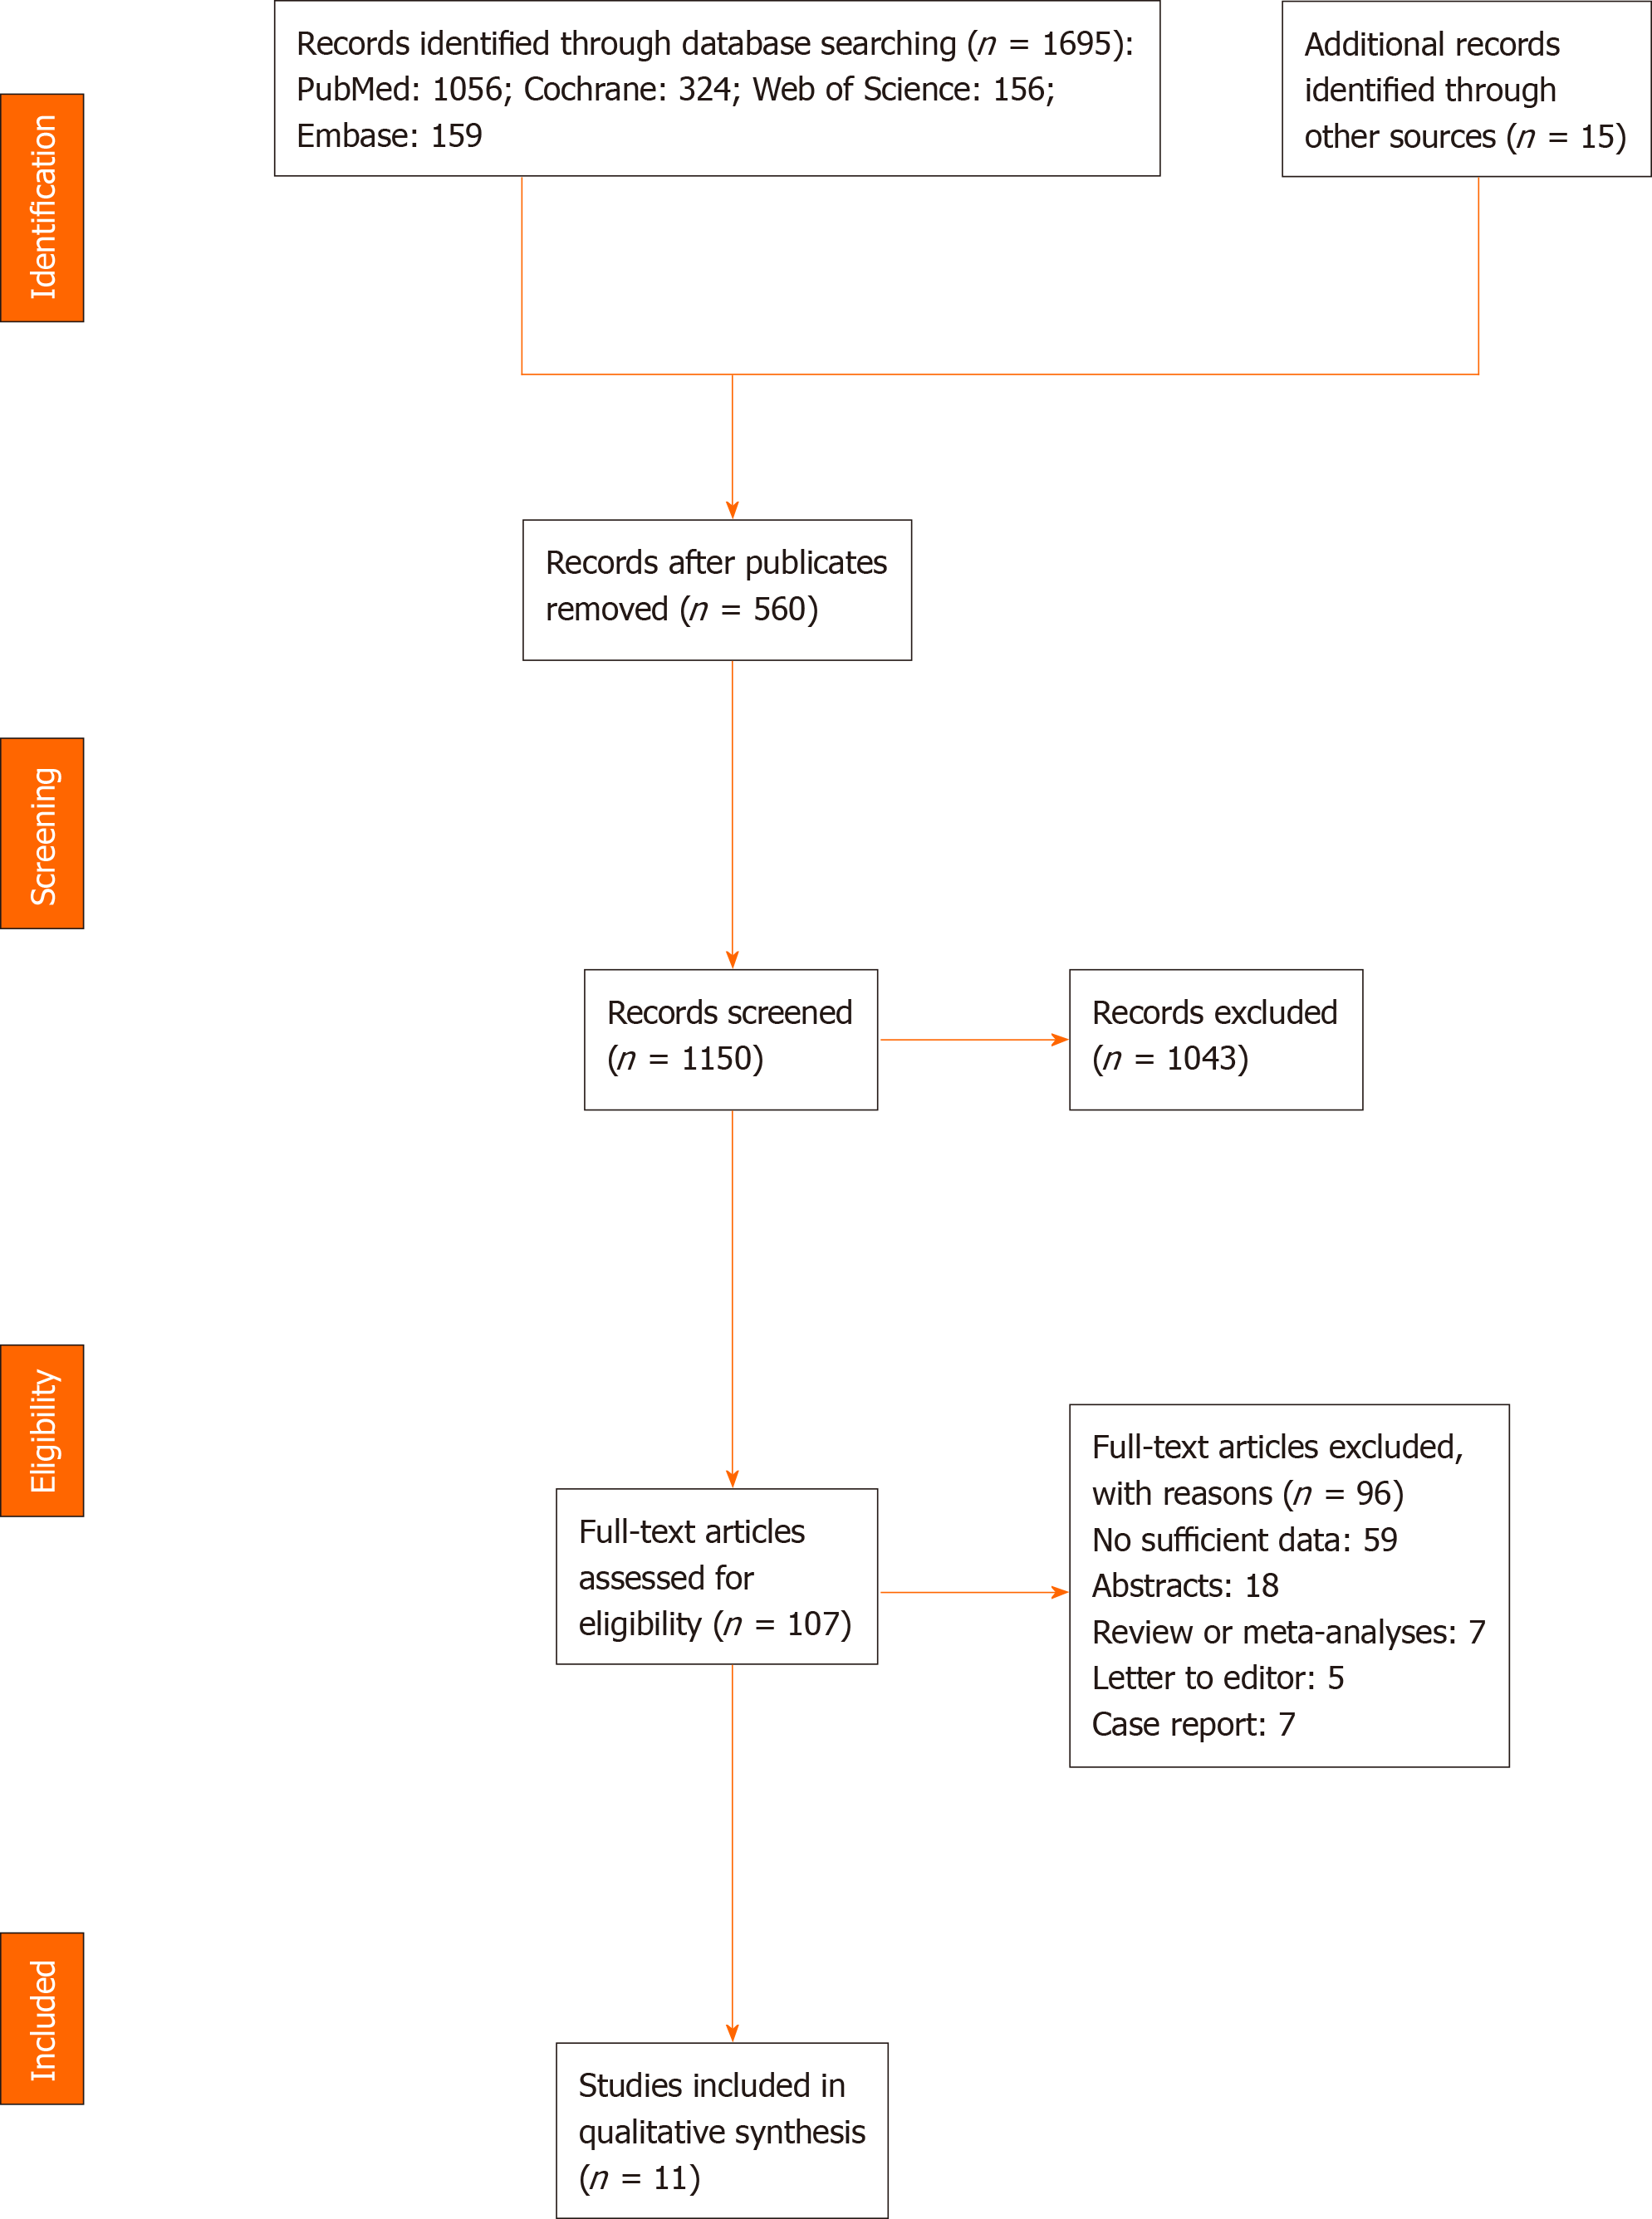
Figure 1 Flow diagram representing the selection of studies.
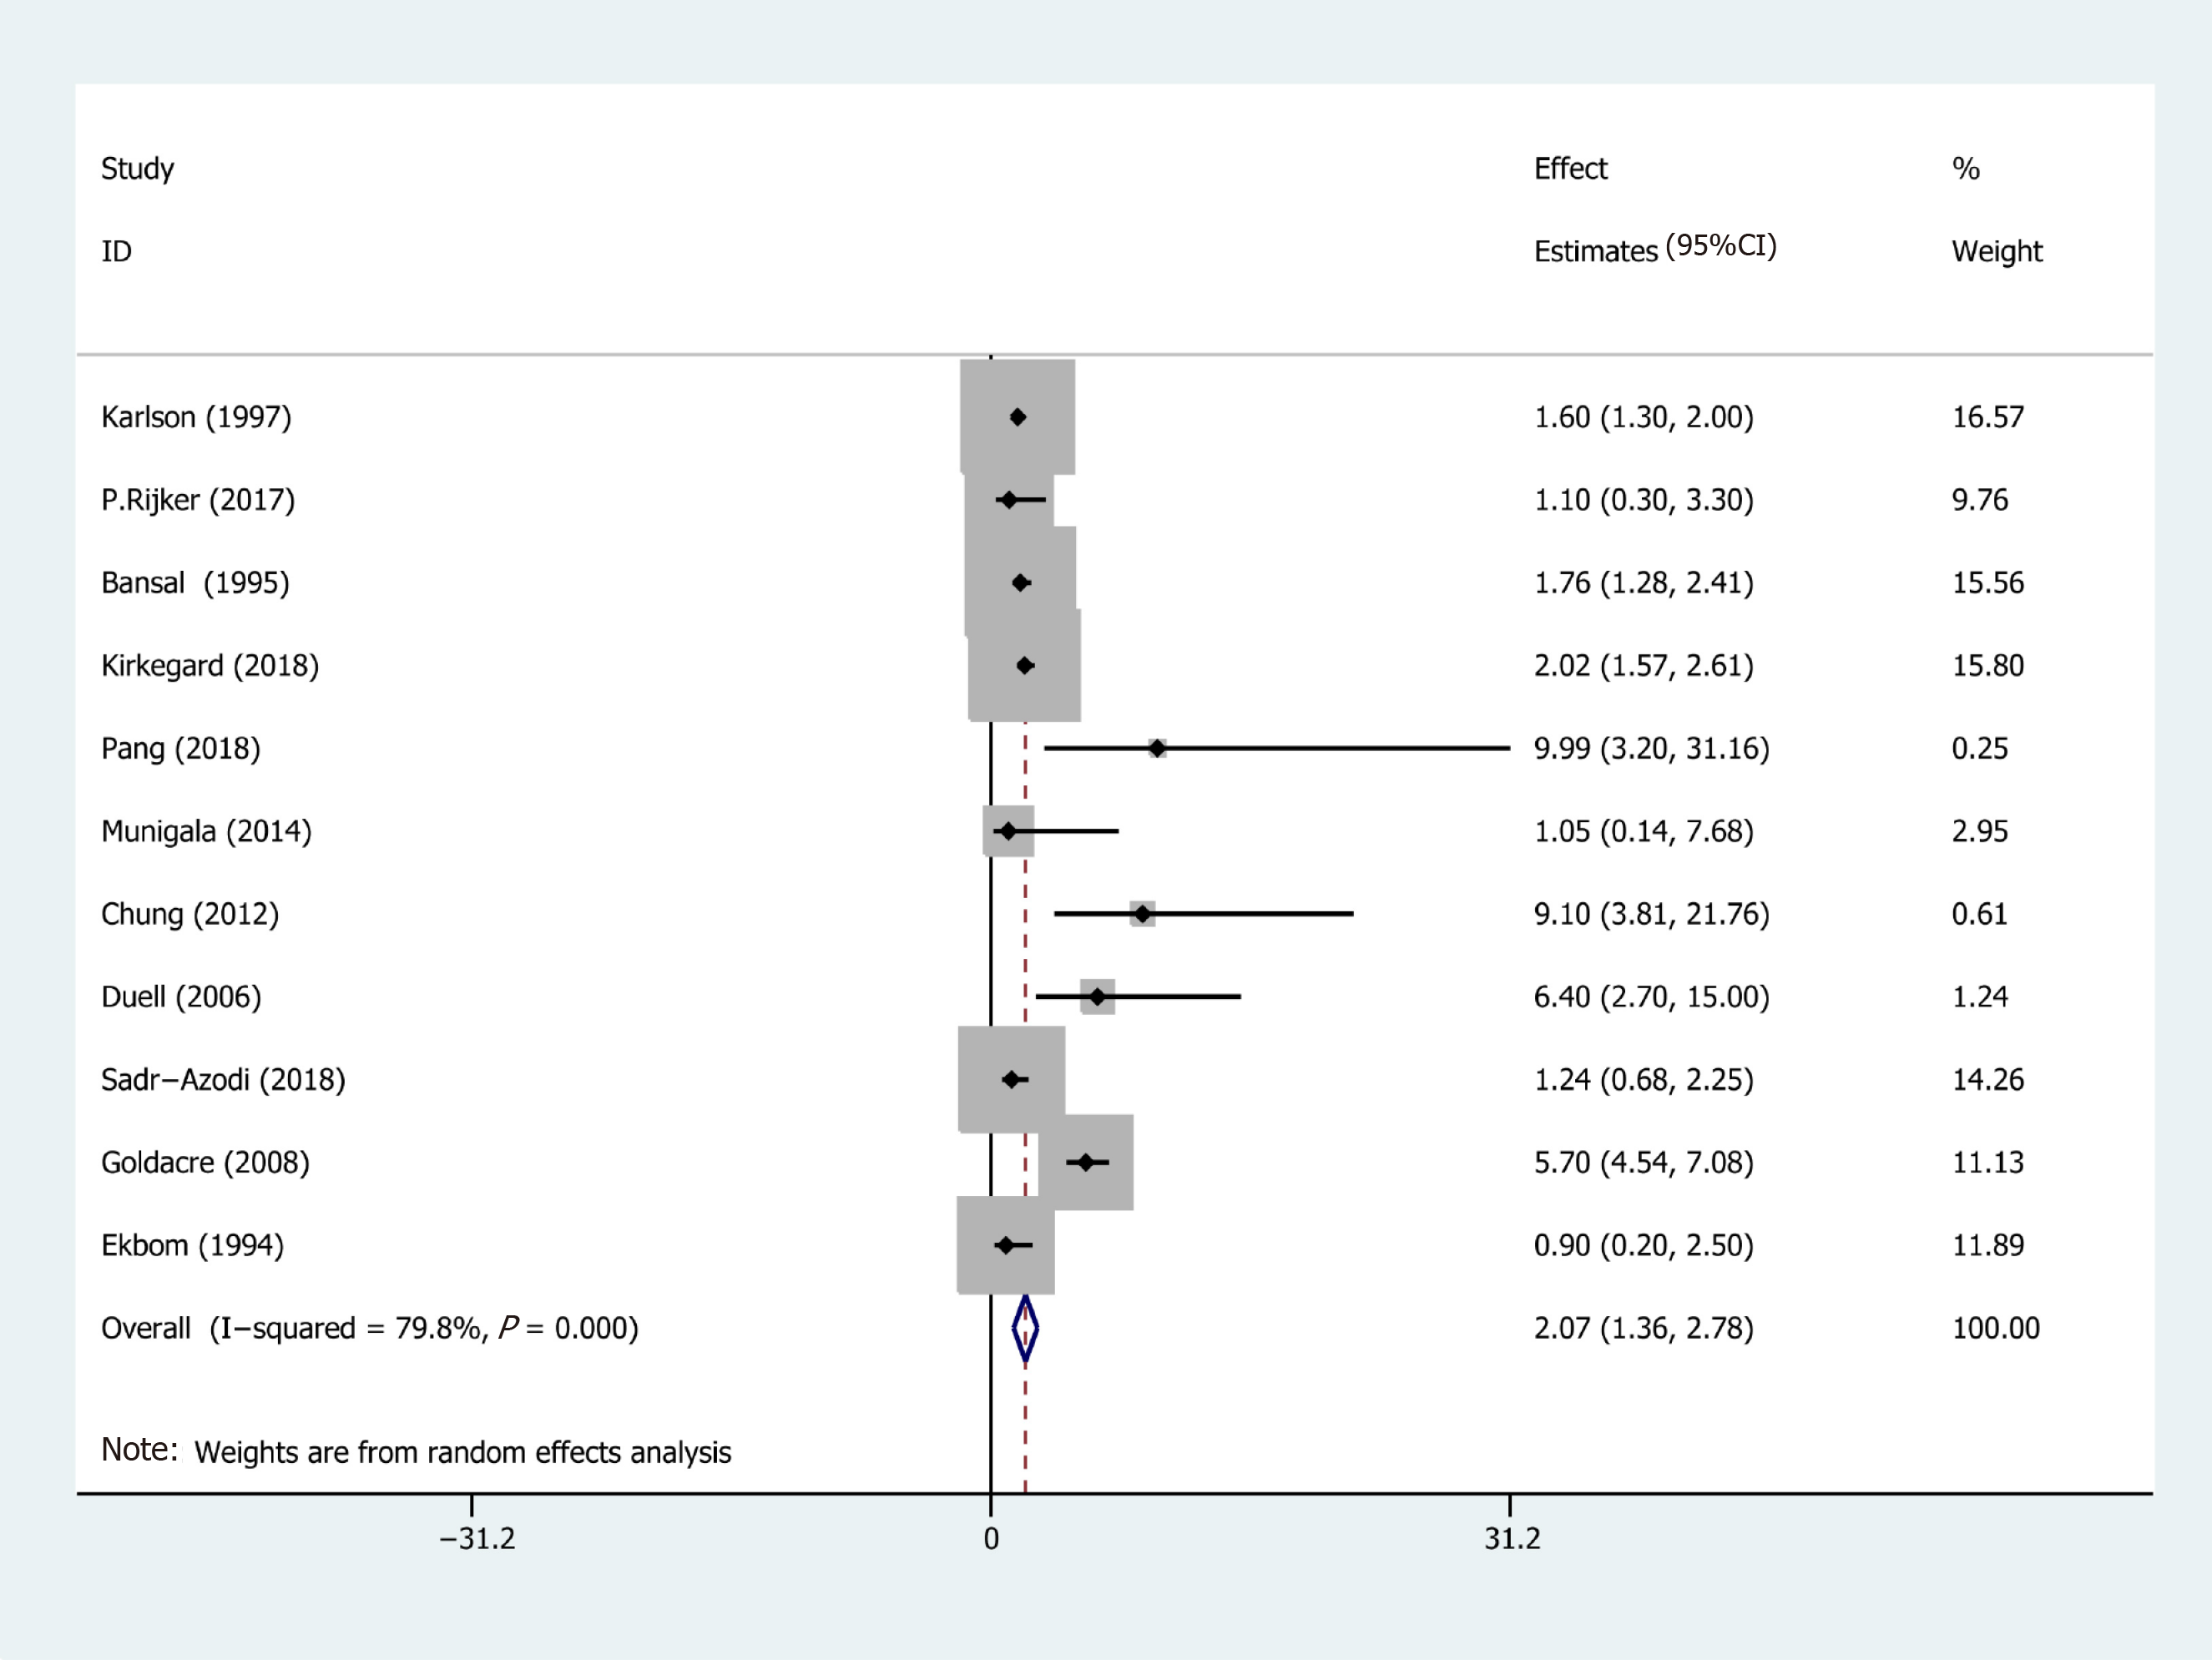
Figure 2 Forest plot of the risk of pancreatic cancer associated with acute pancreatitis.
Hollow diamonds represent pooled effect estimates.
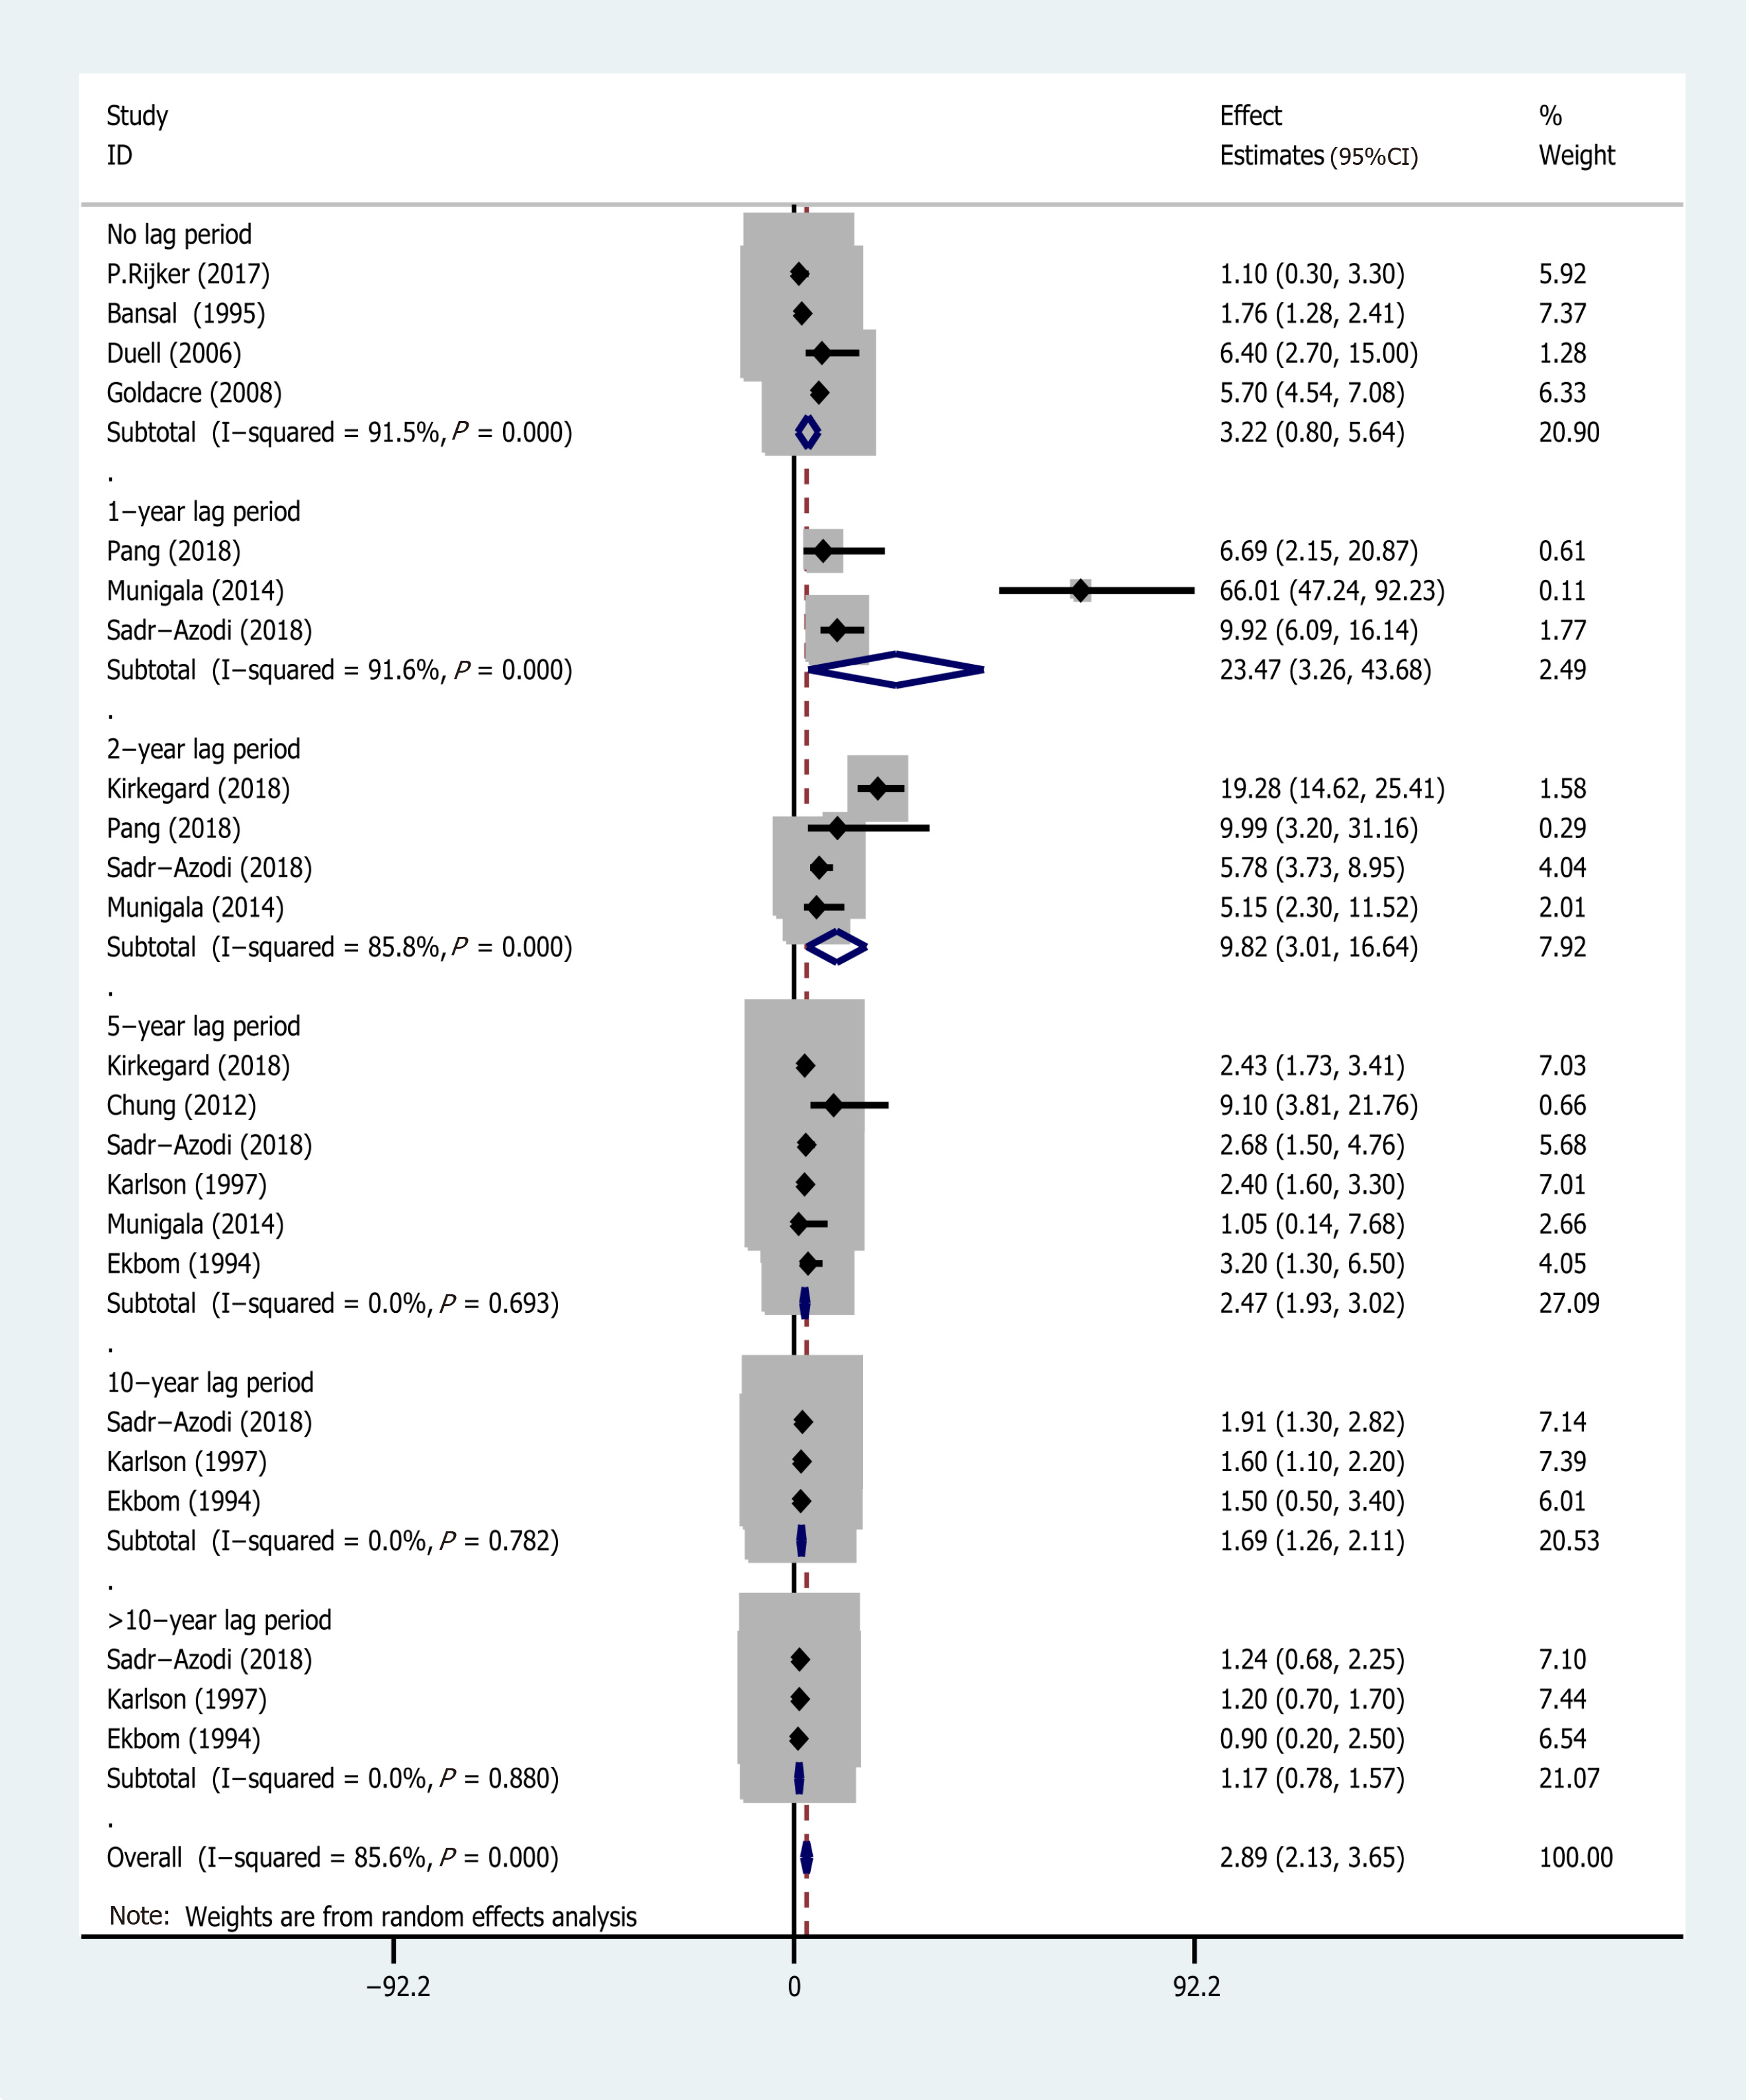
Figure 3 Forest plot of the association of acute pancreatitis and pancreatic cancer.
Hollow diamonds represent pooled relative risk.
Figure 4 Subgroup analysis for different follow-up times.
AP: Acute pancreatitis; CI: Confidence interval; EEs: Effect estimates; PC: Pancreatic cancer.
Figure 5 Subgroup analysis for the type of research method.
Figure 6 Risk of publication bias for developing acute pancreatitis in pancreatic cancer risk based on the Egger’s test.
Figure 7 Sensitivity analysis of included studies for developing acute pancreatitis in pancreatic cancer risk.
- Citation: Liu J, Wang Y, Yu Y. Meta-analysis reveals an association between acute pancreatitis and the risk of pancreatic cancer. World J Clin Cases 2020; 8(19): 4416-4430
- URL: https://www.wjgnet.com/2307-8960/full/v8/i19/4416.htm
- DOI: https://dx.doi.org/10.12998/wjcc.v8.i19.4416


