©The Author(s) 2020.
World J Clin Cases. Sep 6, 2020; 8(17): 3911-3919
Published online Sep 6, 2020. doi: 10.12998/wjcc.v8.i17.3911
Published online Sep 6, 2020. doi: 10.12998/wjcc.v8.i17.3911
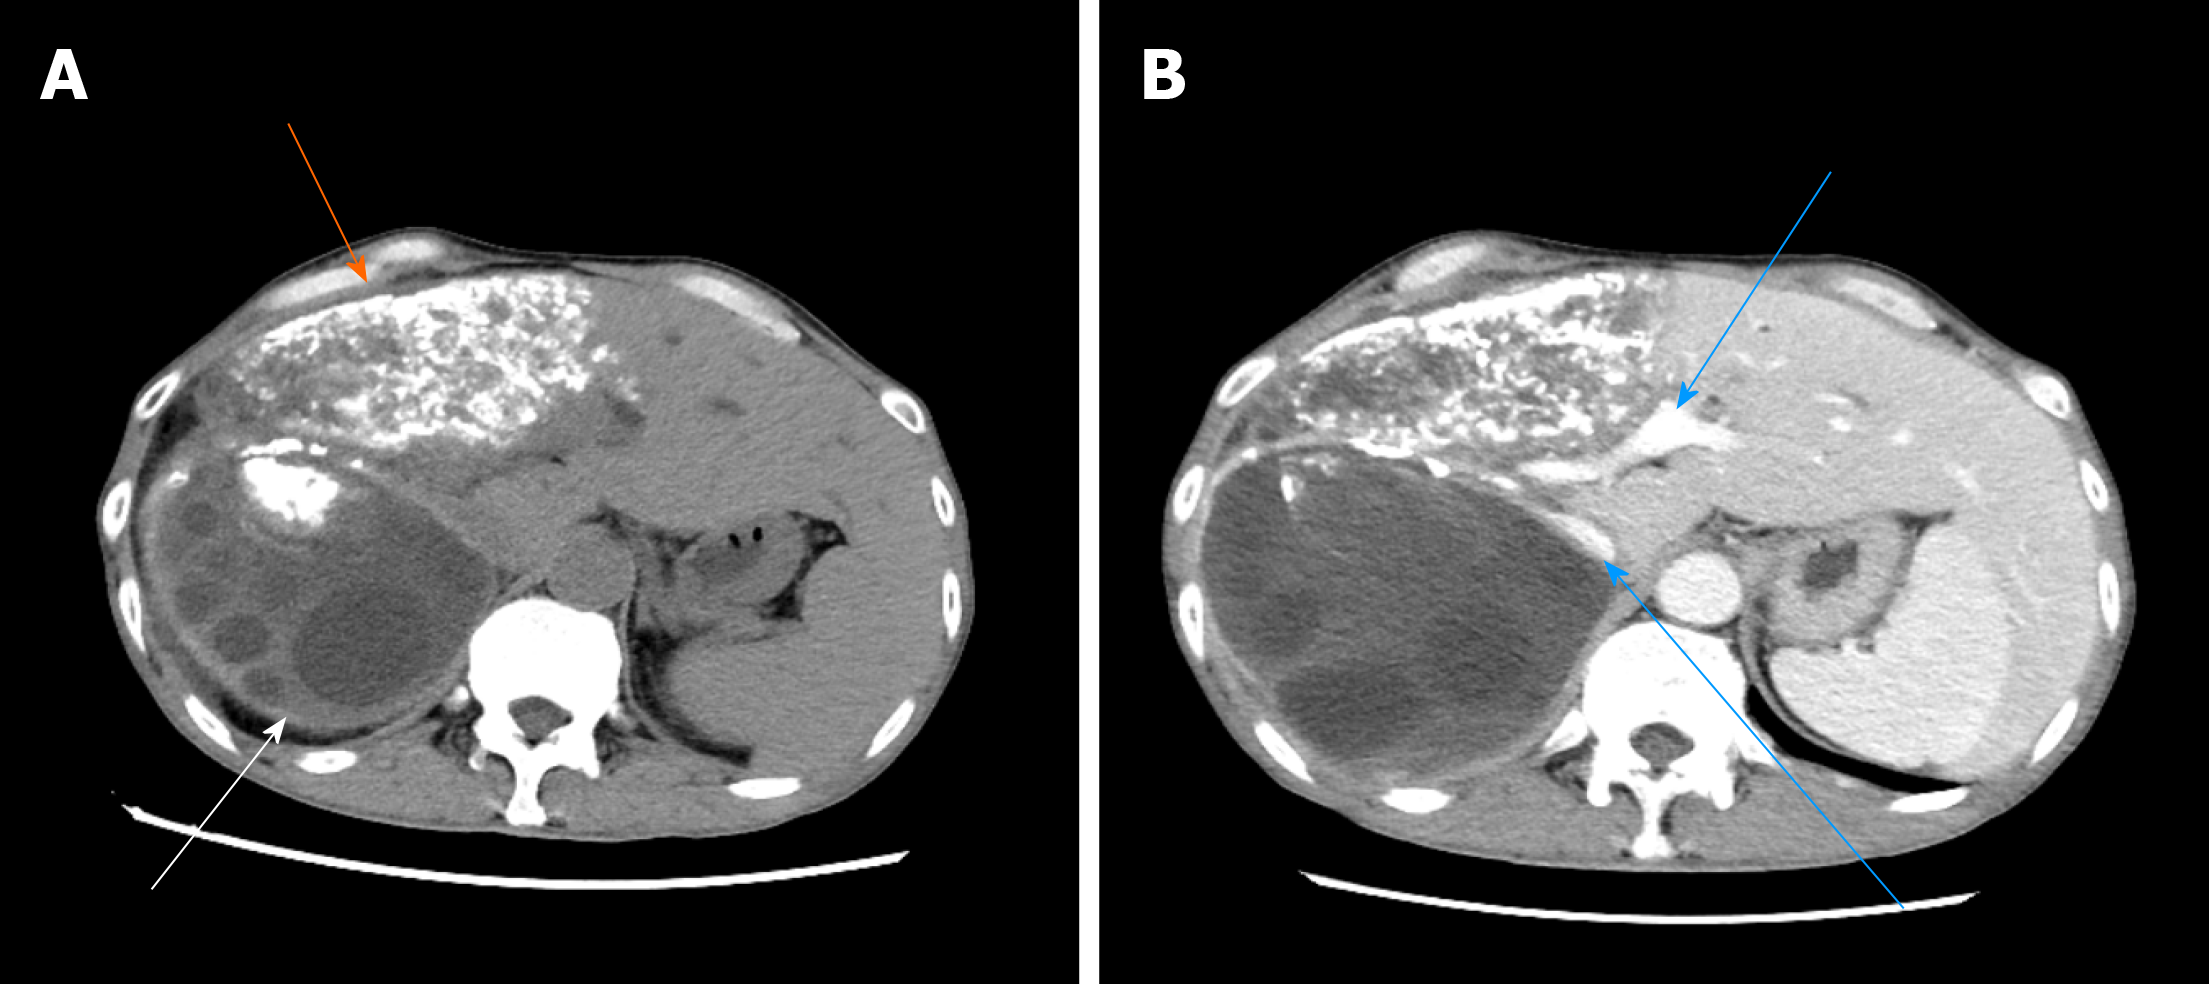
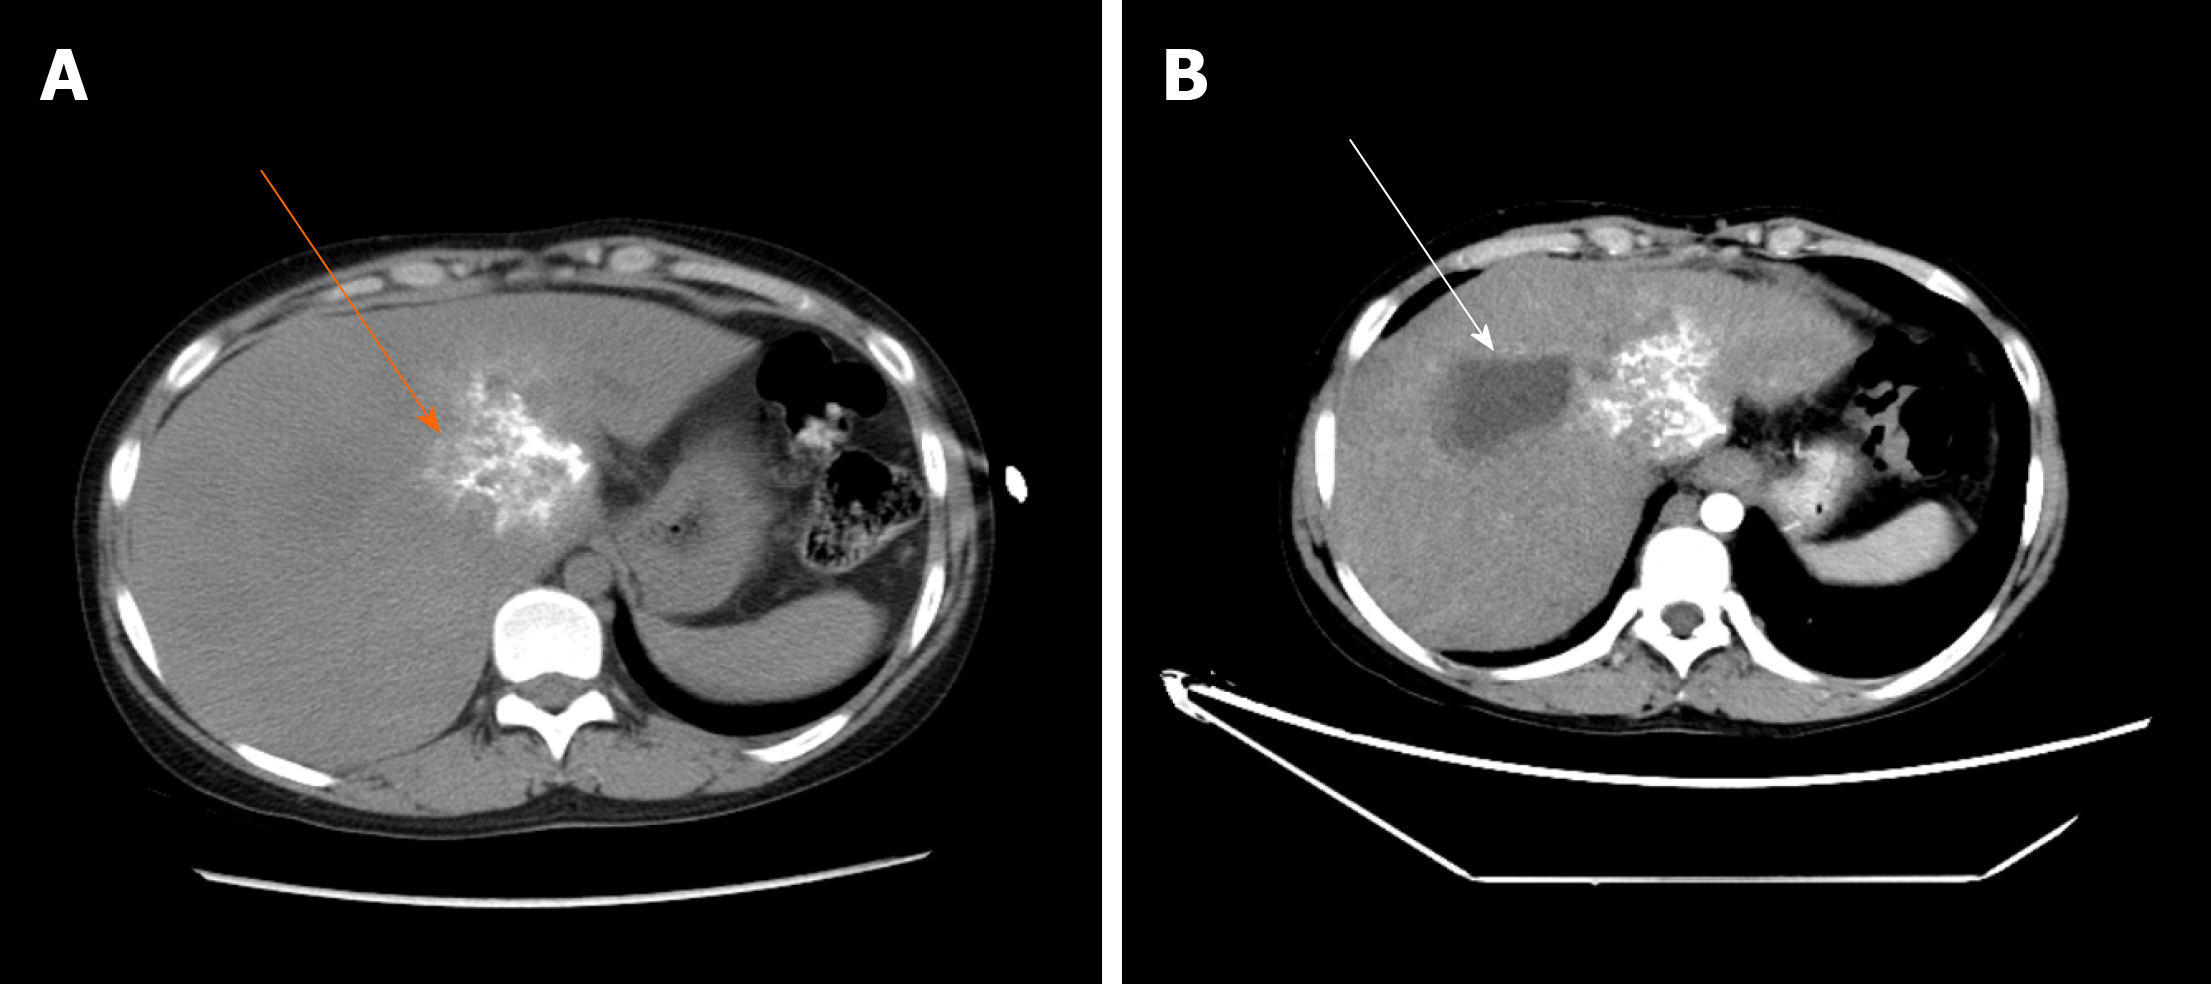
Figure 1 The typical case of abdominal enhanced computed tomography.
A: The low-density shadow indicated by the white arrow is cystic echinococcosis with multiple different sizes of subcysts inside, while the high-density shadow indicated by the orange arrow is alveolar echinococcosis, which exhibited patchy calcification; B: The high-density shadows indicated by the blue arrows are the retrohepatic inferior vena cava and portal vein.
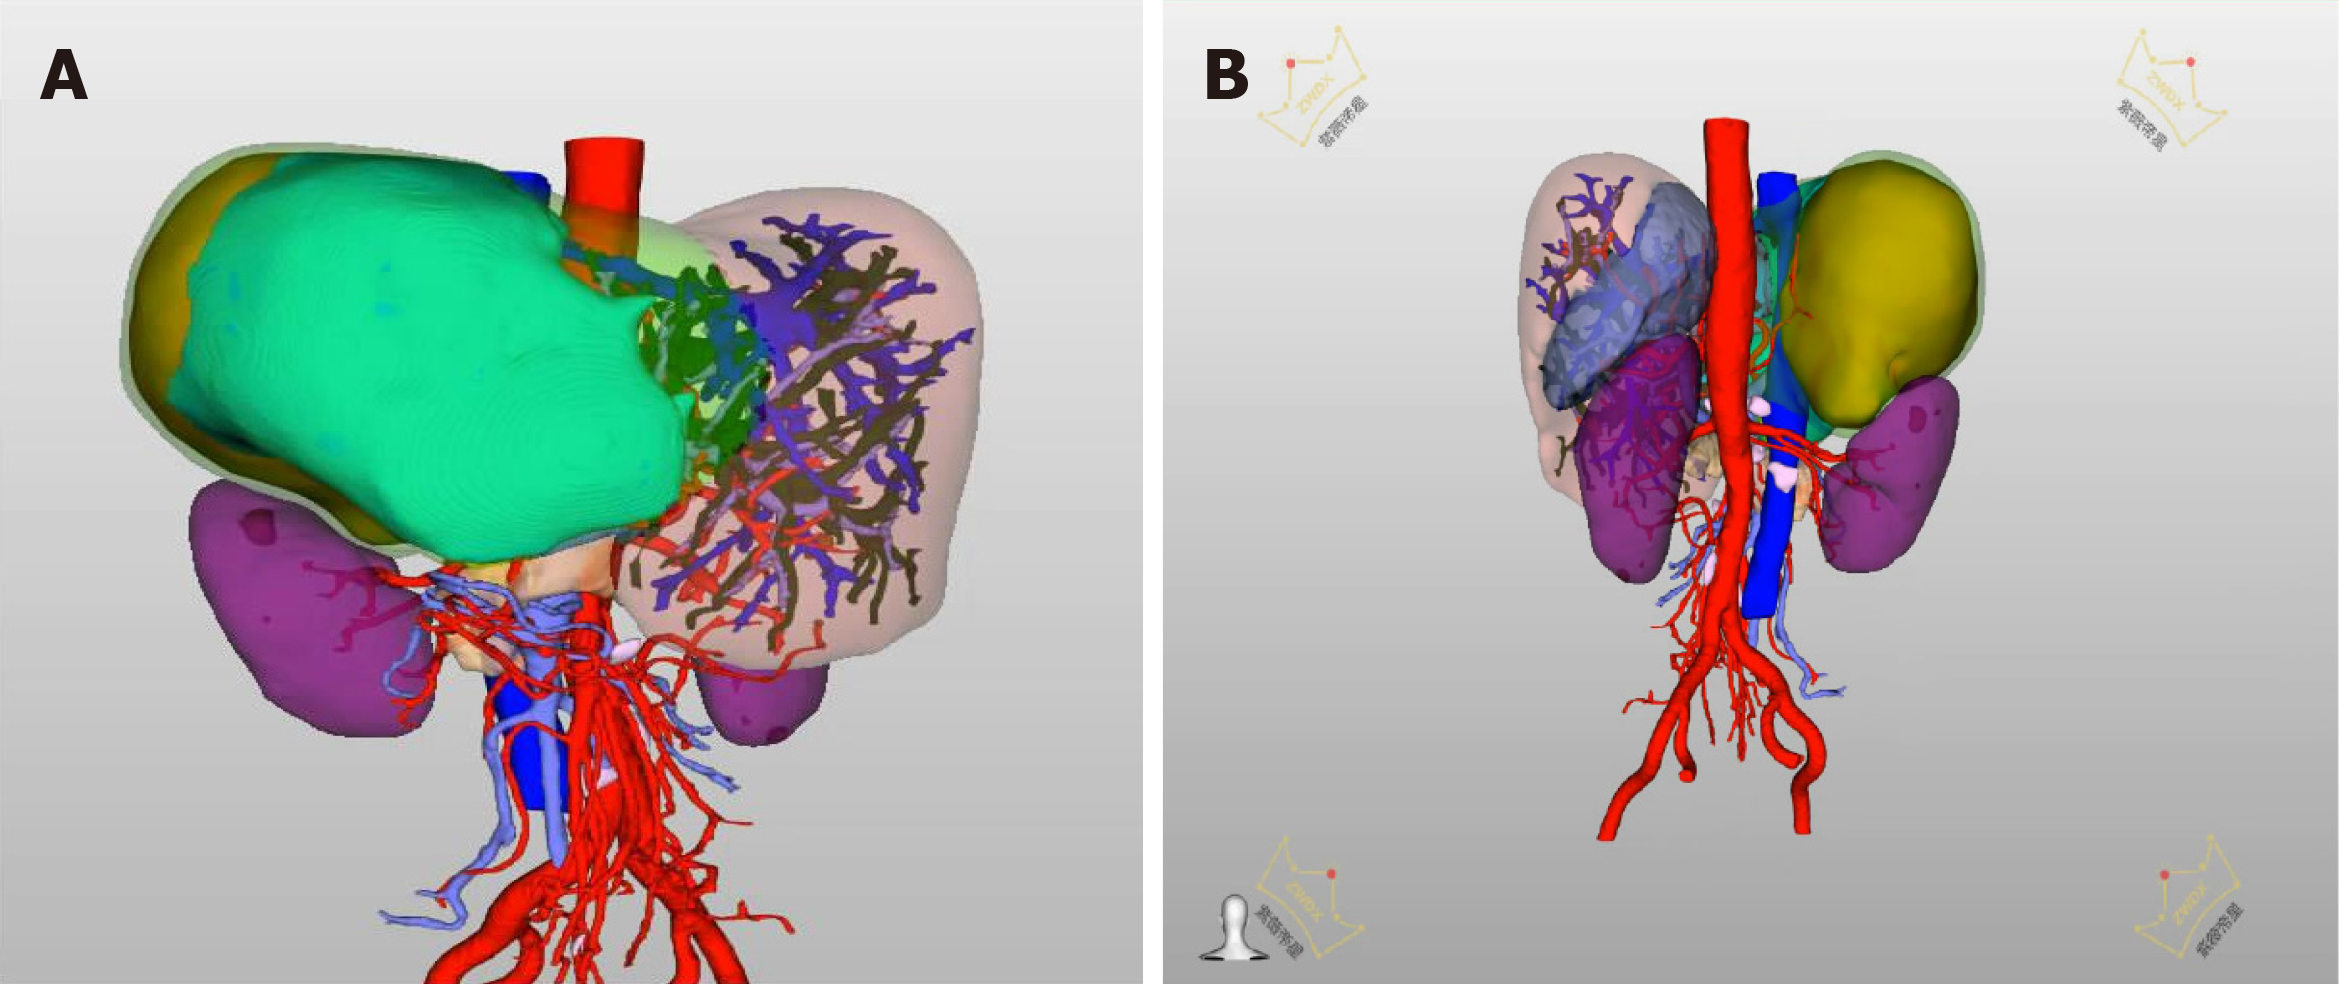
Figure 2 The typical case of preoperative 3D reconstruction.
A: In the three-dimensional reconstruction system, red represents the abdominal aorta, dark blue represents the inferior vena cava, purple represents the portal vein, orange represents cystic echinococcosis, while light blue and green represent alveolar echinococcosis; B: In the three-dimensional reconstruction system, red represents the abdominal aorta, dark blue represents the inferior vena cava, purple represents the portal vein, orange represents cystic echinococcosis, while light blue and yellow represent alveolar echinococcosis.
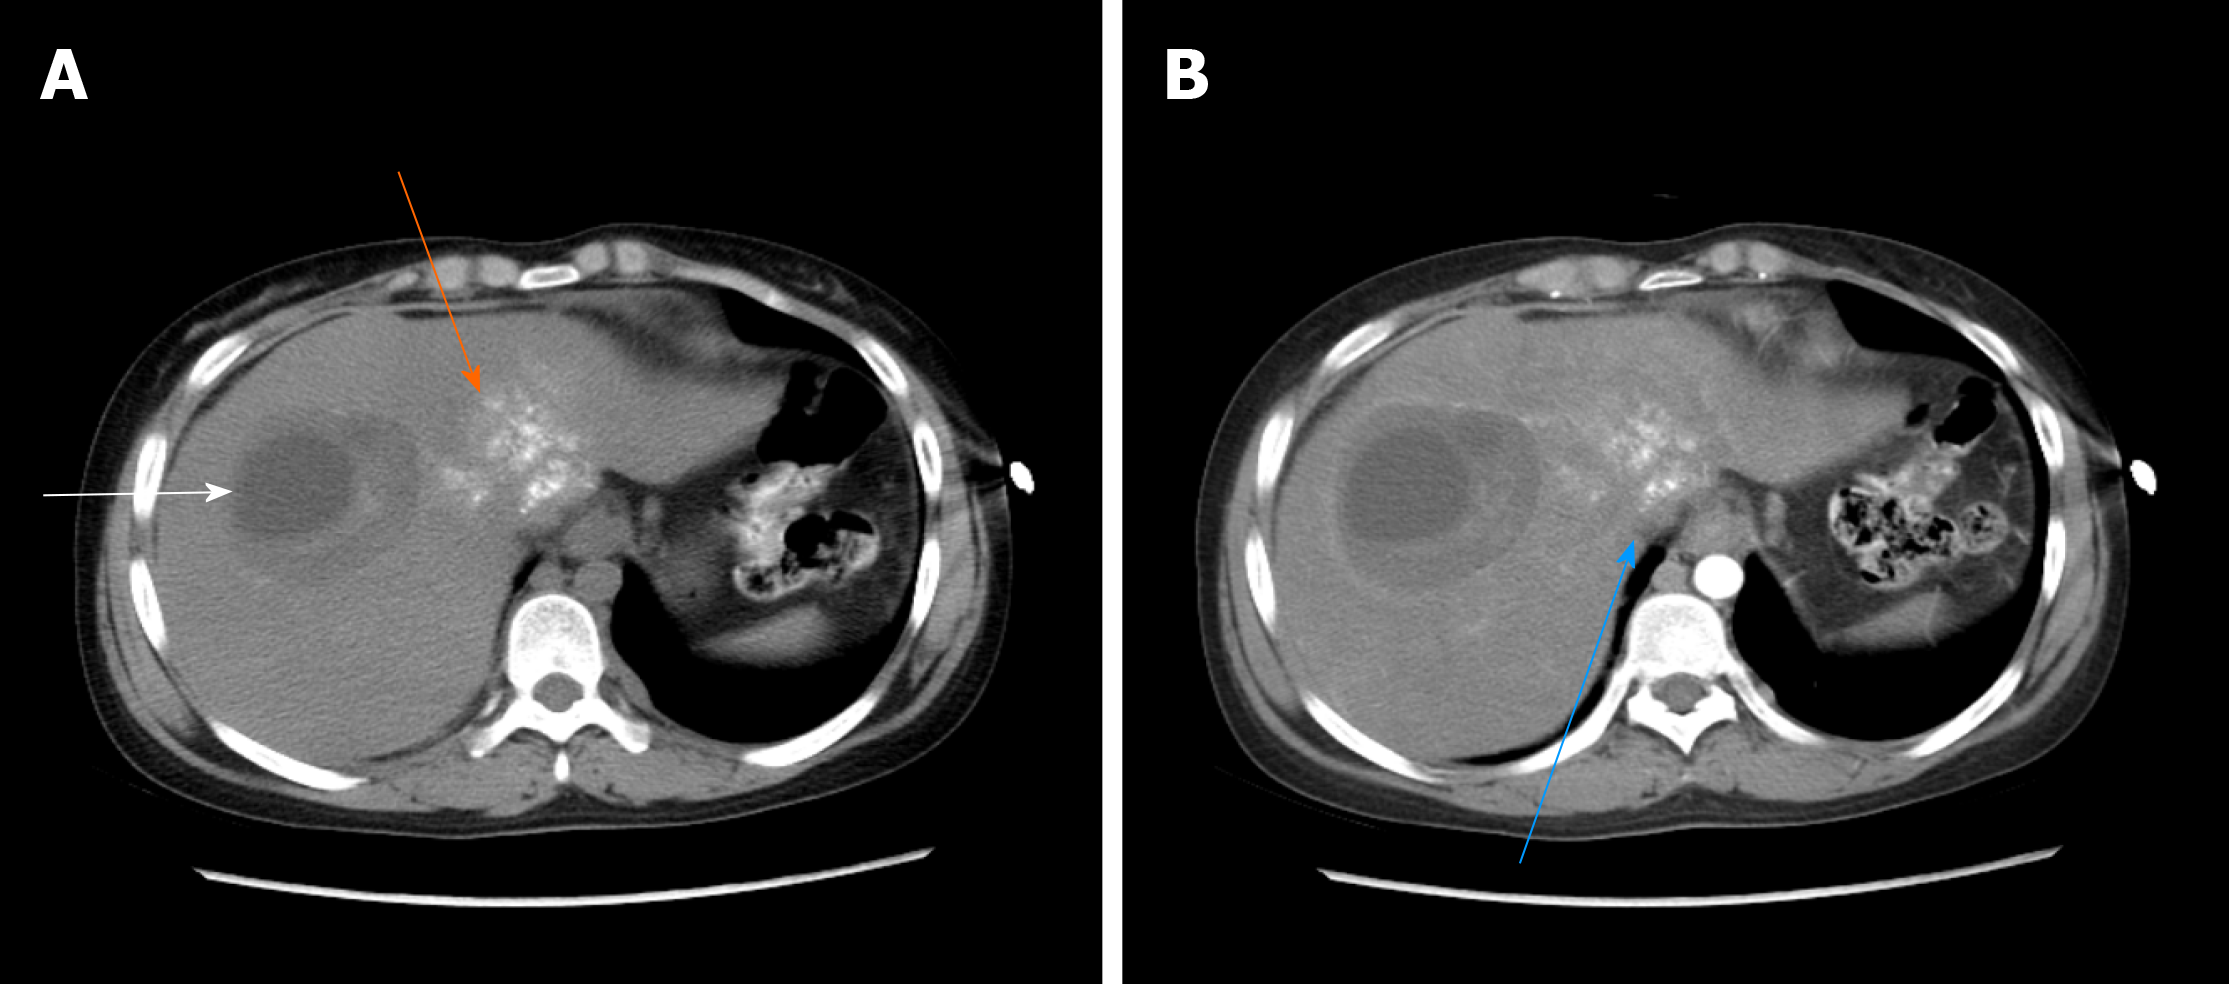
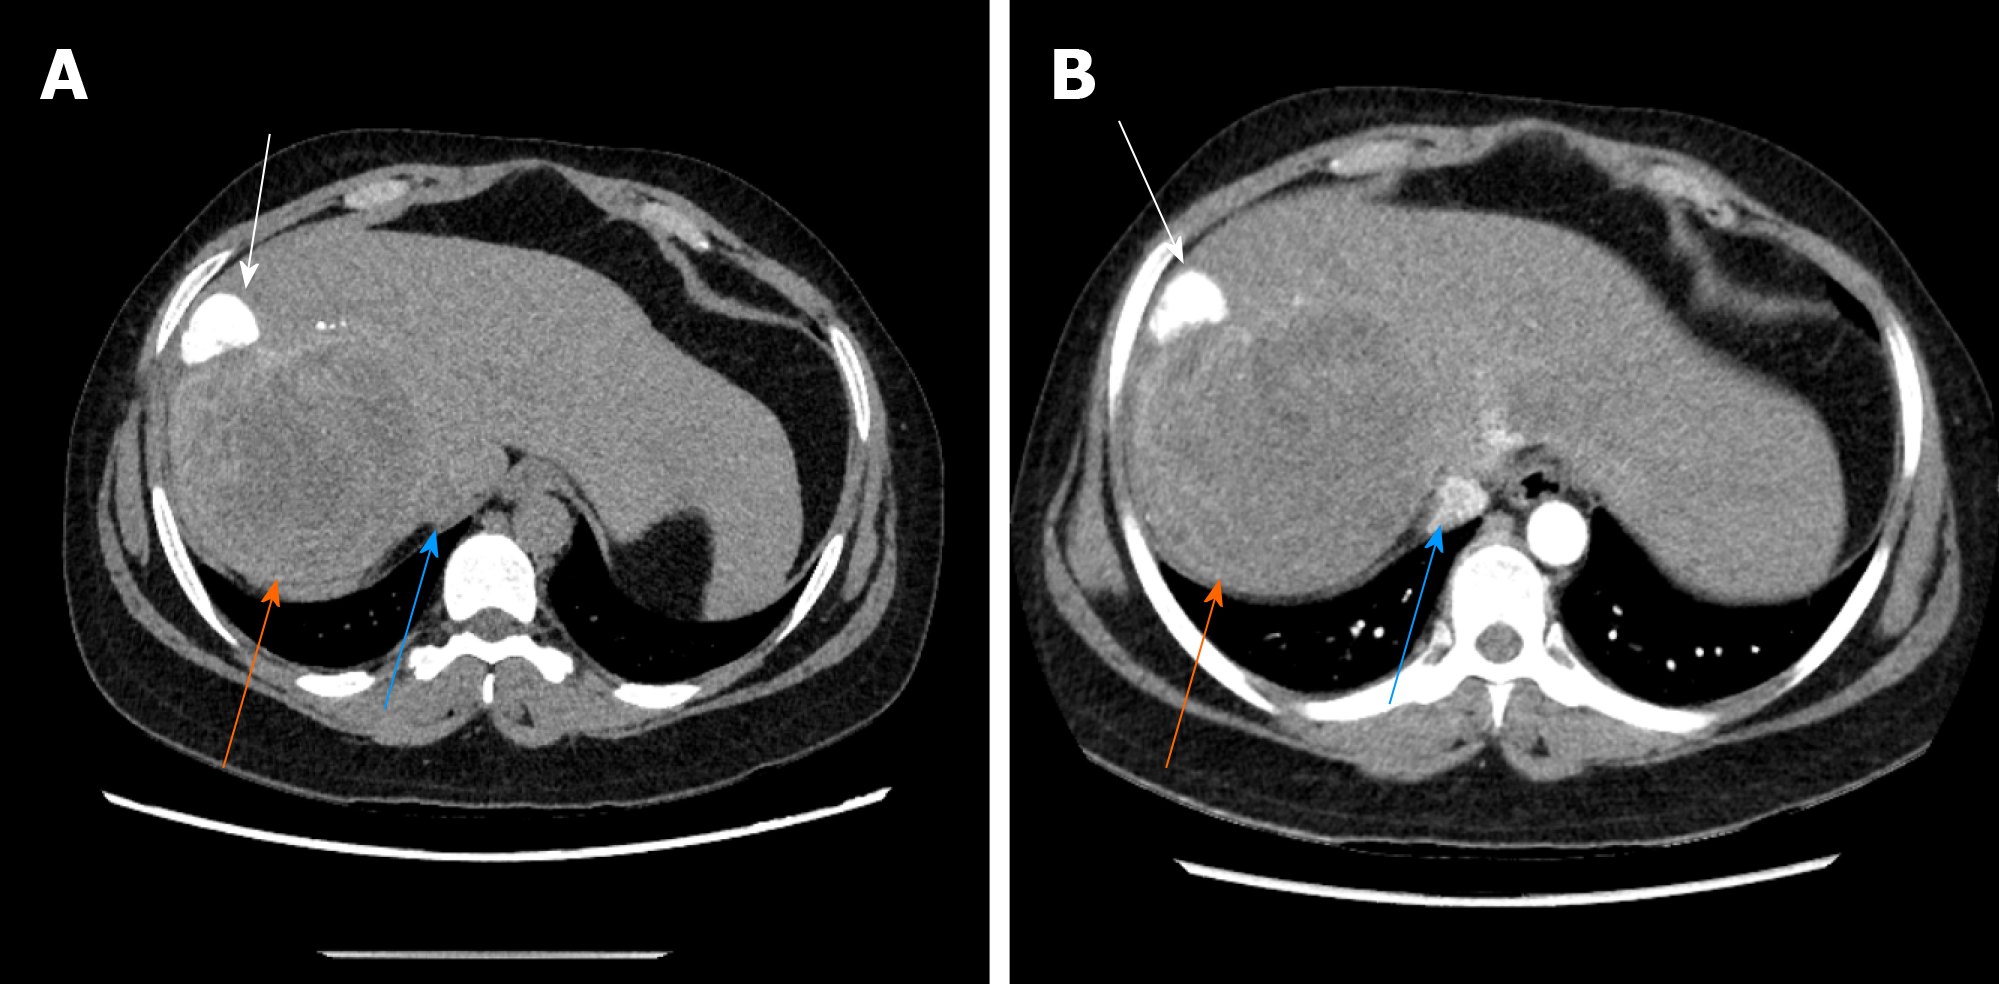
Figure 3 The second case of abdominal enhancement computed tomography.
A: The low-density shadow indicated by the white arrow is a cystic hydatid lesion, while the high-density shadow indicated by the orange arrow is an alveolar hydatid lesion; B: The blue arrow indicates the retrohepatic inferior vena cava.
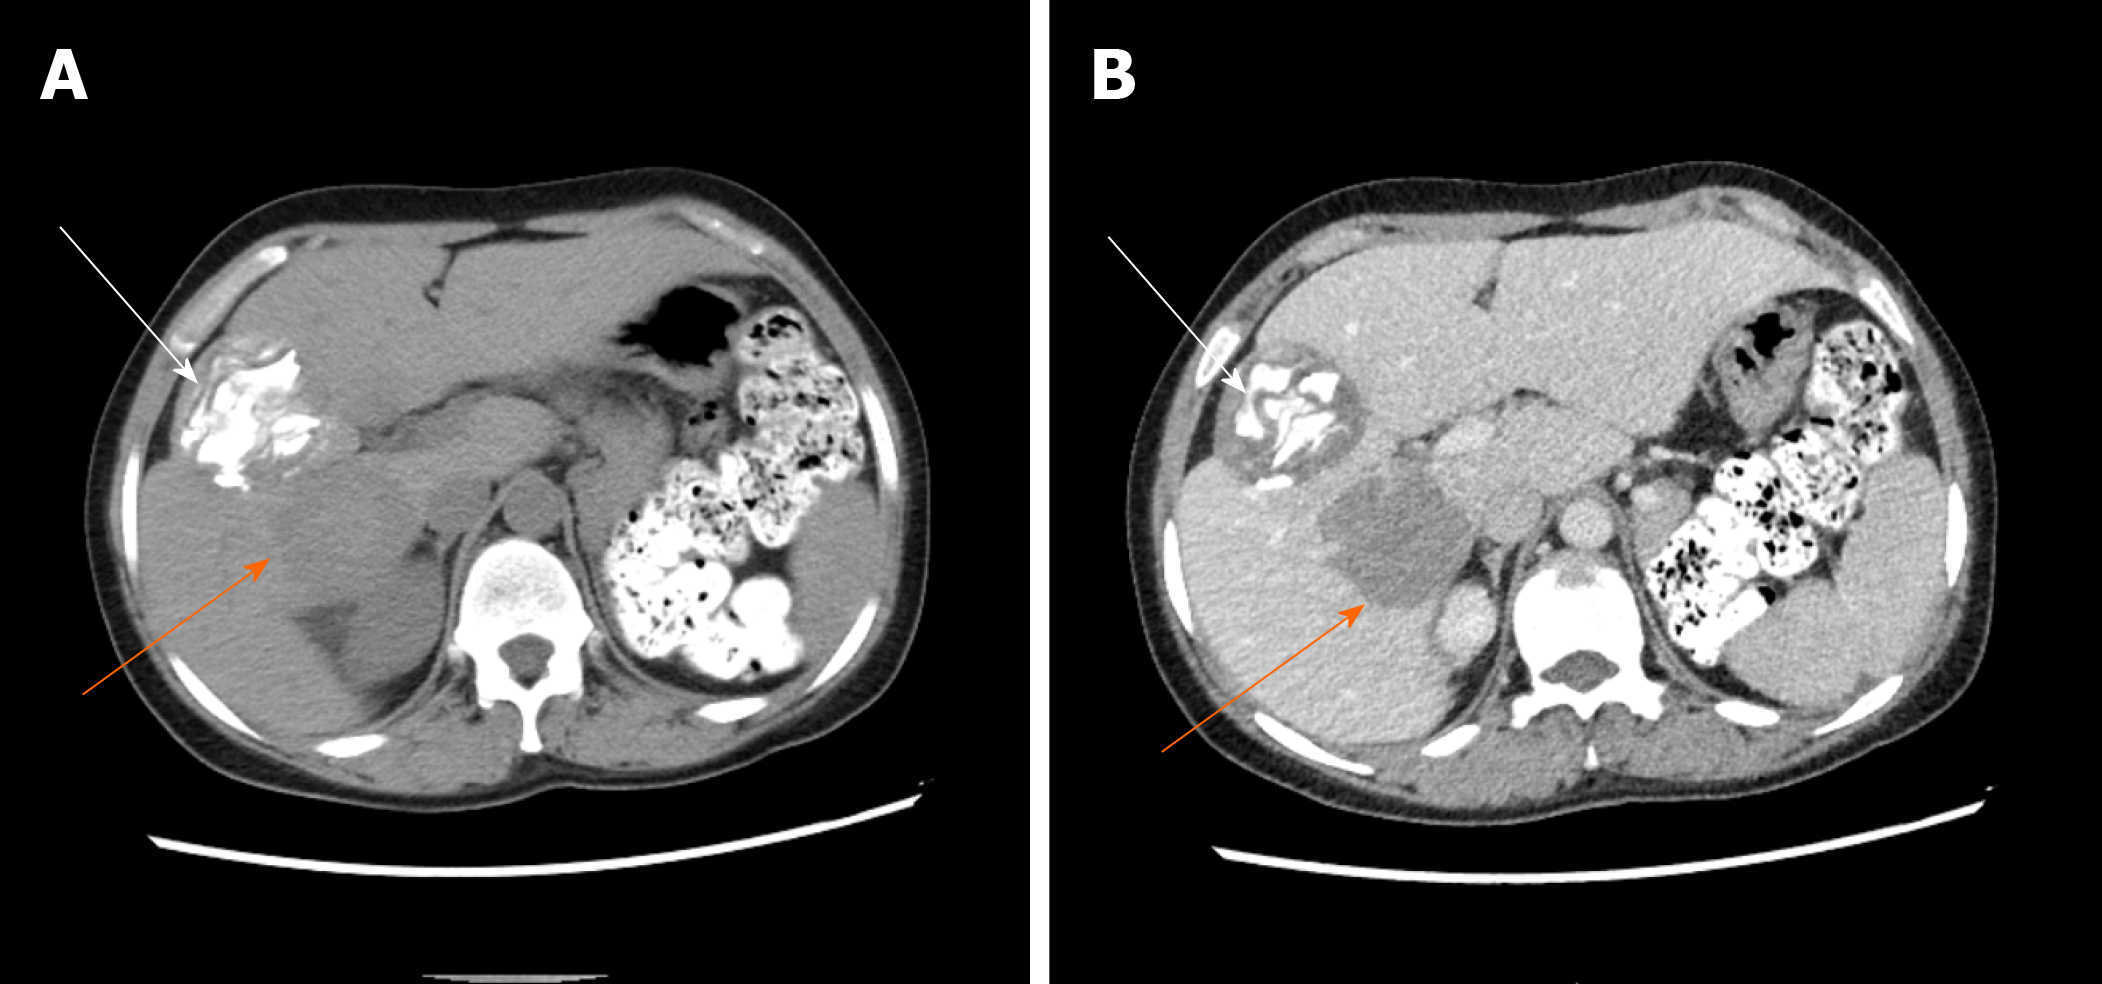
Figure 4 The third case of abdominal enhancement computed tomography.
A: The high-density shadow indicated by the white arrow is a cystic hydatid lesion, while the low-density shadow indicated by the orange arrow is an alveolar hydatid lesion; B: The blue arrow indicates the retrohepatic inferior vena cava.
Figure 5 The fourth case of abdominal enhancement computed tomography.
A, B: The white arrow shows cystic hydatid foci in high density, the orange arrow shows alveolar hydatid foci in low density, and the blue arrow shows posterior inferior vena cava in equal density.
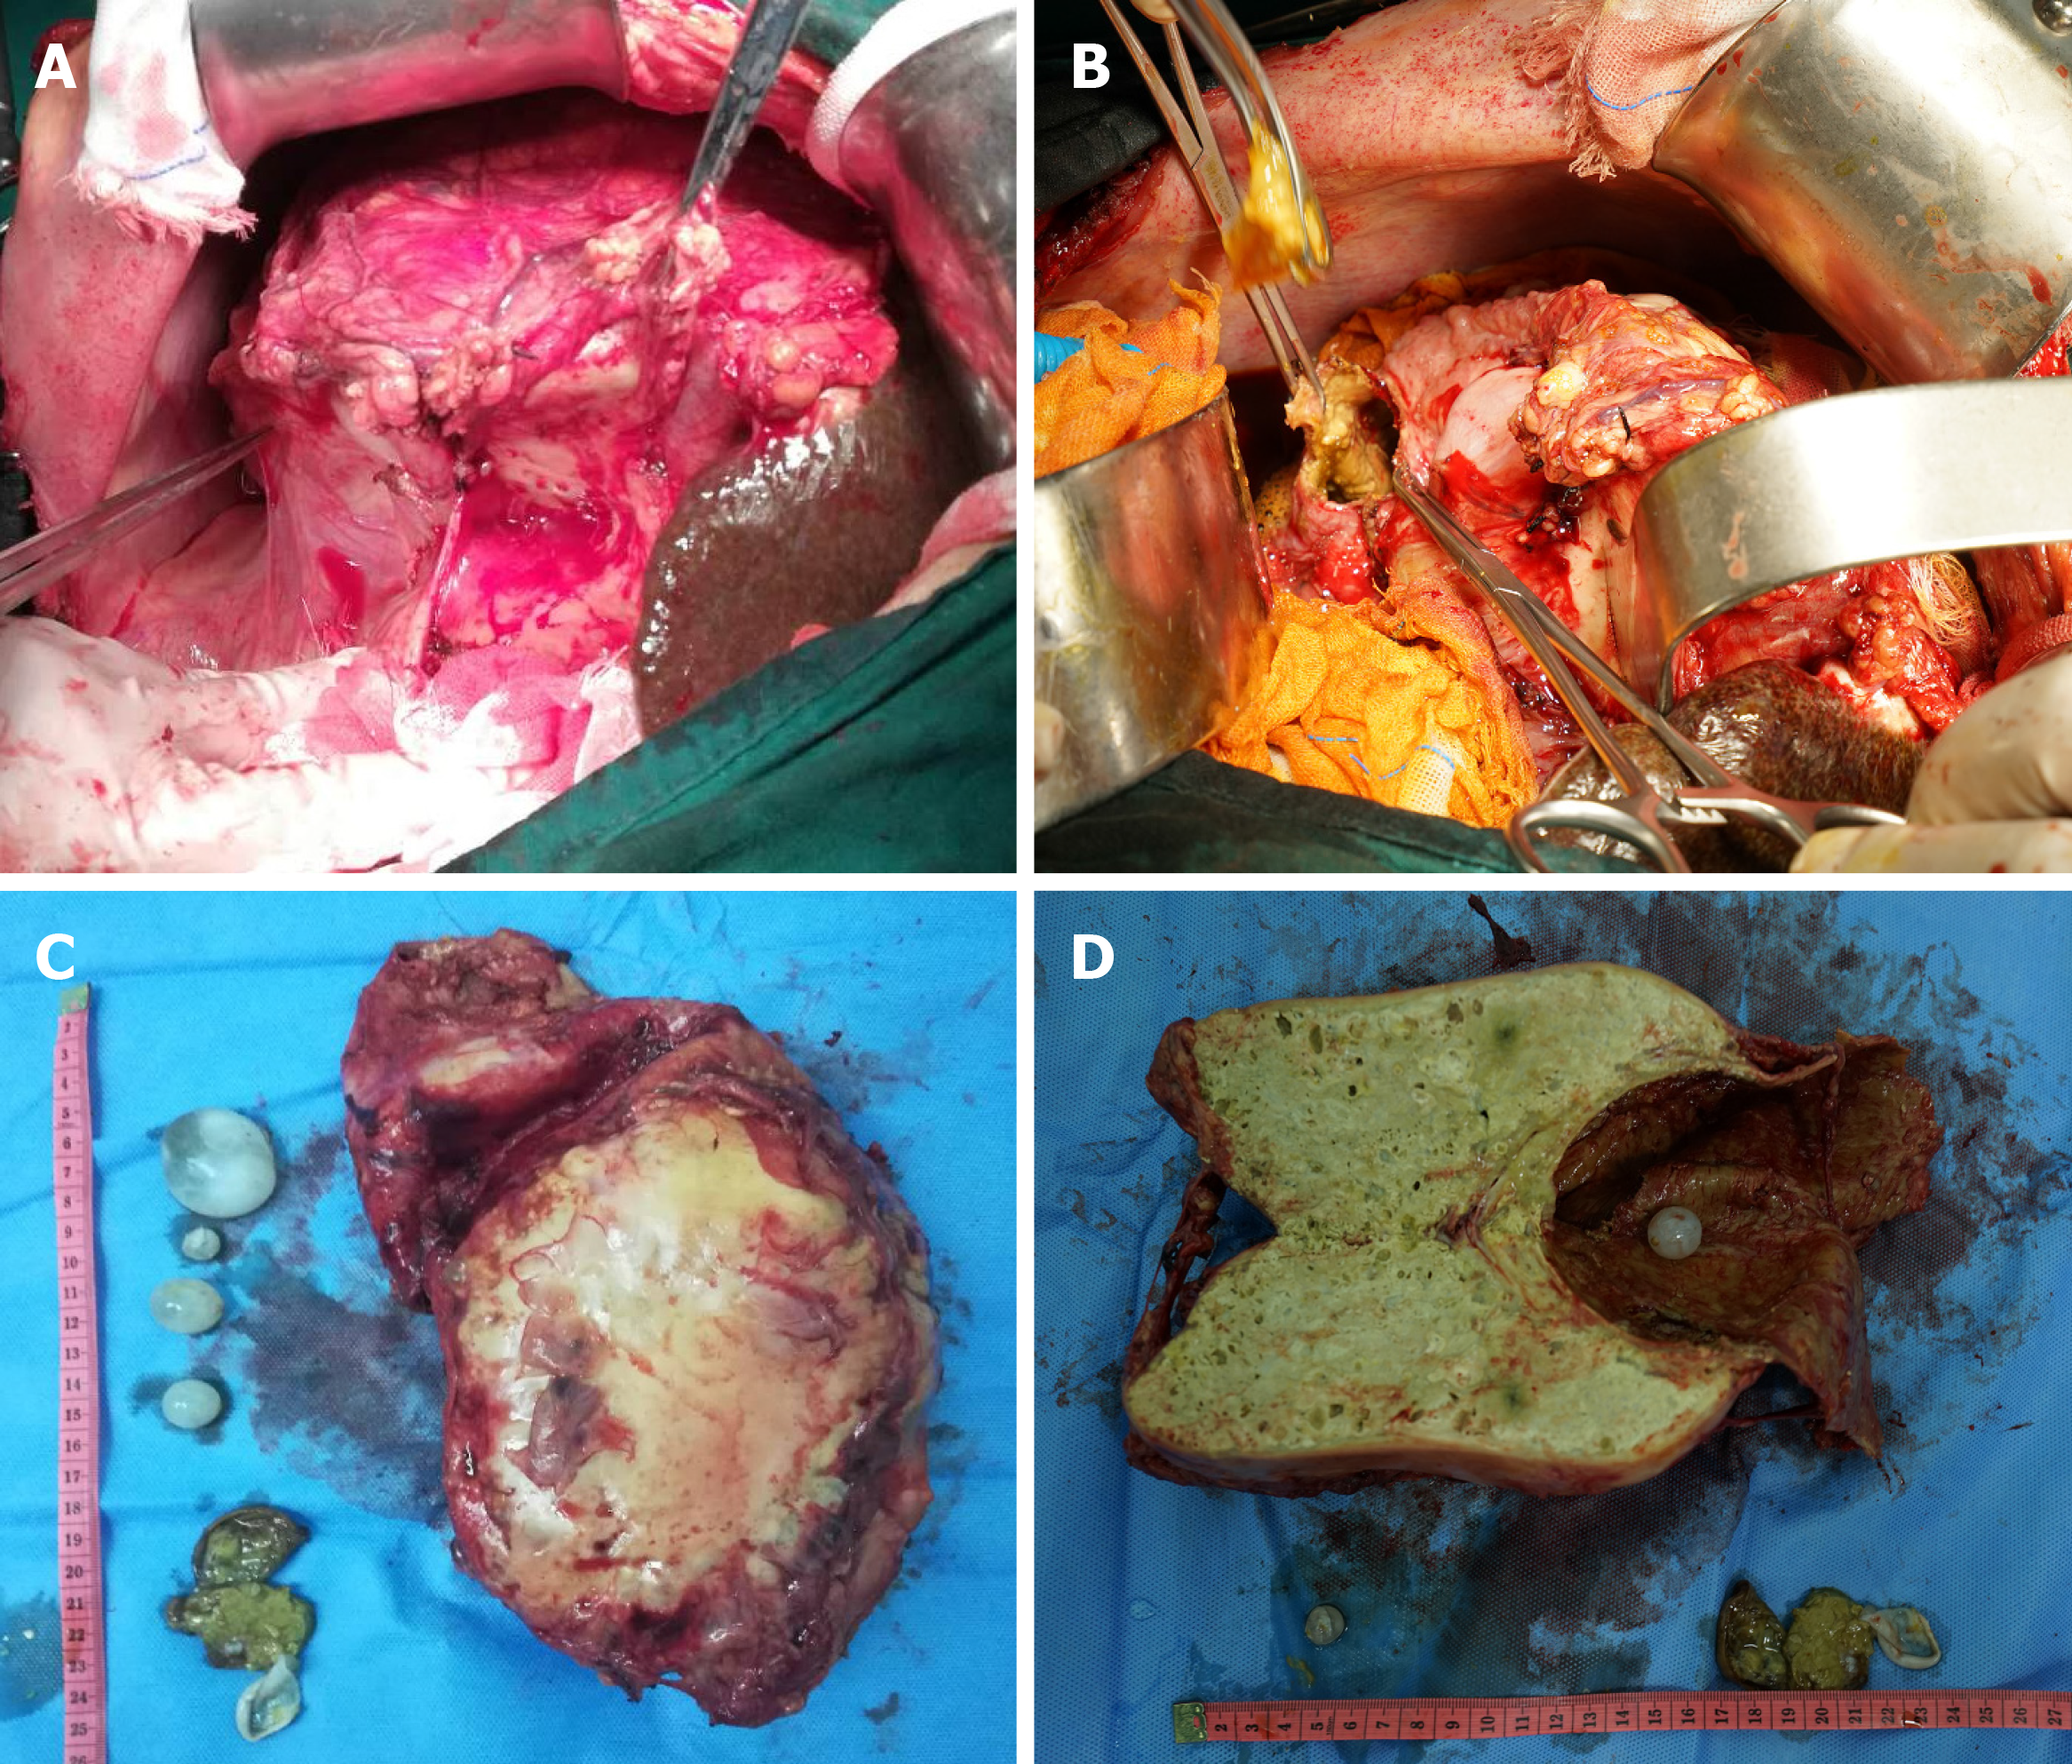
Figure 6 Extended right hepatectomy.
A: The structure indicated by the general tweezers is cystic echinococcosis, and the structure indicated by hemostatic forceps is alveolar echinococcosis; B: Since the operating space was narrow, vesiclectomy was performed for the cystic echinococcosis, and cystectomy was then performed after decompression; C: The front view of the specimen, which showed that there were cysts and cystic tissue; D: There were small cysts and cystic tissue of echinococcosis after opening the lesion.
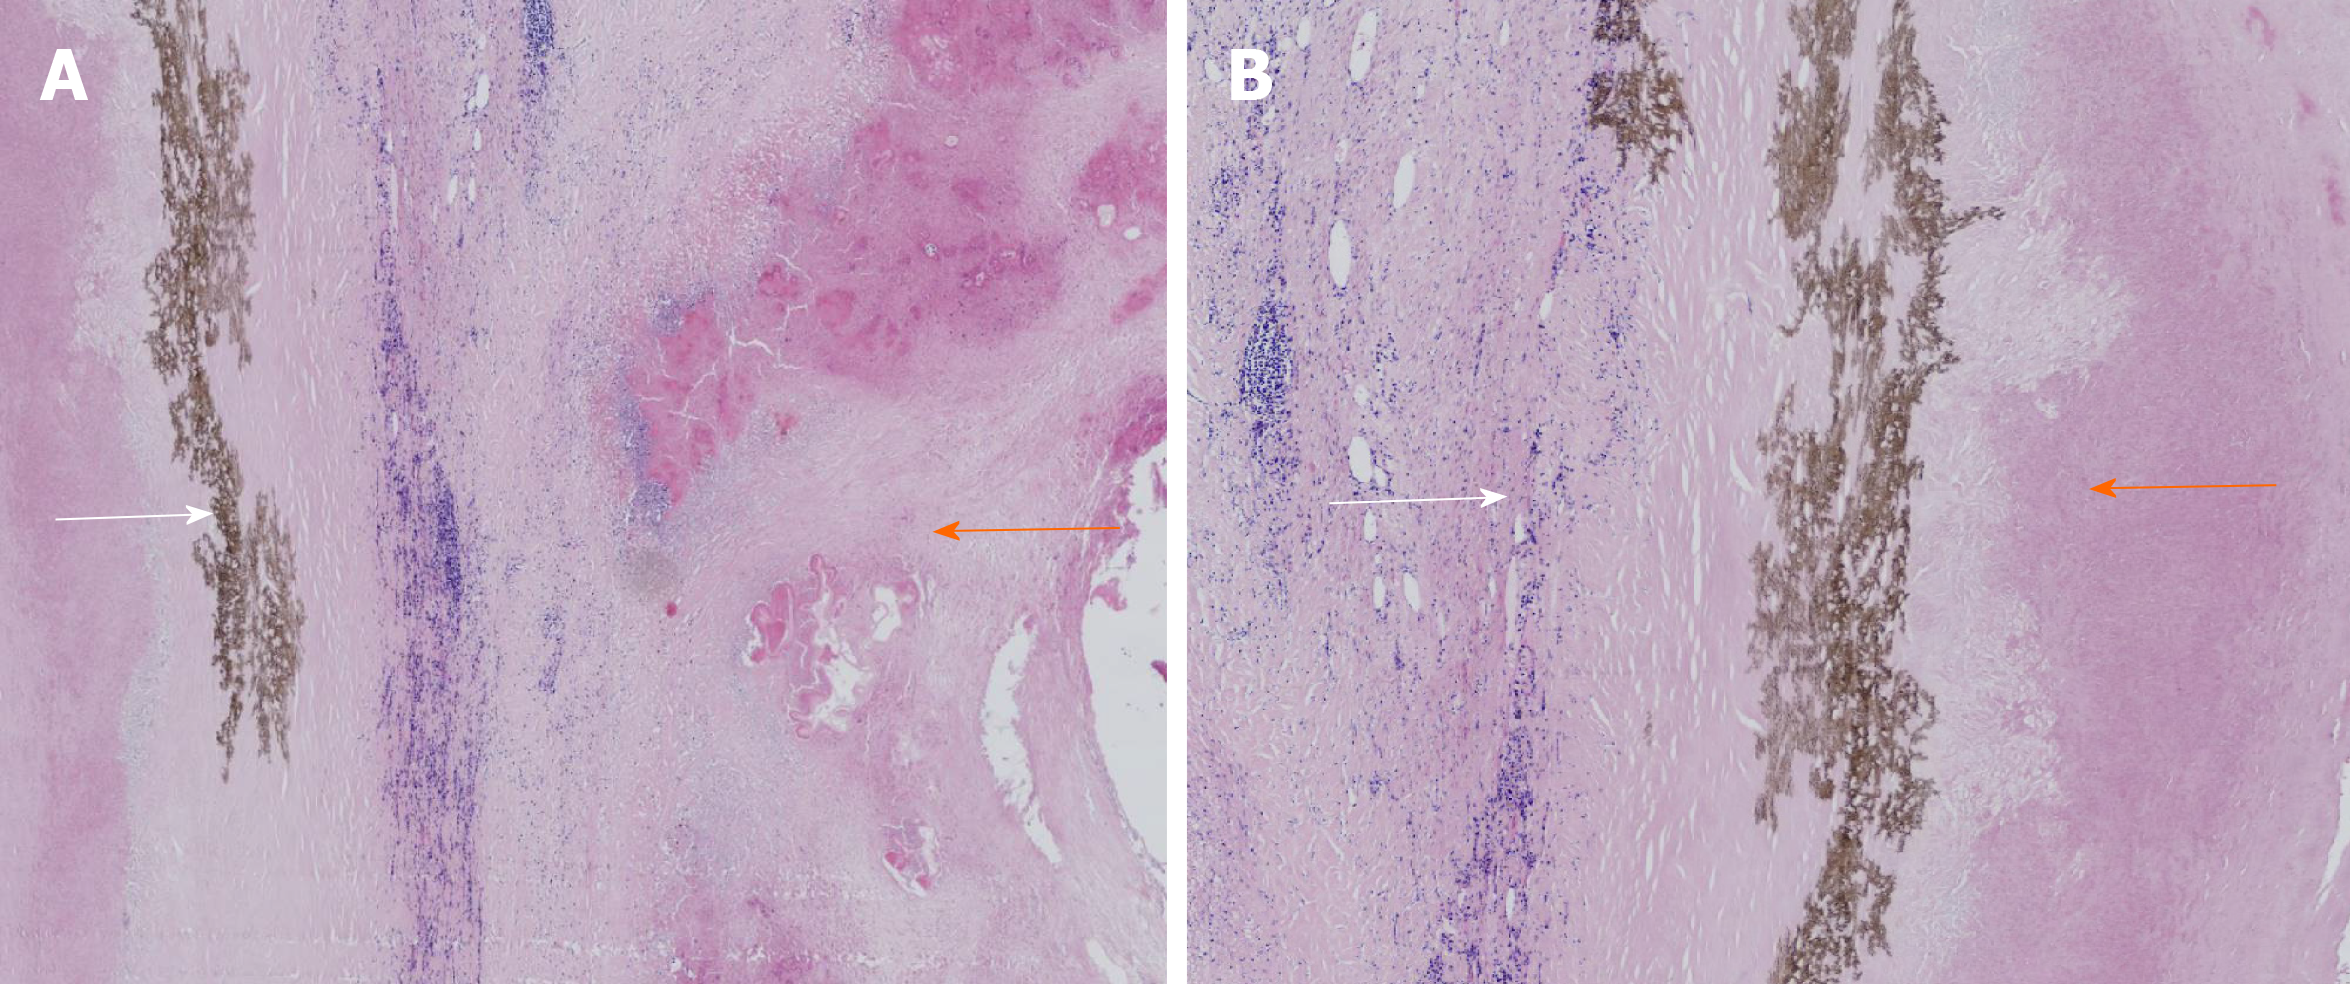
Figure 7 Postoperative pathology.
A: The purple tissues indicated by the orange arrows are alveolar echinococcosis, the brown tissues indicated by the white arrows are necrotic cystic tissues that represent cystic echinococcosis; B: The purple tissues indicated by the orange arrows are alveolar echinococcosis, and the brown tissues indicated by the white arrows are necrotic cystic tissues that represent cystic echinococcosis.
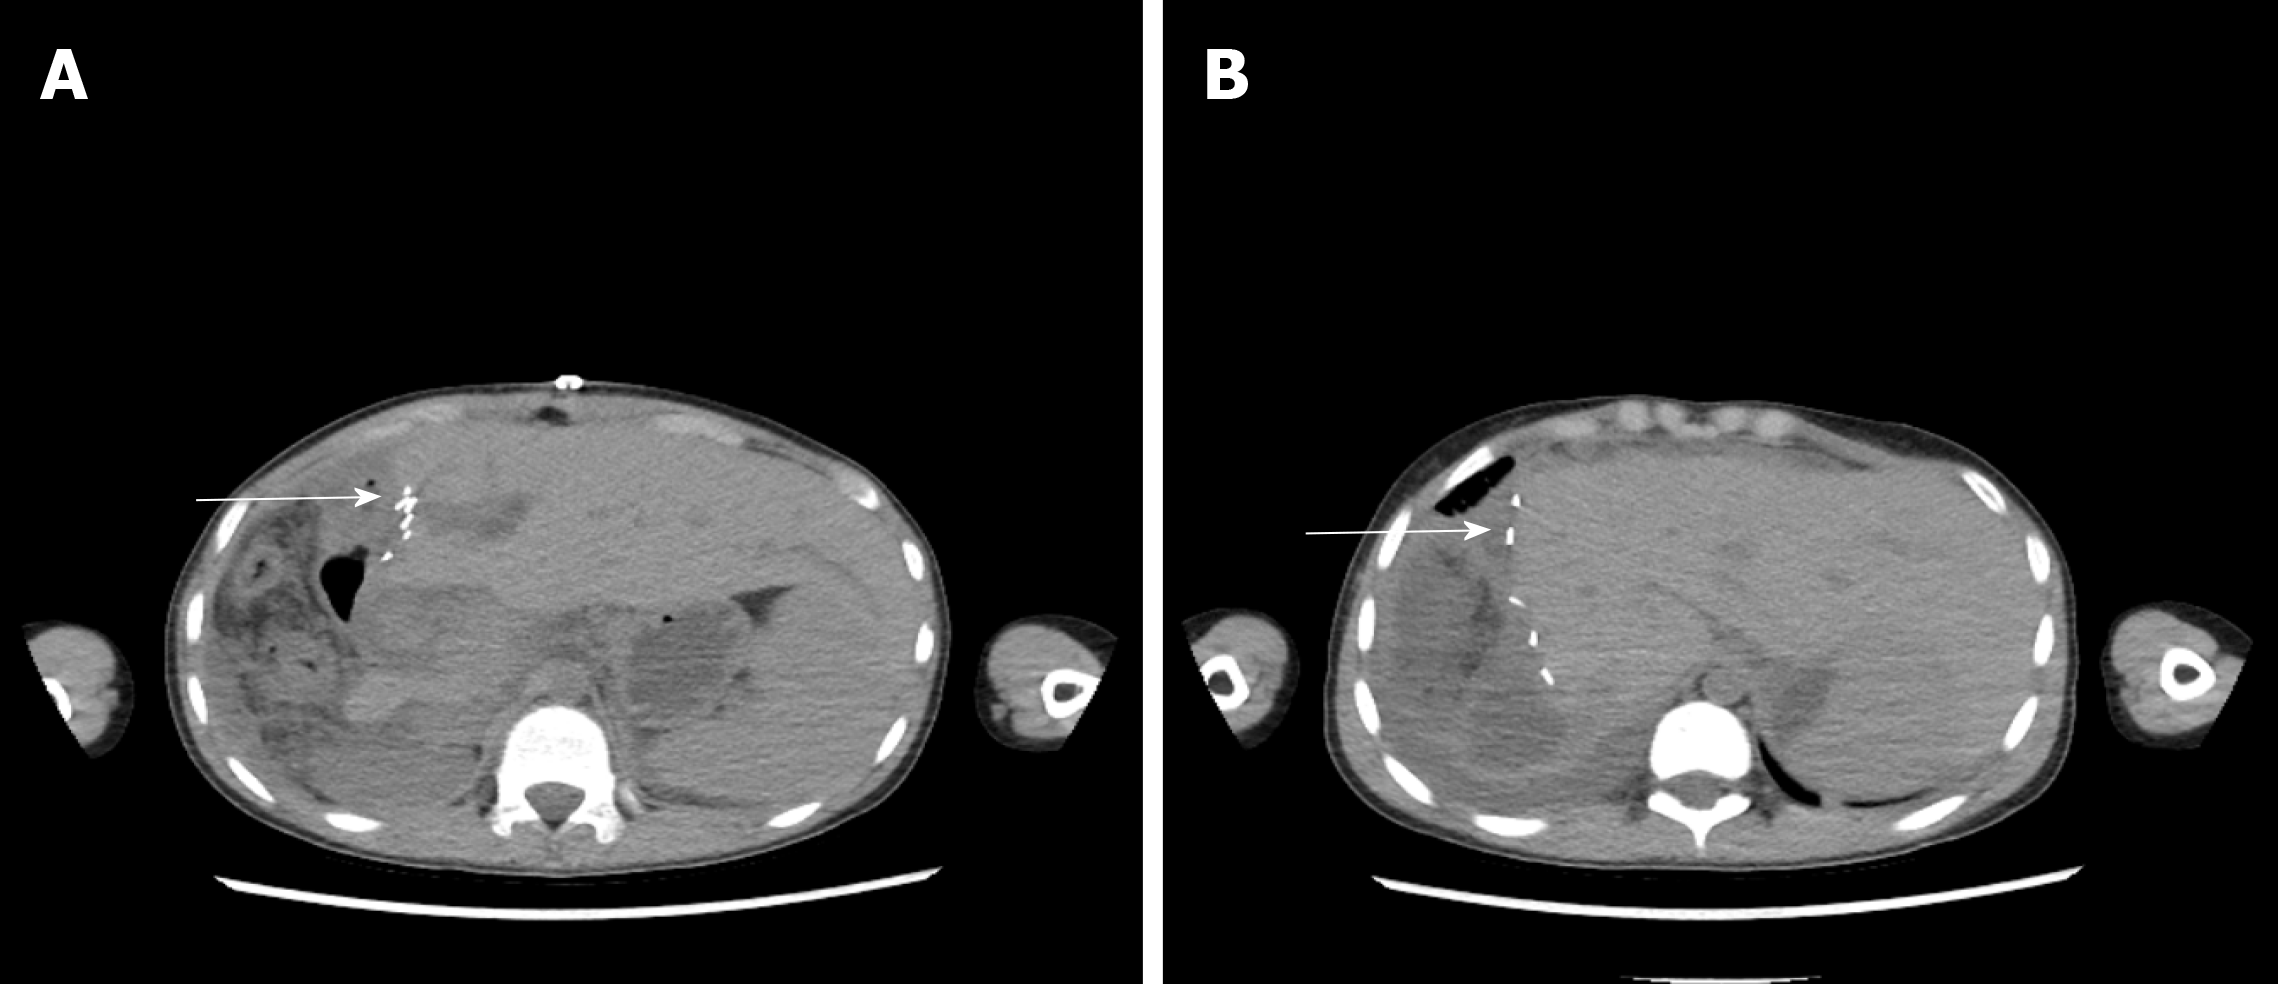
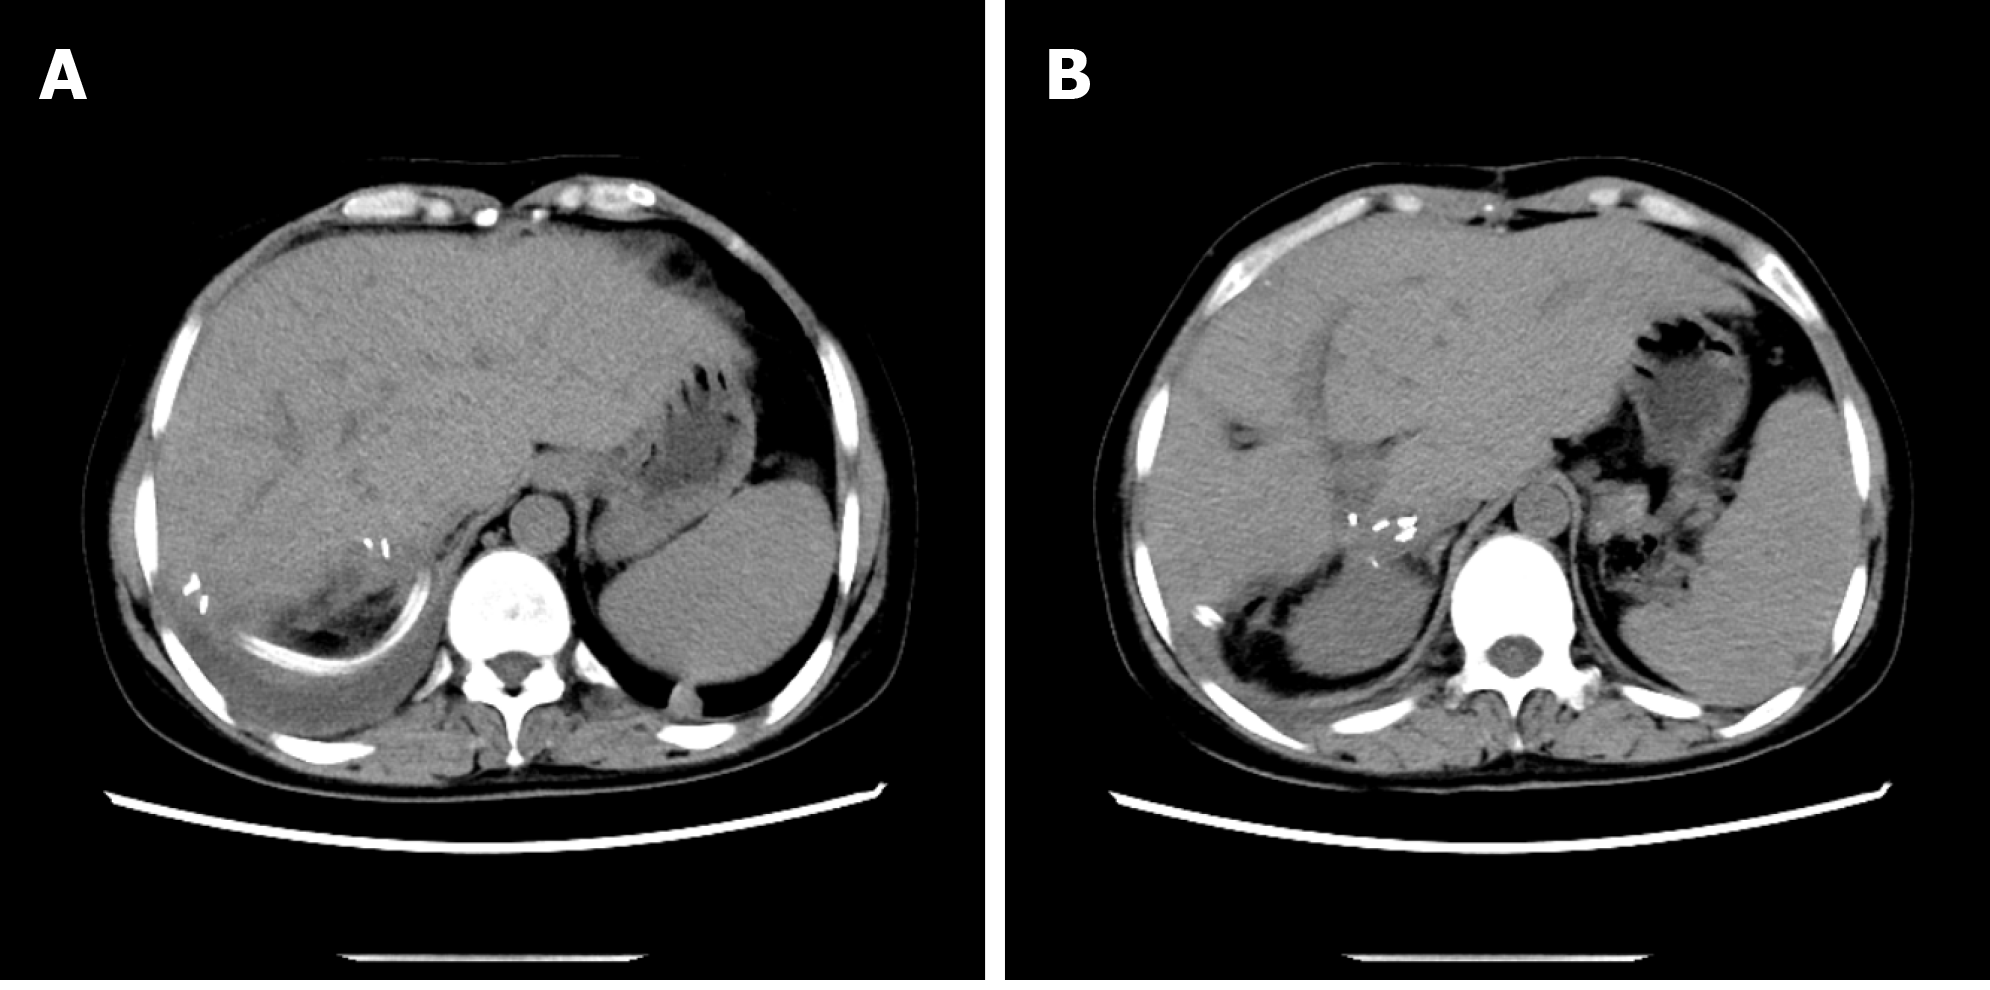
Figure 8 Review of abdominal computed tomography.
A: The high-density shadow indicated by the white arrow represents metal titanic clips; B: Hyperplasia of the residual liver was good, and there was no recurrence of echinococcosis.
Figure 9 One of the three patients who underwent hepatic hydatid lesion resection again.
A, B: Computed tomography scan 1.5 yr after the operation showed that the lesion of the hepatic S1 segment alveolar echinococcosis still existed, as indicated by the orange arrow. Segments S7 and 8 are the residual cystic cavity of the hydatid cyst, which is indicated by the white arrow; B: The S1 segment of the alveolar hydatid lesions invaded the retrohepatic inferior vena cava. The liver showed congestion-like changes. The blue arrow indicates the retrohepatic inferior vena cava.
Figure 10 At 1 mo after operation, there was no fluid in the abdominal drainage tube, and there was no hydrocele in the abdominal cavity and good liver hyperplasia (A, B).
The high-density image in the picture is a metal titanium clip.
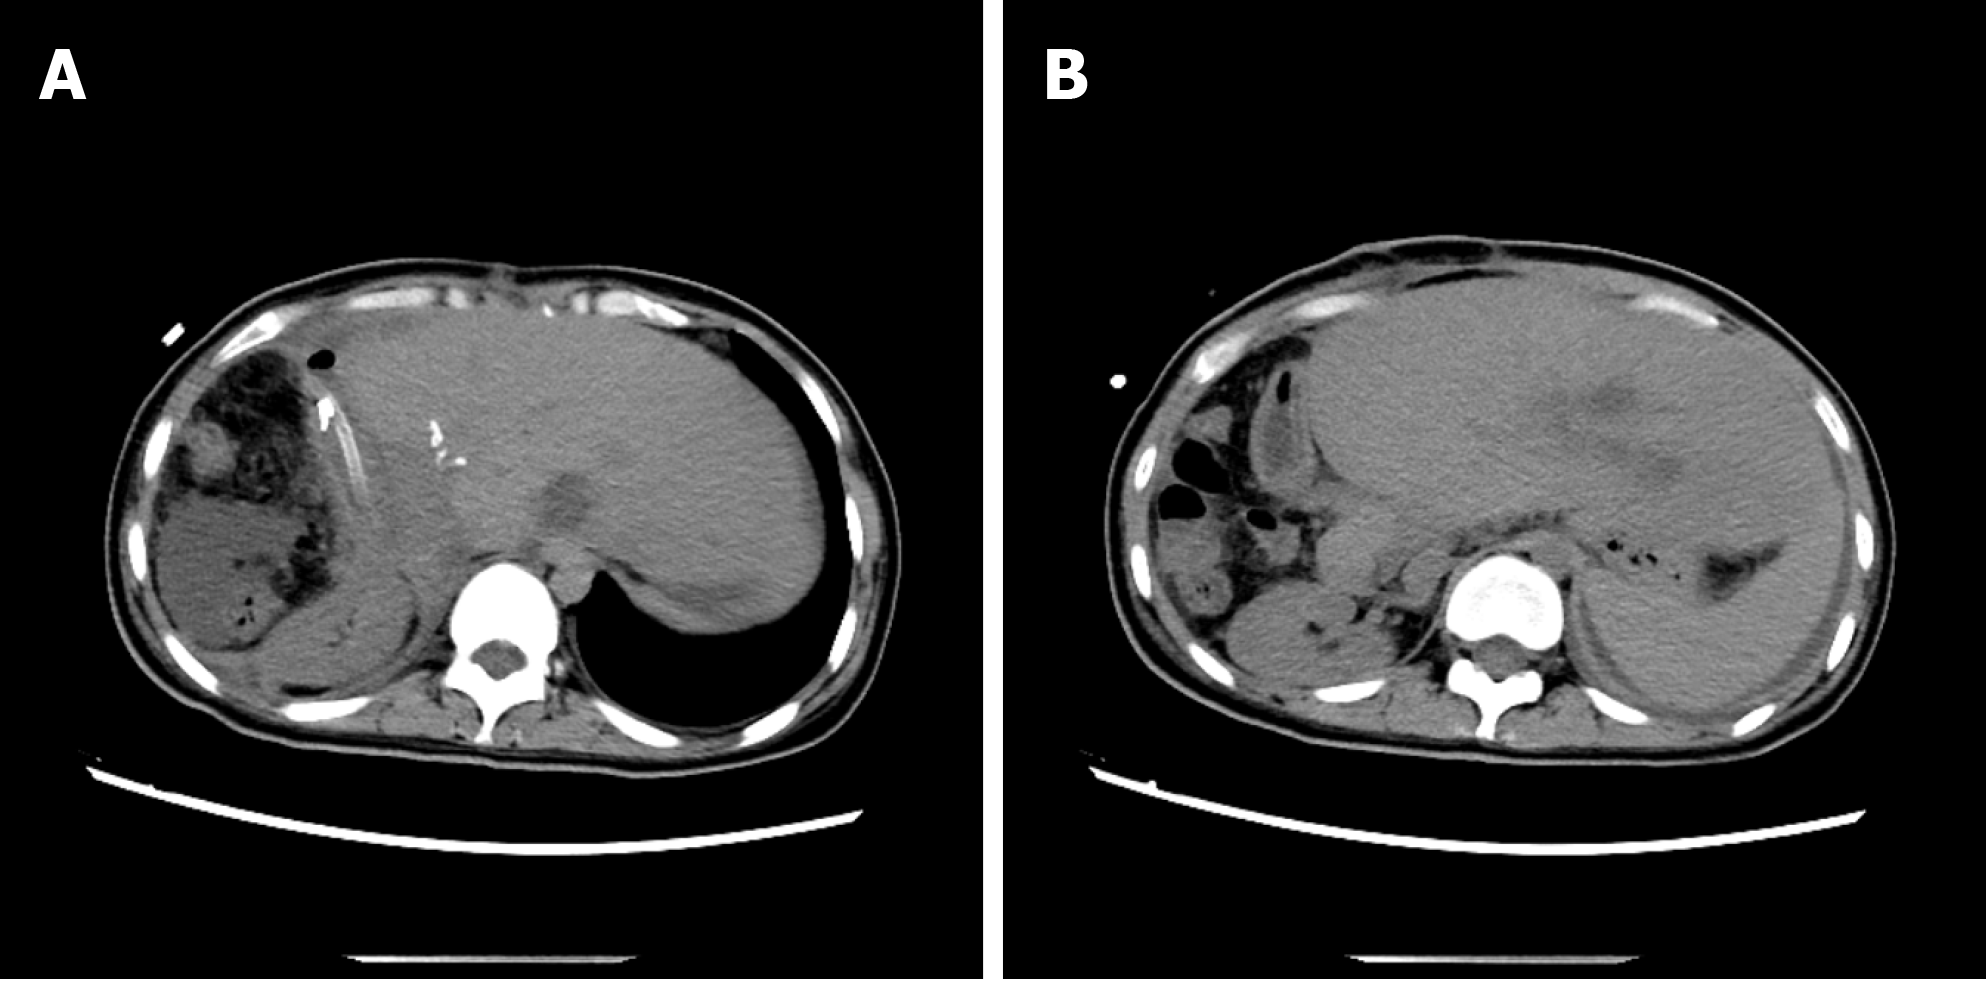
Figure 11 At 3 mo after operation, a small amount of yellowish pus (10-20 mL/24 h) still remained in the abdominal drainage tube (A and B).
Abdominal computed tomography showed that the compensatory increase of the left lobe of liver and the absorption of the peritoneal effusion were obvious. The high-density image in the picture is a metal titanium clip.
- Citation: A JD, Chai JP, Wang H, Gao W, Peng Z, Zhao SY, A XR. Diagnosis and treatment of mixed infection of hepatic cystic and alveolar echinococcosis: Four case reports. World J Clin Cases 2020; 8(17): 3911-3919
- URL: https://www.wjgnet.com/2307-8960/full/v8/i17/3911.htm
- DOI: https://dx.doi.org/10.12998/wjcc.v8.i17.3911


