©The Author(s) 2020.
World J Clin Cases. Jul 26, 2020; 8(14): 3122-3129
Published online Jul 26, 2020. doi: 10.12998/wjcc.v8.i14.3122
Published online Jul 26, 2020. doi: 10.12998/wjcc.v8.i14.3122
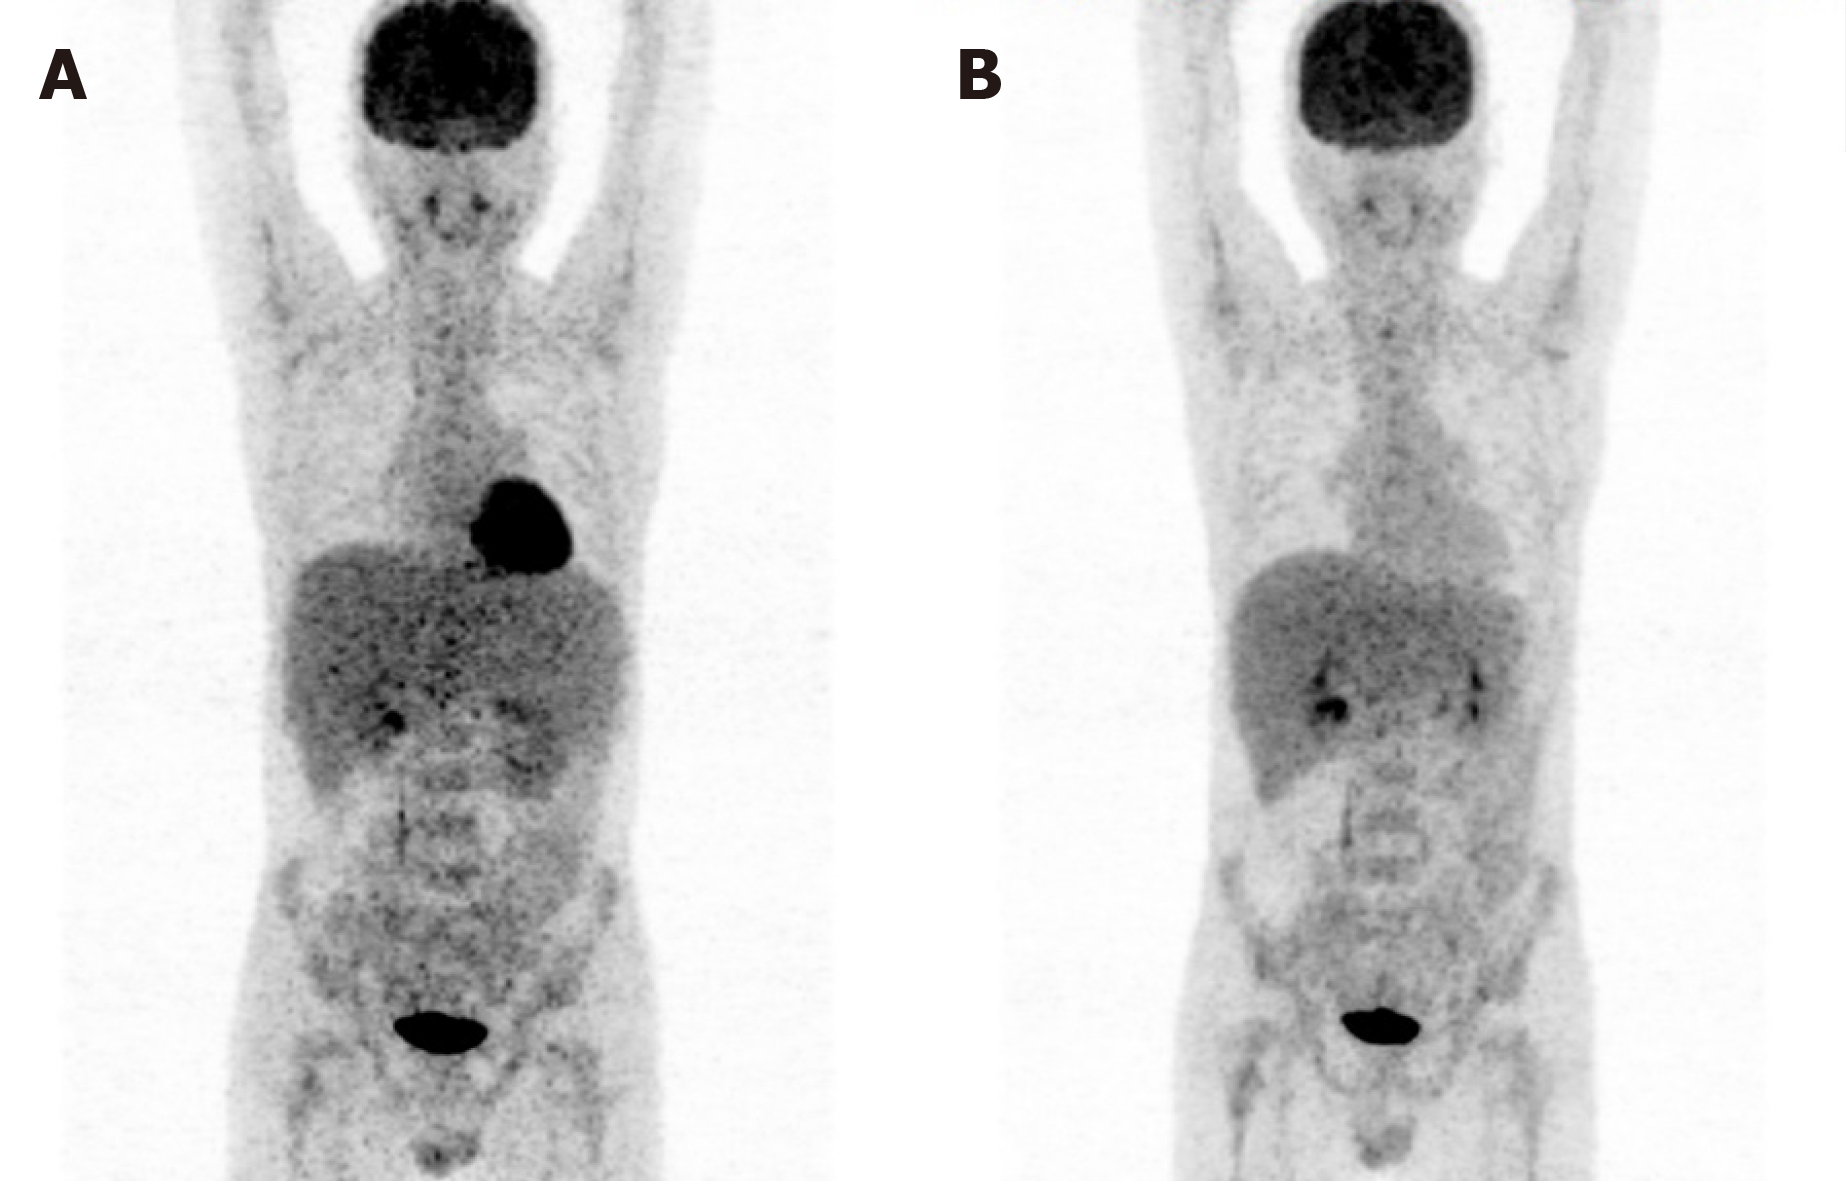
Figure 1 Baseline and follow-up positron emission tomography-computed tomography, which show the size and metabolism of the liver and spleen.
A: During the first hospital visit, the patient showed significant enlargement of the spleen and mildly abnormal fluorodeoxyglucose accumulation in the spleen and liver; B: After chidamide combination therapy, no increased metabolism was observed in the liver.
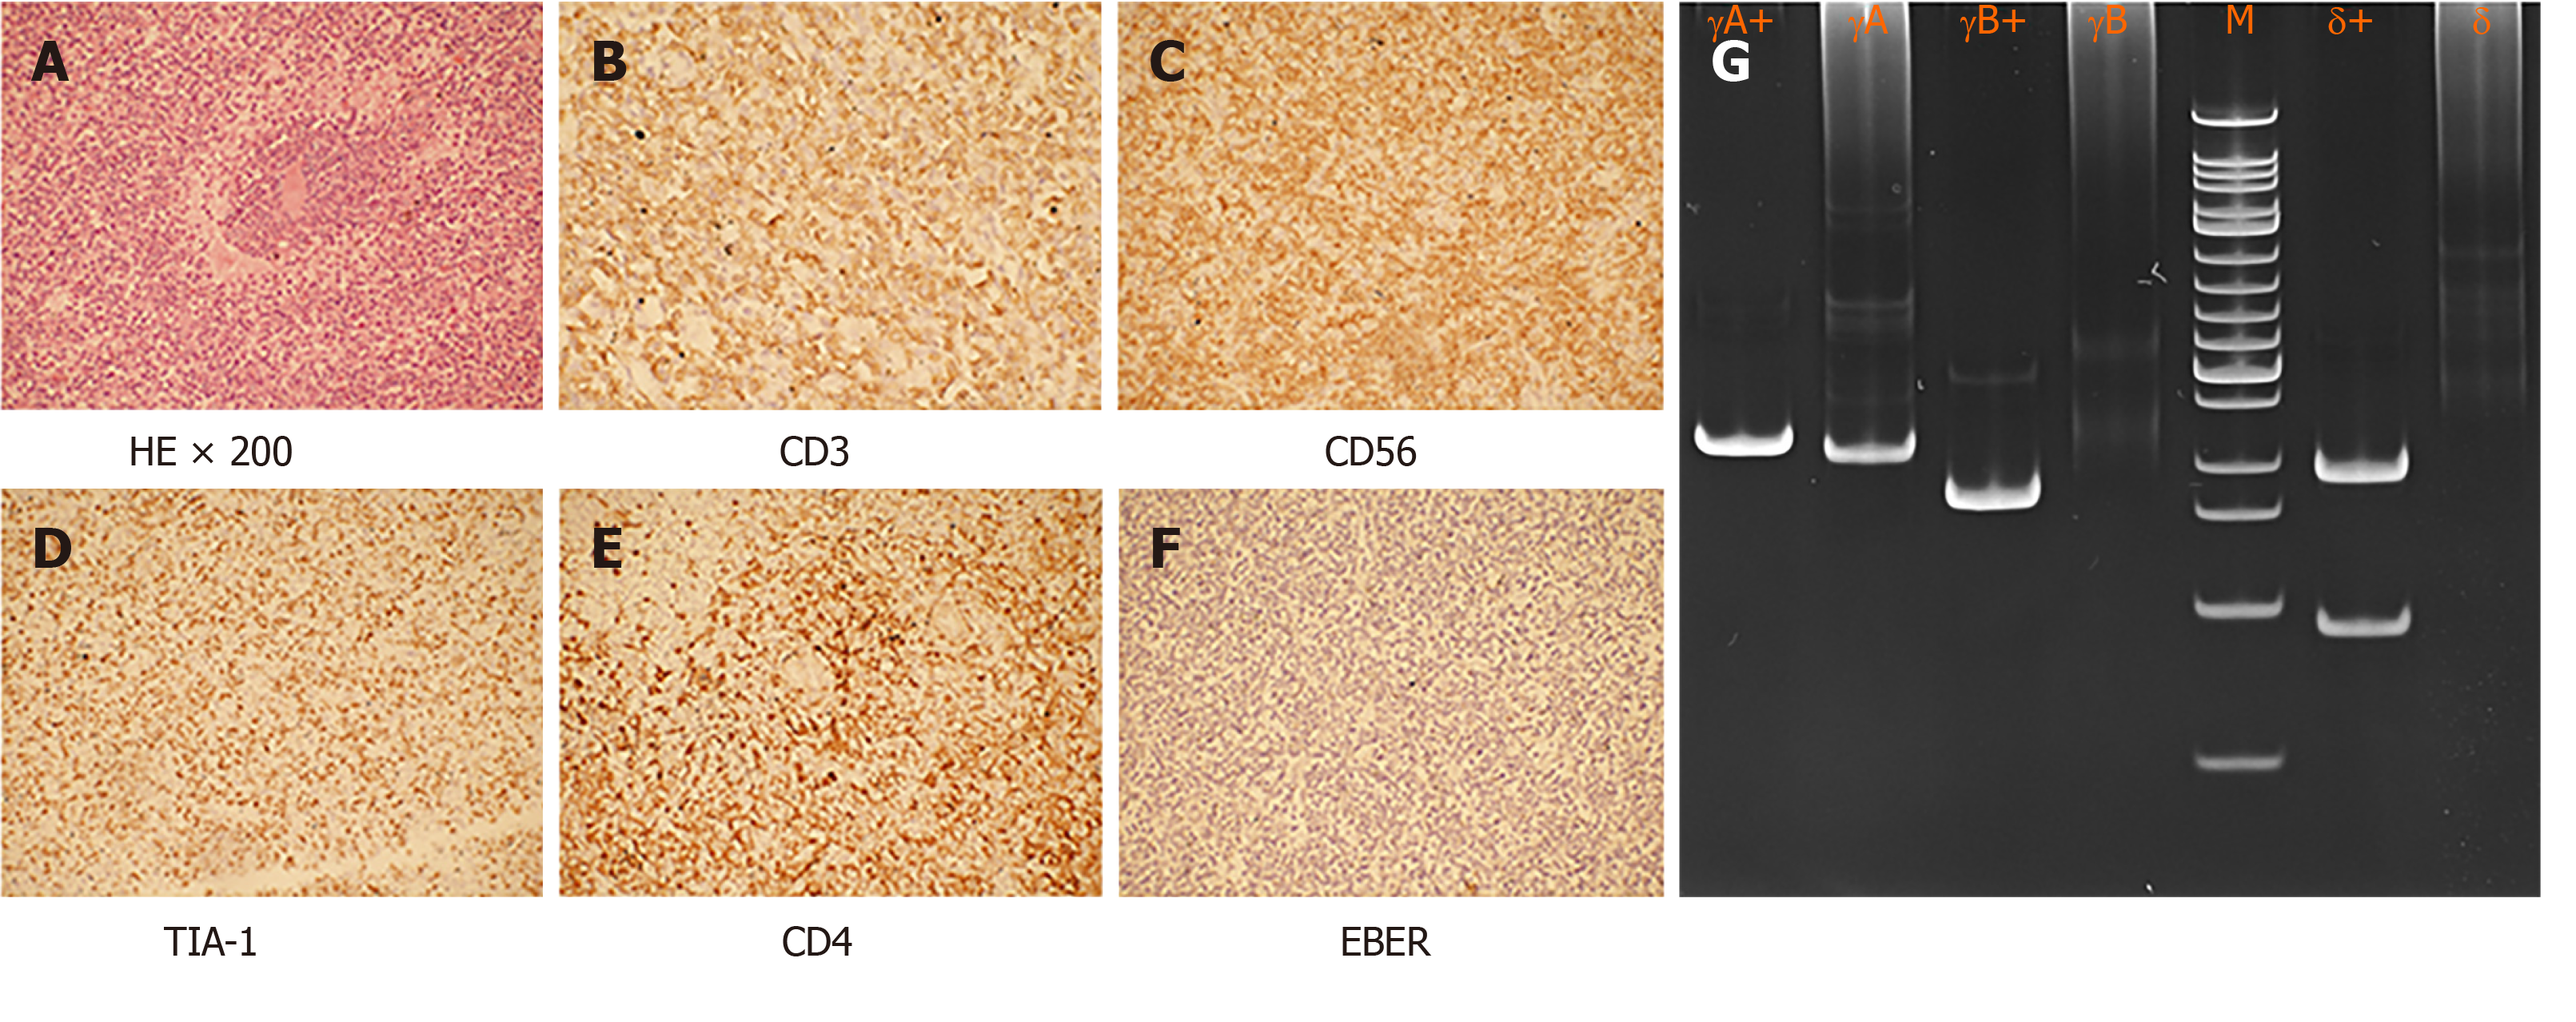
Figure 2 Morphology and immunohistochemistry analysis of spleen.
A: Spleen shows atypical lymphocytes within the sinusoids; B-F: These cells tested positive for CD3, CD56, CD4, and TIA-1 but negative for Epstein-Barr virus-encoded RNA on in situ hybridization (20 × objective); G: Gene studies demonstrate T-cell receptor-γδ clonal re-arrangements. EBER: Epstein-Barr virus-encoded RNA.
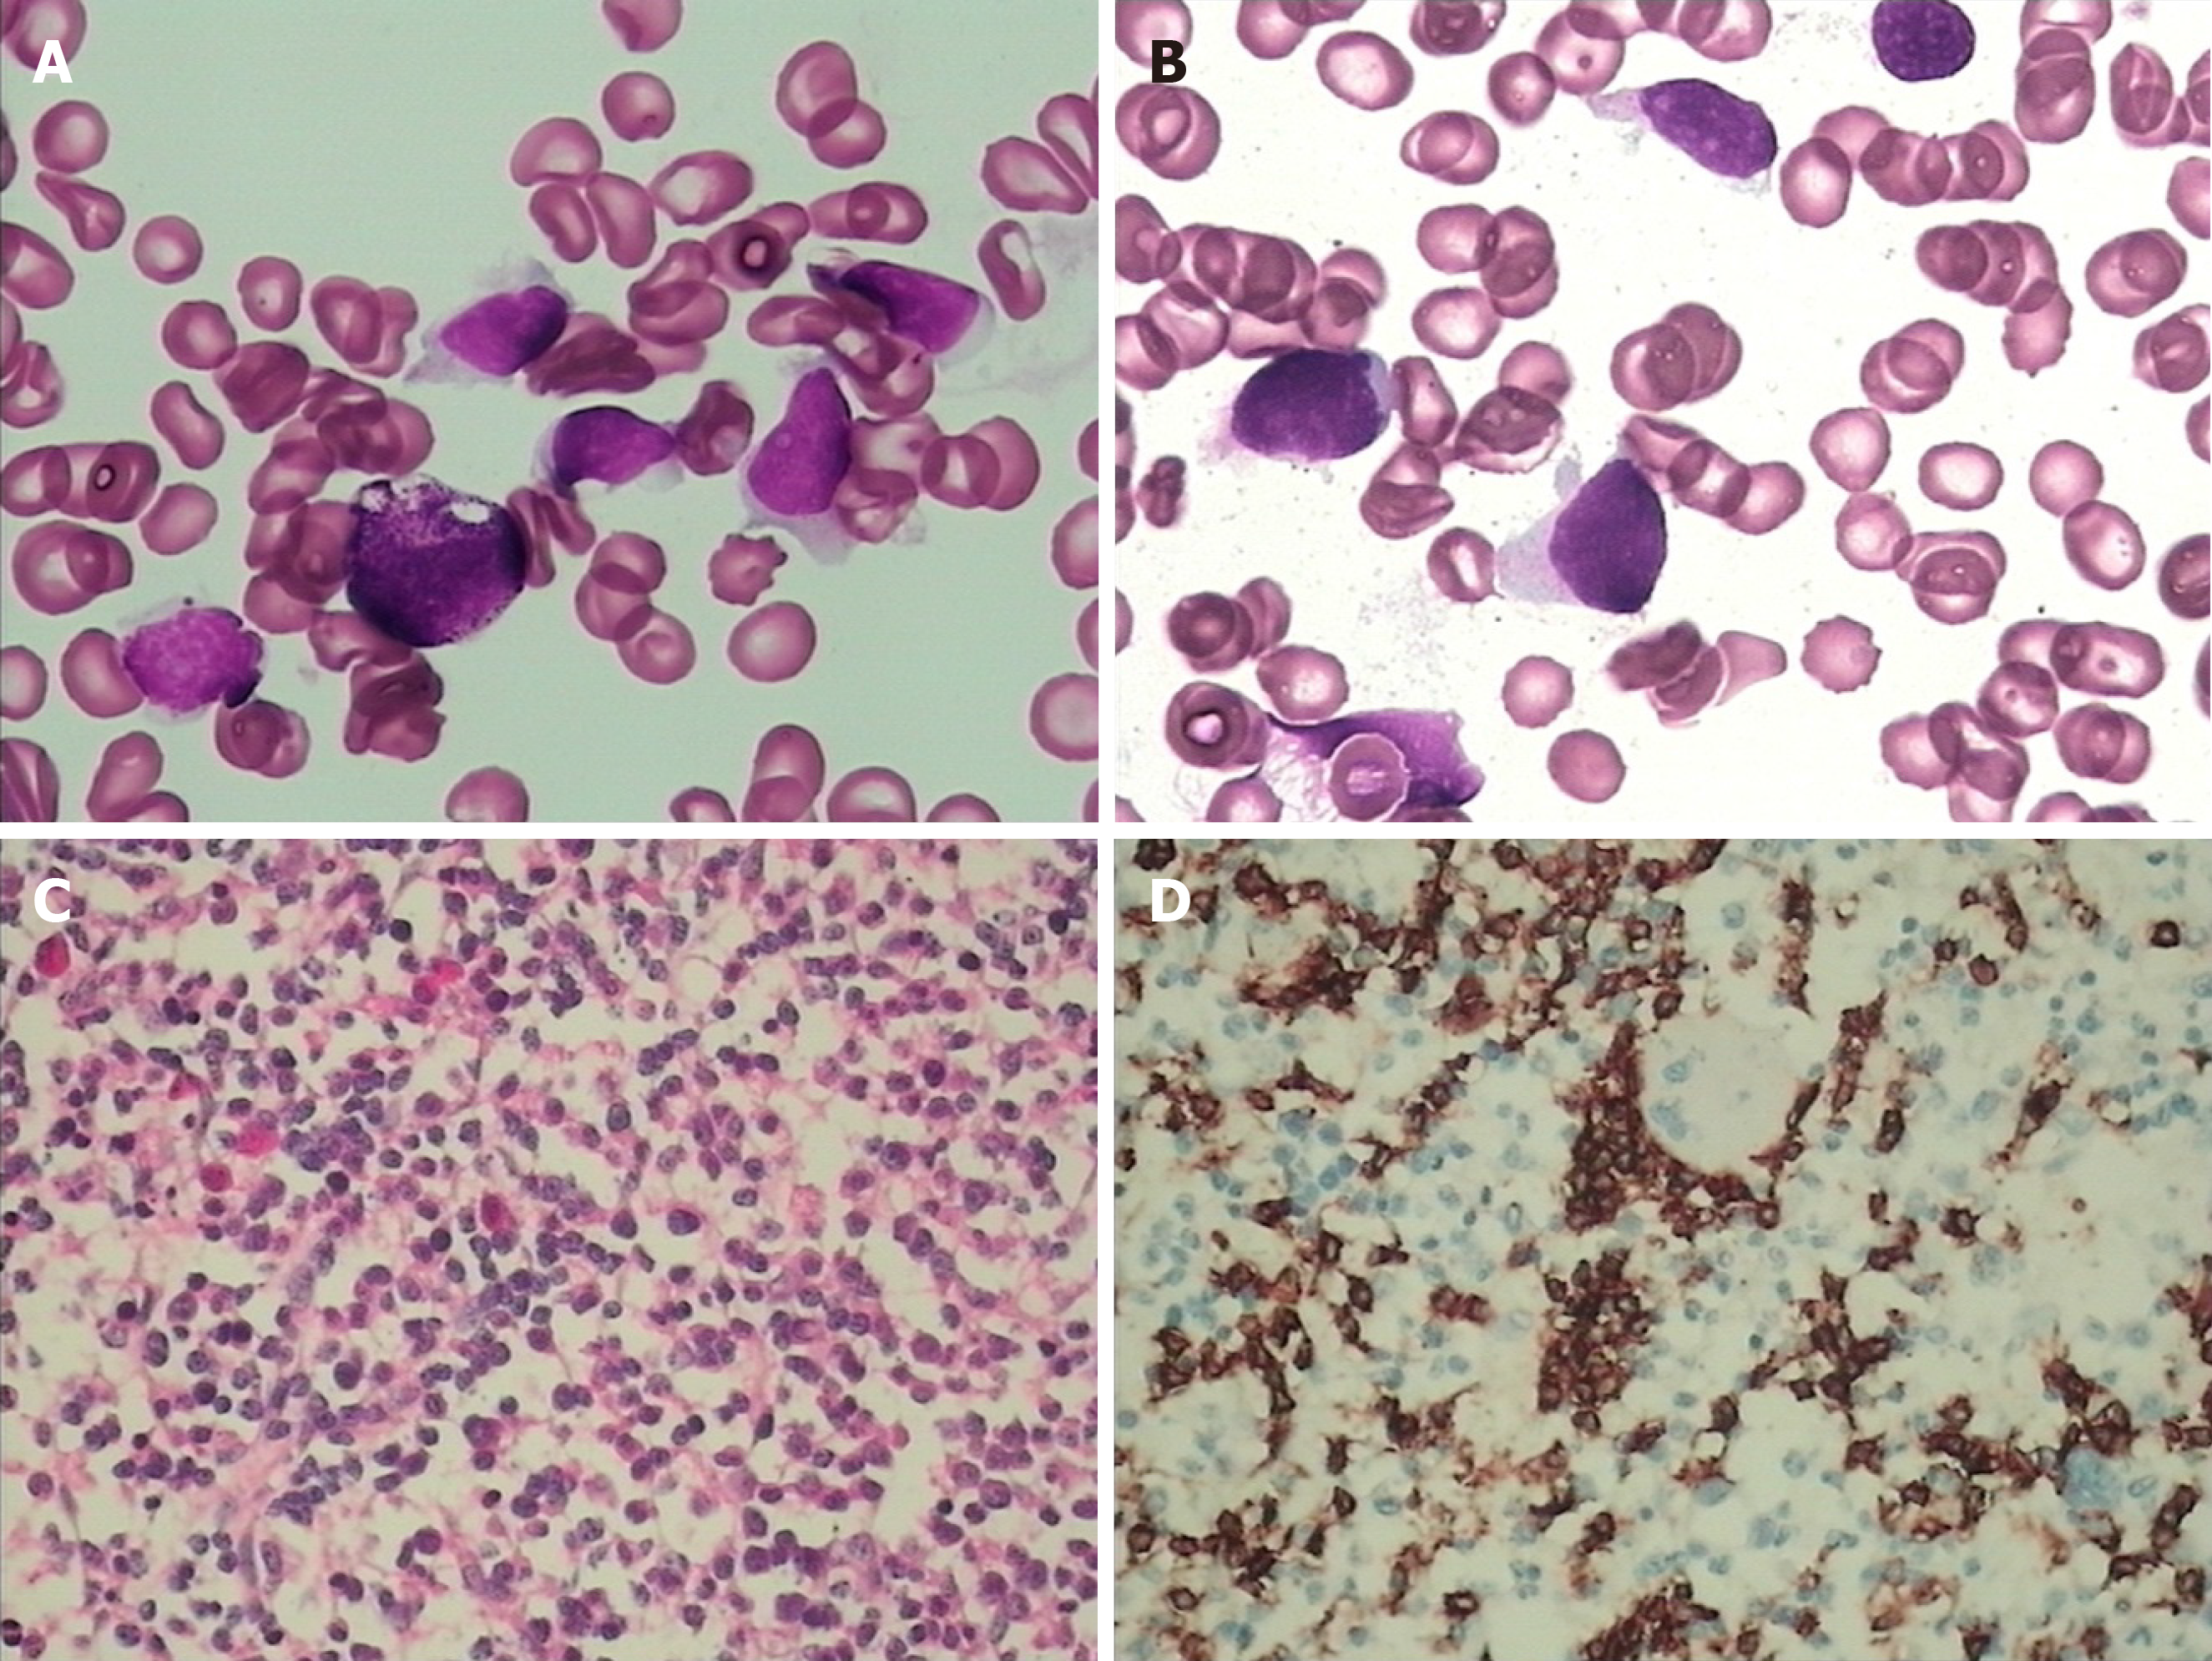
Figure 3 Morphology and immunohistochemistry analysis of bone marrow and peripheral blood.
A and B: Bone marrow aspirate smear (panel A) and blood smear (panel B) show atypical lymphocytes with round or irregular shape, less cytoplasm, irregular nuclear contours, and visible nucleoli (Wright-Giemsa, 1000 ×, oil); C and D: Bone marrow biopsy showed many atypical lymphocyte-infiltrated sinuses (panel C, hematoxylin and eosin staining, 400 ×) were positive for CD3 (panel C, 400 ×).
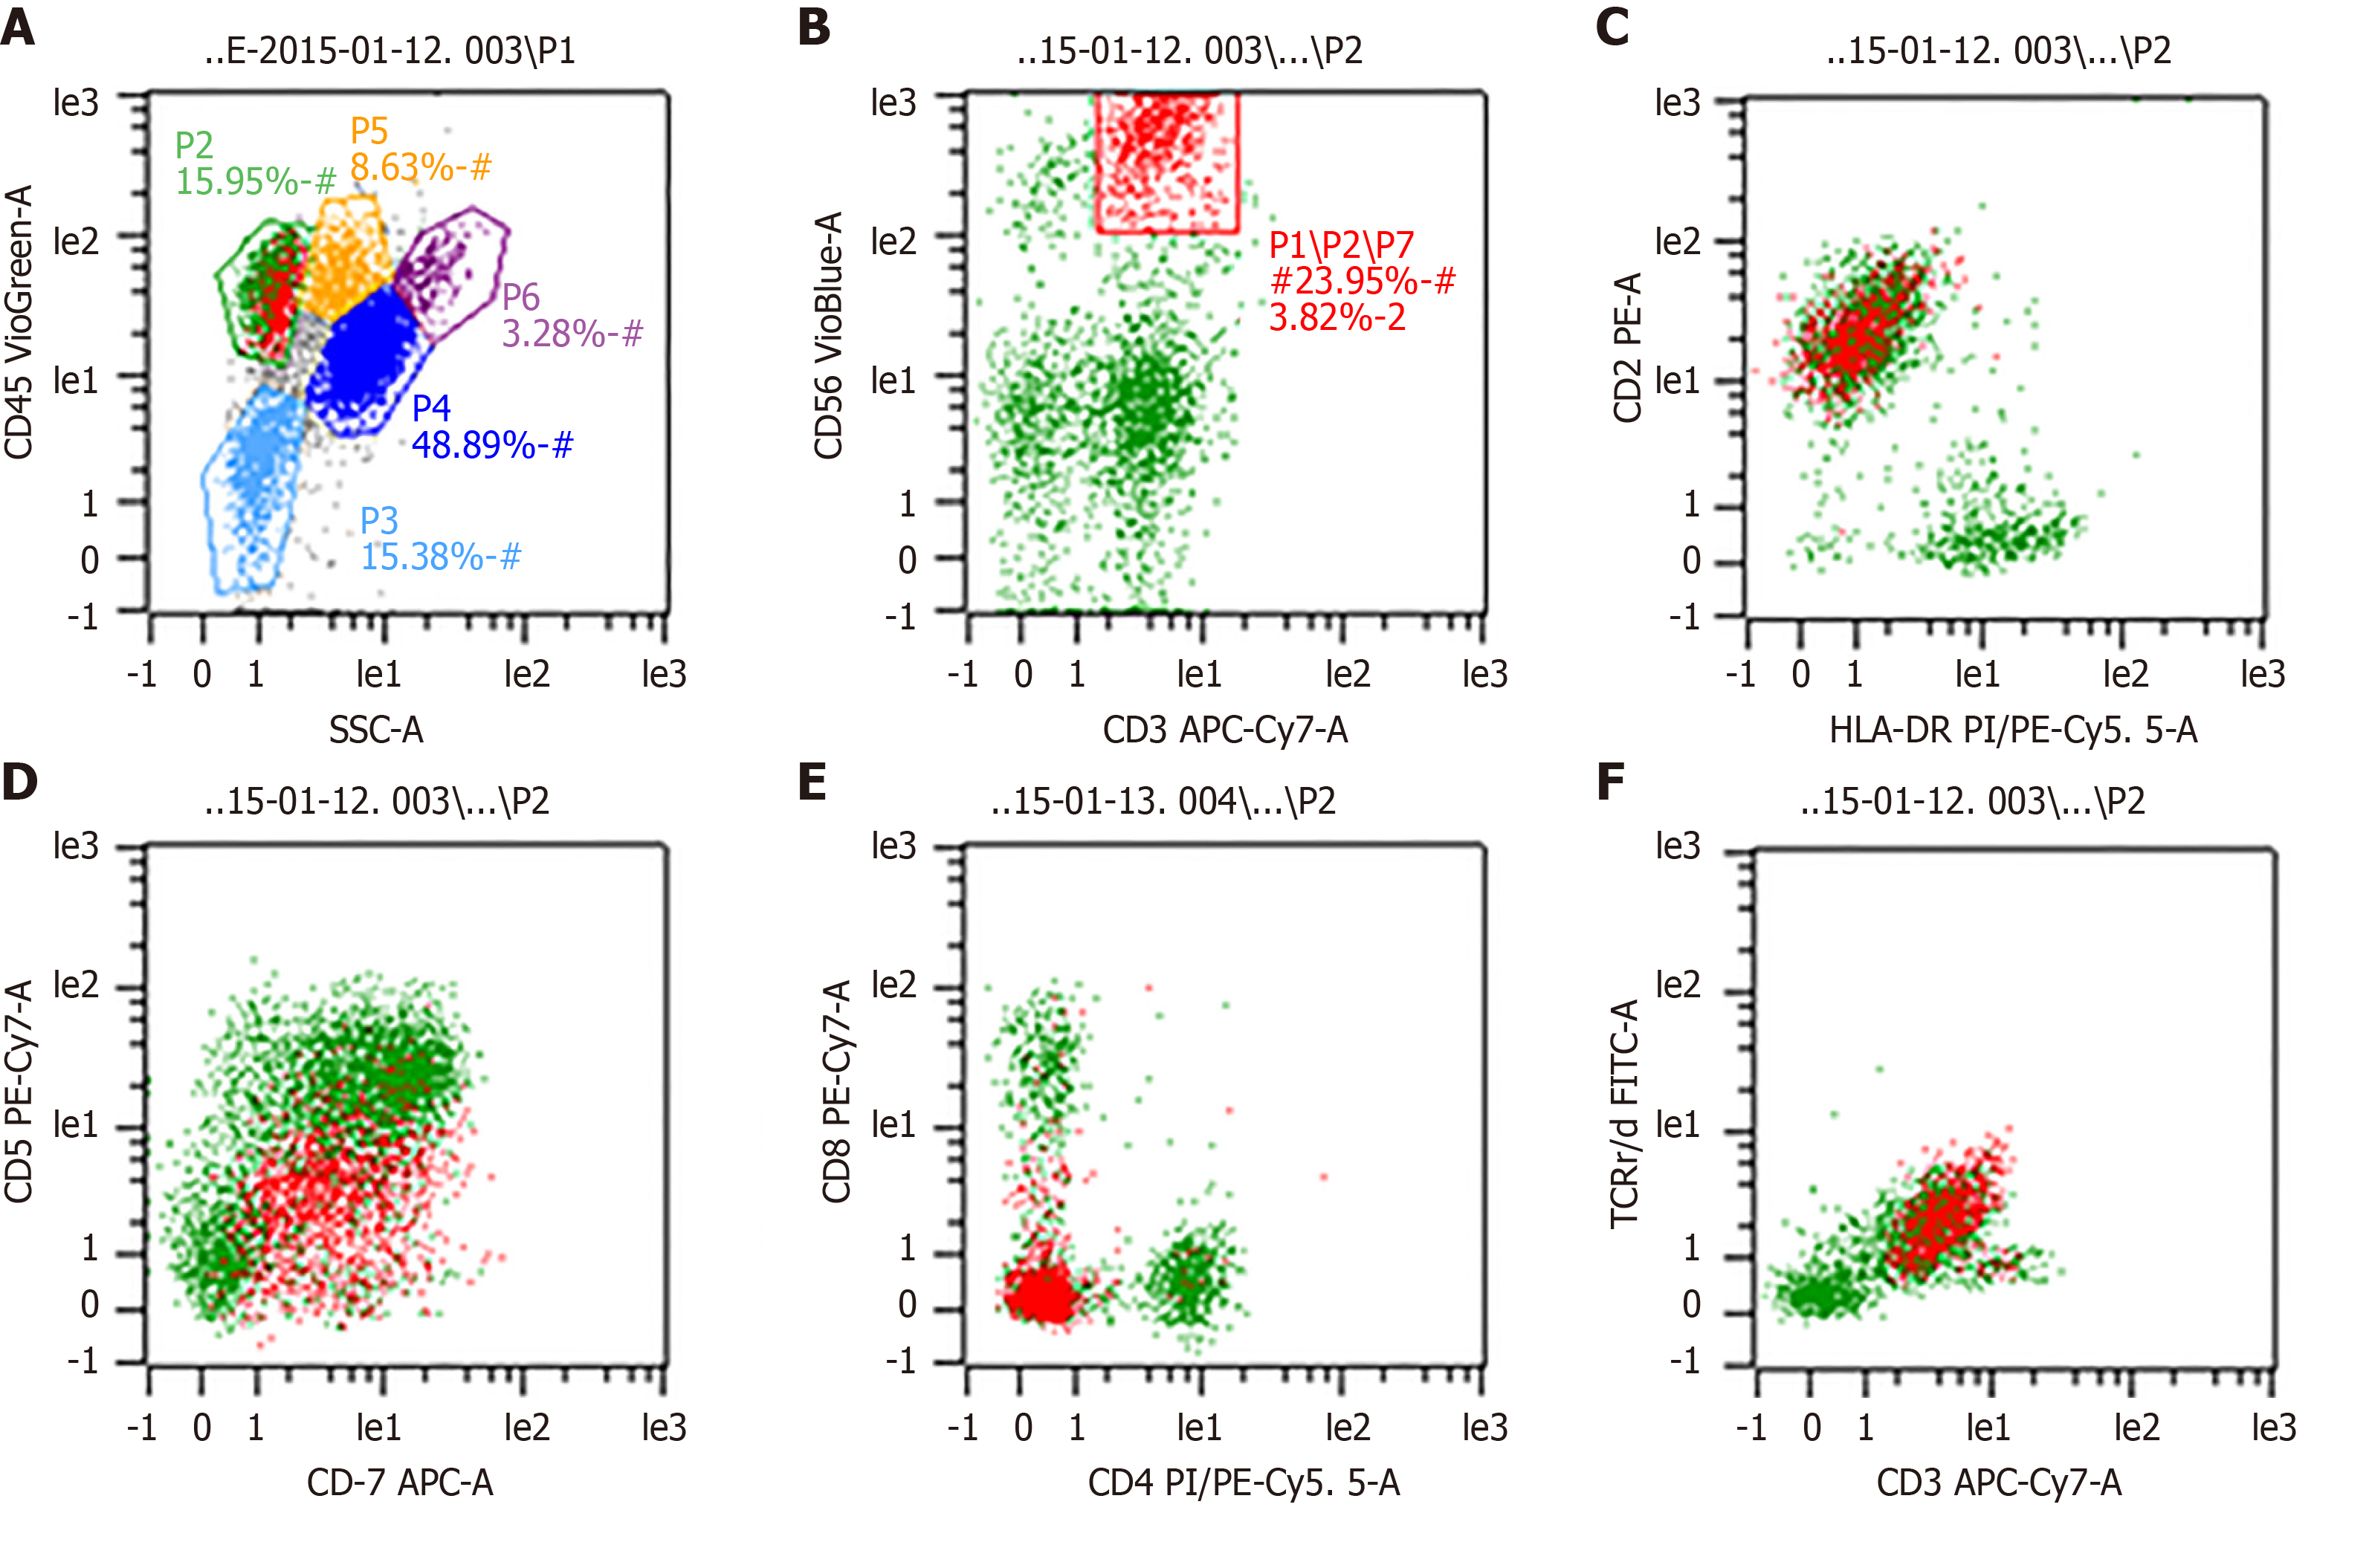
Figure 4 Flow cytometry analysis of the bone marrow.
A-C: The entire population of lymphoid cells is gated (panel A). These atypical lymphocytes, which are red in color, formed 23.95% of all the lymphocytes and are CD3 and CD56 positive (panel B), and they are composed almost entirely of CD2+ cells (panel C); D, E: The gated CD3+ atypical cells were CD5dim positive and CD7 negative (panel D), and CD4 and CD8 negative (panel E); F: These atypical CD3+ lymphocytes also expressed T-cell receptor-γδ.
- Citation: Wang XT, Guo W, Sun M, Han W, Du ZH, Wang XX, Du BB, Bai O. Effect of chidamide on treating hepatosplenic T-cell lymphoma: A case report. World J Clin Cases 2020; 8(14): 3122-3129
- URL: https://www.wjgnet.com/2307-8960/full/v8/i14/3122.htm
- DOI: https://dx.doi.org/10.12998/wjcc.v8.i14.3122


